Chiến lược theo dõi xu hướng của chỉ báo Williams Double EMA

Tổng quan
Chiến lược này kết hợp hai chỉ số EMA và chỉ số Williams để xác định hướng xu hướng và theo dõi khi xu hướng mạnh. Ý tưởng cơ bản của nó là:
- Lưu trữ dữ liệu từ các trang web khác nhau.
- Chỉ số Williams xác nhận hiện đang ở trong khu vực mua quá mức
- Kết hợp với chỉ số RSI để tránh đi theo xu hướng tăng hoặc giảm
Nguyên tắc
Chiến lược này sử dụng EMA ngắn hạn và EMA dài hạn trong hai chỉ số EMA. Khi EMA ngắn hạn tạo ra tín hiệu mua khi đi lên vượt qua EMA dài hạn và EMA ngắn hạn tạo ra tín hiệu bán khi đi xuống vượt qua EMA dài hạn, sử dụng EMA kép để nắm bắt xu hướng trung và dài hạn.
Ngoài ra, chiến lược này cũng kết hợp với chỉ số Williams để xác định sự đảo ngược. Chỉ số Williams phán đoán liệu giá có đang quá mua hay quá bán bằng cách xác định các điểm cao và thấp theo chu kỳ. Khi chỉ số Williams hiển thị quá mua, nó tạo ra tín hiệu bán; khi hiển thị quá bán, nó tạo ra tín hiệu mua.
Có lẽ bạn sẽ thấy điều này trong code của bạn:
Nhiều đầu vào: EMA ngắn hạn vượt qua EMA trung hạn và EMA dài hạn, và chỉ số Williams cho thấy khu vực bán tháo, và khu vực bán tháo hình thành điểm thấp nhất, cho thấy cơ hội đảo ngược, tại thời điểm này tạo ra tín hiệu mua.
Bước đầu vào: EMA ngắn hạn đi qua EMA trung hạn và EMA dài hạn, và chỉ số Williams cho thấy vùng mua quá mức và tạo ra điểm cao nhất trong vùng bán quá mức, cho thấy cơ hội đảo ngược, tại thời điểm này tạo ra tín hiệu bán.
Ngoài ra, các chỉ số RSI cũng được đưa vào chiến lược để xác nhận tín hiệu giao dịch hơn nữa và tránh theo dõi mù quáng các đợt giảm.
Ưu điểm
Lợi thế lớn nhất của chiến lược này là sử dụng hai EMA để lọc ra một lượng lớn các xu hướng không hiệu quả, chỉ chọn xu hướng trung bình và dài hạn mạnh nhất để theo dõi, do đó lọc ra tiếng ồn và giảm các giao dịch không hiệu quả.
Ngoài ra, việc giới thiệu chỉ số Williams cũng có hiệu quả rất tốt. Thứ nhất, nó có thể nhận ra cơ hội đảo ngược, do đó, nó có thể xóa vị thế kịp thời; thứ hai, nó có thể xác nhận thêm hiệu quả của tín hiệu xu hướng.
Sự kết hợp của hai EMA và Williams cho phép chiến lược này có lợi nhuận theo dõi tốt trong các giống trung và dài hạn, đồng thời cũng có thể nhận ra sự đảo ngược và hạn chế tổn thất.
Rủi ro
Rủi ro chính của chiến lược này là khó xác định điểm đảo ngược xu hướng. Mặc dù đã giới thiệu chỉ số Williams và chỉ số RSI để đảm bảo tính hiệu quả của giao dịch đảo ngược, nhưng sự khó khăn của giao dịch đảo ngược vẫn rất lớn và không thể hoàn toàn tránh được rủi ro của việc chôn vùi.
Ngoài ra, các cặp EMA đôi cũng có một sự chậm trễ nhất định. Khi xu hướng ngắn hạn và xu hướng trung hạn bị mất liên kết, nó cũng có thể gây ra một số khó khăn trong việc xác định chiến lược.
Tối ưu hóa
Chiến lược này có thể được tối ưu hóa theo các khía cạnh sau:
-
Kiểm tra thêm các kết hợp chu kỳ EMA để tìm các tham số tốt hơn
-
Tăng cơ chế thoát thích ứng, sử dụng các chỉ số như ATR, chỉ số biến động để đánh giá xu hướng đảo ngược
-
Thêm các yếu tố học máy, sử dụng LSTM để dự đoán xu hướng và đảo ngược
-
Sử dụng các phương pháp như lý thuyết sóng để hoàn thiện hơn nữa các quy tắc giao dịch đảo ngược
-
Tiếp theo là việc đưa ra quản lý vị trí thích ứng, điều chỉnh quy mô vị trí theo thị trường.
Tóm tắt
Chiến lược này kết hợp thành công với hai EMA và chỉ số Williams để nắm bắt xu hướng trung hạn dài hạn, thu được lợi nhuận cao hơn trong xu hướng lớn. Đồng thời, việc giới thiệu chỉ số Williams cũng cho phép chiến lược nhận ra sự đảo ngược và dừng lỗ kịp thời. Bước tiếp theo, bằng cách giới thiệu nhiều chỉ số và mô hình để tối ưu hóa, tăng cường sự ổn định của chiến lược hơn nữa.
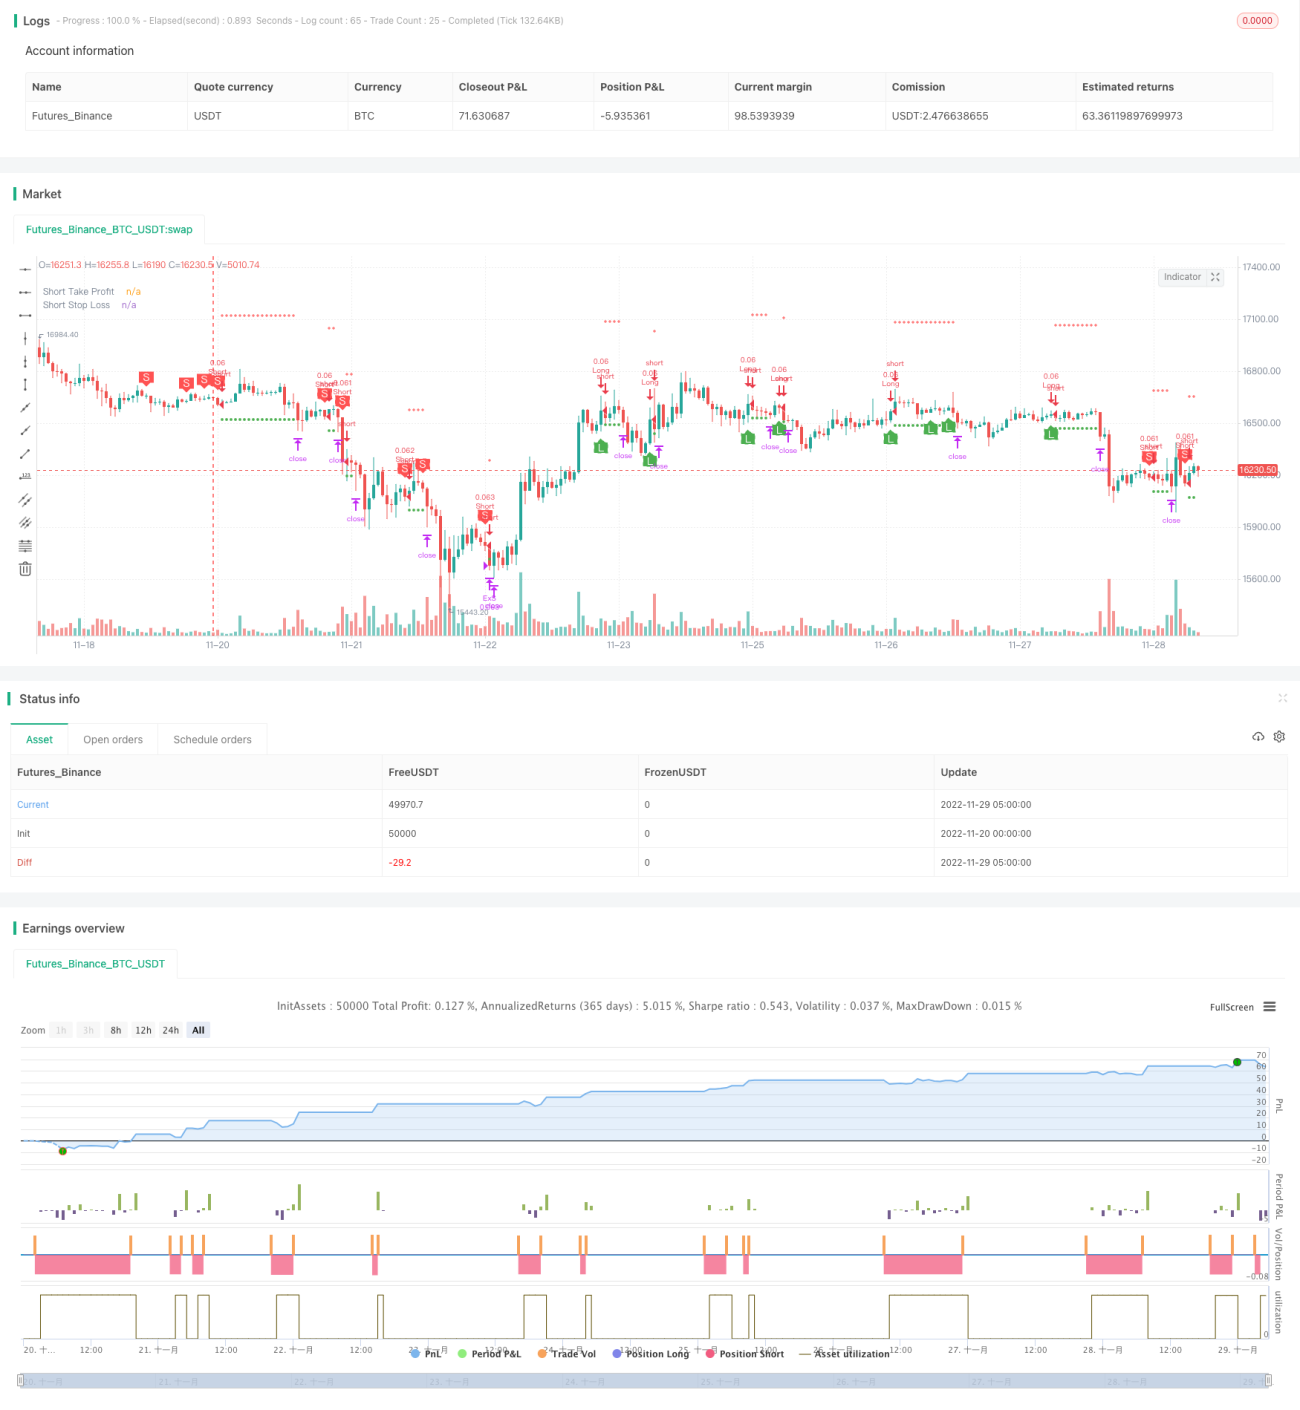
/*backtest
start: 2022-11-20 00:00:00
end: 2022-11-29 05:20:00
period: 1h
basePeriod: 15m
exchanges: [{"eid":"Futures_Binance","currency":"BTC_USDT"}]
*/

// This source code is subject to the terms of the Mozilla Public License 2.0 at https://mozilla.org/MPL/2.0/
// © B_L_A_C_K_S_C_O_R_P_I_O_N
// v 1.1
- 1