Chiến lược đột phá độ lệch chuẩn của dải Bollinger

1
Follow
1779
Followers
Tổng quan
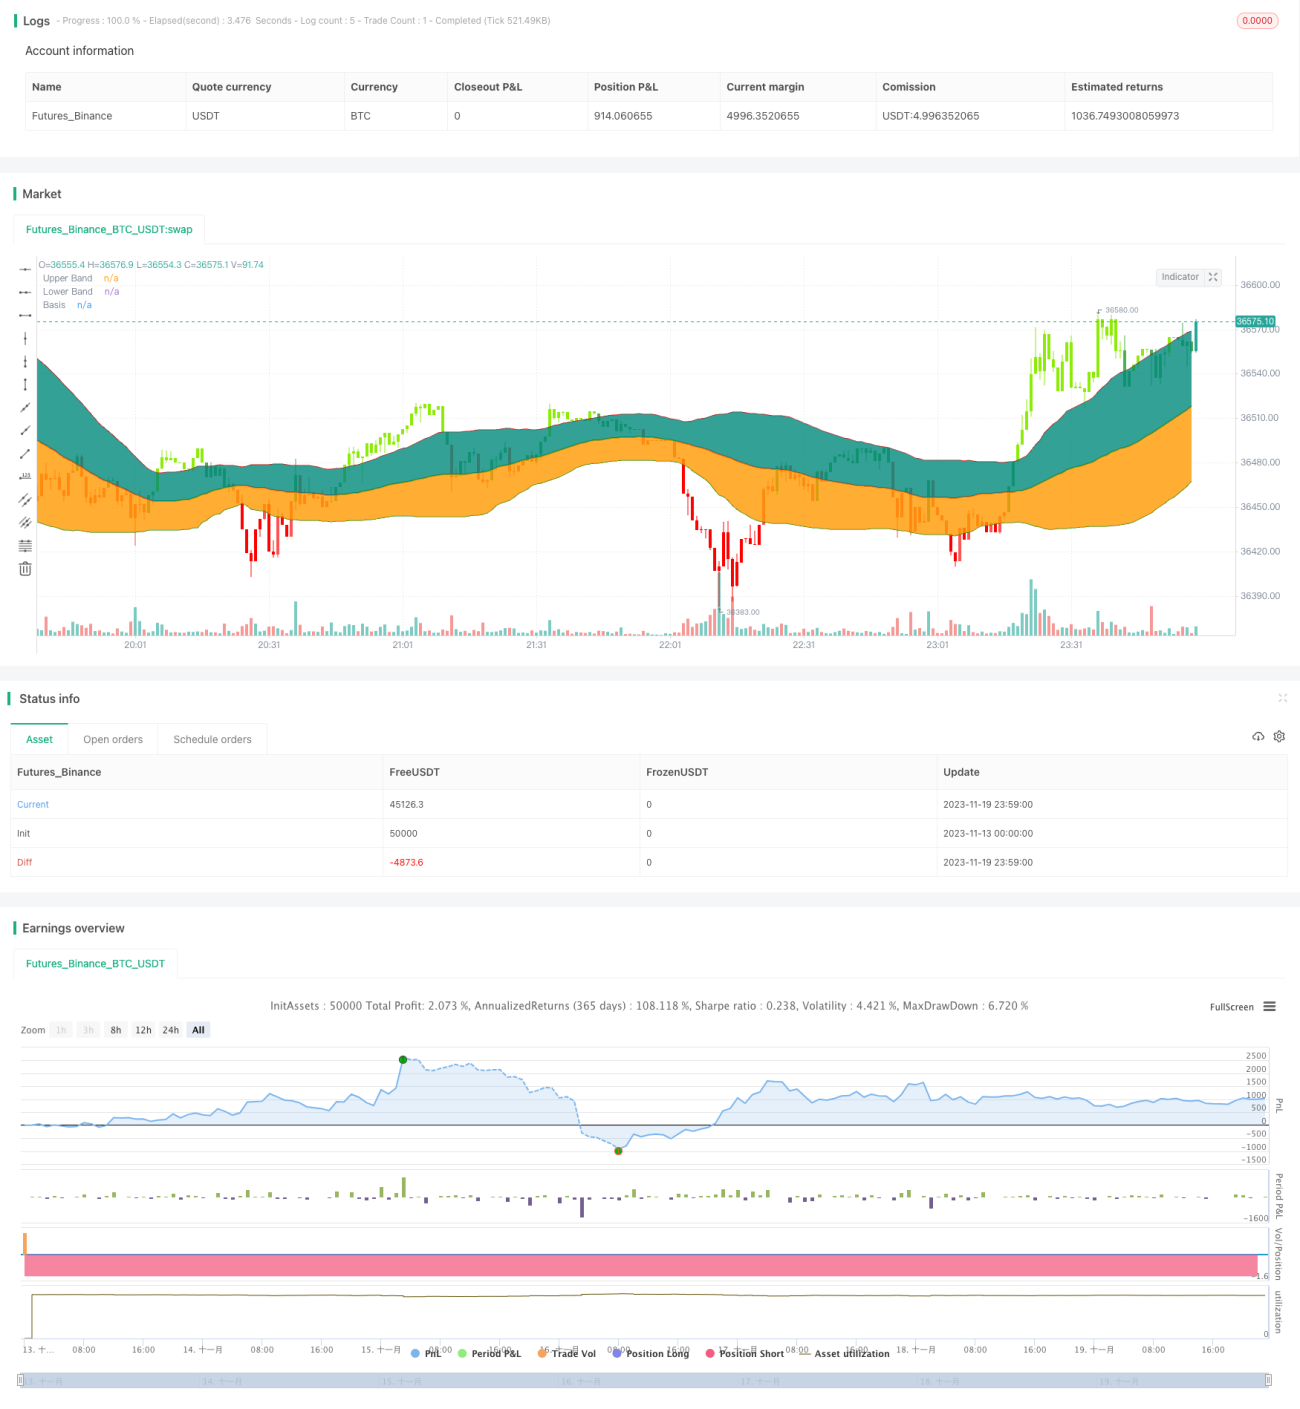
Chiến lược này dựa trên các chỉ số Bollinger Bands cổ điển, làm nhiều khi giá đóng cửa phá vỡ đường lên và làm rỗng khi giá đóng cửa phá vỡ đường xuống, thuộc chiến lược theo dõi xu hướng phá vỡ.
Nguyên tắc chiến lược
- Đường chuẩn là trung bình di chuyển đơn giản 55 ngày.
- Các đường ray trên và dưới là các điểm khác nhau theo tiêu chuẩn trên đường chuẩn.
- Các tín hiệu khác nhau được tạo ra khi giá đóng cửa phá vỡ đường đua.
- Một tín hiệu giảm giá được tạo ra khi giá đóng cửa phá vỡ đường mòn.
- Tiêu chuẩn phân chênh lệch thay vì tiêu chuẩn phân chênh lệch hai lần theo tiêu chuẩn cổ điển làm giảm nguy cơ.
Phân tích lợi thế
- Việc sử dụng các giá trị chuẩn thay vì giá trị cố định làm giảm nguy cơ.
- Đường trung bình di chuyển 55 ngày có thể phản ánh tốt hơn xu hướng trung hạn.
- Tiếp theo, các nhà đầu tư khác cũng có thể sẽ có những bước đột phá khác.
- Dễ dàng xác định xu hướng thông qua phân tích thời gian.
Phân tích rủi ro
- Có thể gây ra những biến động nhỏ.
- Bạn cần phải xem xét các tác động của phí xử lý.
- Các tín hiệu đột phá có thể là đột phá giả.
- Có thể có điểm thua lỗ.
Bạn có thể giảm rủi ro bằng cách đặt lệnh dừng lỗ, tính phí giao dịch hoặc thêm bộ lọc chỉ số.
Hướng tối ưu hóa
- Tối ưu hóa tham số đường chuẩn, tìm đường trung bình tốt nhất.
- Các tiêu chuẩn tối ưu hóa khác nhau, tìm các tham số tối ưu.
- Các chỉ số giá trị phụ trợ.
- Thêm hệ thống ngăn chặn thiệt hại.
Tóm tắt
Chiến lược này có logic tổng thể rõ ràng, điều chỉnh rủi ro thông qua băng thông chênh lệch tiêu chuẩn, phá vỡ đóng cửa để tránh phá vỡ giả. Tuy nhiên, vẫn cần chú ý để ngăn chặn tổn thất xung đột, có thể được tối ưu hóa bằng cách dừng lỗ, thêm bộ lọc.
Source
Pine
Strategy parameters
Related strategies
Comment
All comments (0)
No data
- 1