Chiến lược Bollinger Bands Golden Cross và Dead Cross

Tổng quan
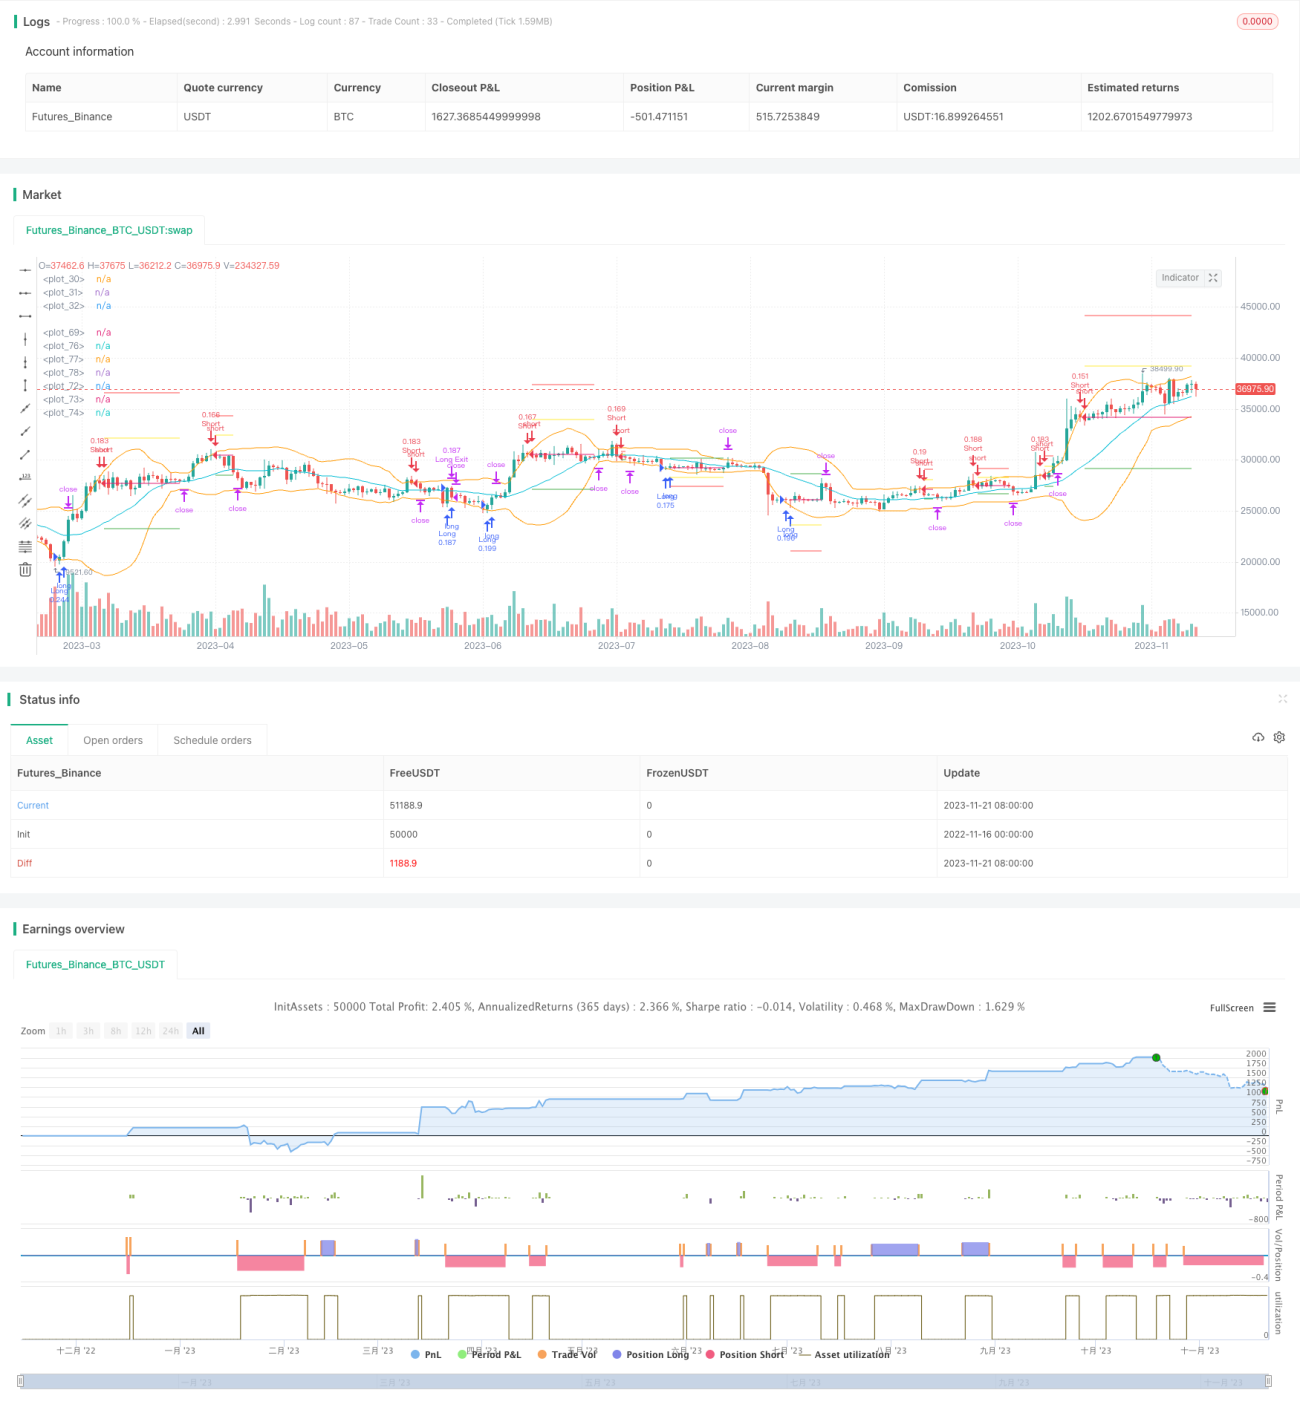
Chiến lược này dựa trên Bollinger Bands Gold Fork Dead Fork để thực hiện nhiều giao dịch ngắn hạn. Khi giá phá vỡ Bollinger Bands lên đường, hãy tháo dỡ; Khi giá phá vỡ Bollinger Bands xuống đường, hãy làm nhiều. Trong thời gian giữ vị trí, sẽ có thêm vị trí và theo dõi dừng lỗ.
Nguyên tắc chiến lược
Chiến lược này sử dụng 3 quỹ đạo trên và dưới của Brin. quỹ đạo trung tâm của Brin là trung bình chuyển động n ngày, quỹ đạo trên là chênh lệch tiêu chuẩn n ngày của quỹ đạo trung tâm + k lần, quỹ đạo dưới là quỹ đạo trung tâm - k lần của chênh lệch tiêu chuẩn n ngày.
Khi giá từ dưới lên phá vỡ đường xuống, cho thấy giá bắt đầu tăng, lúc này làm nhiều; khi giá từ trên xuống phá vỡ đường lên, cho thấy giá bắt đầu giảm, lúc này làm trống.
Sau khi thực hiện tháo lỗ nhiều hơn, sẽ tiếp tục gia tăng vị thế. Điều kiện của việc gia tăng vị thế là dựa trên vị trí đã nắm giữ, nếu giá chạm lại đường trung bình, sẽ mở thêm vị trí hoặc tháo lỗ.
Theo dõi dừng của tất cả các vị trí cũng được cập nhật trong thời gian thực. Đường dừng sẽ được thiết lập dựa trên giá trung bình của vị trí hiện tại và giá Brin.
Phân tích lợi thế
Chiến lược này có những ưu điểm sau:
- Sử dụng chỉ số BRI để nắm bắt các đợt phá vỡ giá, thực hiện thêm các lệnh nhượng quyền chính xác
- Các trường hợp này có thể được xác định bởi các nhà khoa học và các chuyên gia.
- Cổ phiếu của bạn sẽ được tăng lên để bạn có thể kiếm thêm tiền.
- Cập nhật lỗ hổng trong thời gian thực để tránh bị ảnh hưởng
Phân tích rủi ro
Chiến lược này cũng có một số rủi ro:
- Blinking là một chỉ số nhạy cảm với biến động thị trường và có thể bị phá giá.
- Phương thức gia tăng rủi ro làm tăng lỗ hổng
- Tuy nhiên, các nhà nghiên cứu cho rằng, điều này có thể gây ra một số vấn đề.
Những rủi ro này có thể được tối ưu hóa bằng cách:
- Điều chỉnh các tham số của Brin để phù hợp với các chu kỳ khác nhau
- Tối ưu hóa mức độ và tần suất gia tăng
- Tăng đường ray trung tâm như là một đường dừng thêm
Hướng tối ưu hóa
Chiến lược này có thể được tối ưu hóa theo các khía cạnh sau:
- Tối ưu hóa các tham số của Brin Belt để thích ứng với nhiều môi trường thị trường hơn
- Tối ưu hóa logic gia tăng, cân bằng rủi ro và lợi nhuận
- Tăng dây dừng lỗ, chẳng hạn như dừng đường ray trung tâm
- Tăng chiến lược chống ngưng và chủ động hơn
- Kiểm tra thời gian nhập cảnh kết hợp các chỉ số khác
- Tối ưu hóa quản lý tài chính, kiểm soát rủi ro đơn lẻ
Tóm tắt
Chiến lược này nói chung là một chiến lược theo dõi xu hướng điển hình. Nó có thể theo dõi và thu lợi nhuận khi xu hướng xuất hiện. Đồng thời, nó cũng có một số rủi ro cần được tối ưu hóa và cải tiến hơn nữa để thích ứng với nhiều tình huống thị trường hơn, giảm nguy cơ phá vỡ giả.
/*backtest
start: 2022-11-16 00:00:00
end: 2023-11-22 00:00:00
period: 1d
basePeriod: 1h
exchanges: [{"eid":"Futures_Binance","currency":"BTC_USDT"}]
*/

//@version=5

strategy(title='Bollinger Band strategy with split, limit, stop', shorttitle='bb strategy', overlay=true,commission_type = strategy.commission.percent, commission_value = 0.01, default_qty_type = strategy.percent_of_equity, default_qty_value = 10, pyramiding = 4)
- 1