Chiến lược đột phá siêu xu hướng xuyên khung thời gian
Tổng quan
Chiến lược này kết hợp các chỉ số siêu xu hướng với các chỉ số vòng đai Brin trong nhiều khung thời gian, xác định hướng xu hướng và các mức kháng cự hỗ trợ quan trọng, thực hiện các mục nhập khi rung chuyển, và dựa trên vị trí thoát khỏi chéo. Chiến lược này chủ yếu áp dụng cho các loại tương lai hàng hóa có biến động cao, chẳng hạn như vàng, bạc, dầu thô.
Nguyên tắc chiến lược
Hàm siêu xu hướng đa khung thời gian tùy chỉnh dựa trên Pine Scriptpine_supertrend(), kết hợp các chu kỳ khác nhau (ví dụ 1 phút và 5 phút) để xác định hướng của xu hướng chu kỳ lớn.
Trong khi đó, tính toán Bollinger Bands xuống đường, để phán quyết phá vỡ kênh. Khi giá phá vỡ Bollinger Bands lên đường, coi là phá vỡ giá trị; Khi giá giảm xuống Bollinger Bands xuống đường, coi là phá vỡ giá giảm.
Tín hiệu chiến lược:
Tín hiệu đa đầu: giá đóng cửa > Brin bắt đầu và giá đóng cửa > Chỉ số siêu xu hướng nhiều khung thời gian Tín hiệu đầu trống: giá đóng cửa < Brin đi xuống đường và giá đóng cửa < Chỉ số siêu xu hướng nhiều khung thời gian
Giảm lỗ:
Nhiều đầu dừng: giá đóng cửa < 5 phút chỉ số siêu xu hướng Hạn chế đầu trống: giá đóng cửa > chỉ số xu hướng siêu 5 phút
Do đó, chiến lược nắm bắt sự đột phá cộng hưởng của chỉ số siêu xu hướng với chỉ số BRI, xử lý giao dịch trong tình trạng biến động cao.
Phân tích lợi thế
- Sử dụng chỉ số xu hướng siêu thời gian đa khung để xác định hướng xu hướng chu kỳ lớn, cải thiện chất lượng tín hiệu
- Brin đai trên và dưới đường ray như là điểm kháng cự hỗ trợ quan trọng, có thể làm giảm đột phá giả
- Chỉ số siêu xu hướng như là điểm dừng lỗ, giảm lỗ, kiểm soát rủi ro
Phân tích rủi ro
- Các chỉ số siêu xu hướng có thể bị chậm trễ và có thể bỏ lỡ điểm đảo ngược xu hướng
- Thiết lập không đúng các tham số của Brin có thể dẫn đến quá nhiều hoặc quá nhiều giao dịch bị mất
- Giá của hàng hóa tương lai có thể biến động mạnh khi xảy ra giao dịch đêm hoặc các sự kiện quan trọng
Phương pháp giải quyết rủi ro:
- Kết hợp nhiều tín hiệu xác nhận phụ trợ để tránh đột phá giả
- Tối ưu hóa các tham số Brin để tìm điểm cân bằng tốt nhất
- Điều chỉnh vị trí dừng để mở rộng khoảng cách dừng
Hướng tối ưu hóa
- Thử các chỉ số xu hướng khác, như KDJ, MACD, như là phán đoán hỗ trợ
- Tăng khả năng phán đoán của mô hình học máy
- Tối ưu hóa tham số để tìm ra sự kết hợp siêu tham số tốt nhất
Tóm tắt
Chiến lược này tích hợp siêu xu hướng với hai chỉ số hiệu quả của vùng Brin, để thực hiện điều khiển có xác suất cao thông qua phân tích khung thời gian và phán đoán đột phá kênh. Chiến lược kiểm soát rủi ro tài chính một cách hiệu quả và xác nhận có thể thu được lợi nhuận tốt hơn trong các giống biến động cao. Hiệu quả của chiến lược cũng có thể được nâng cao bằng cách tối ưu hóa và kết hợp các chỉ số hơn nữa.
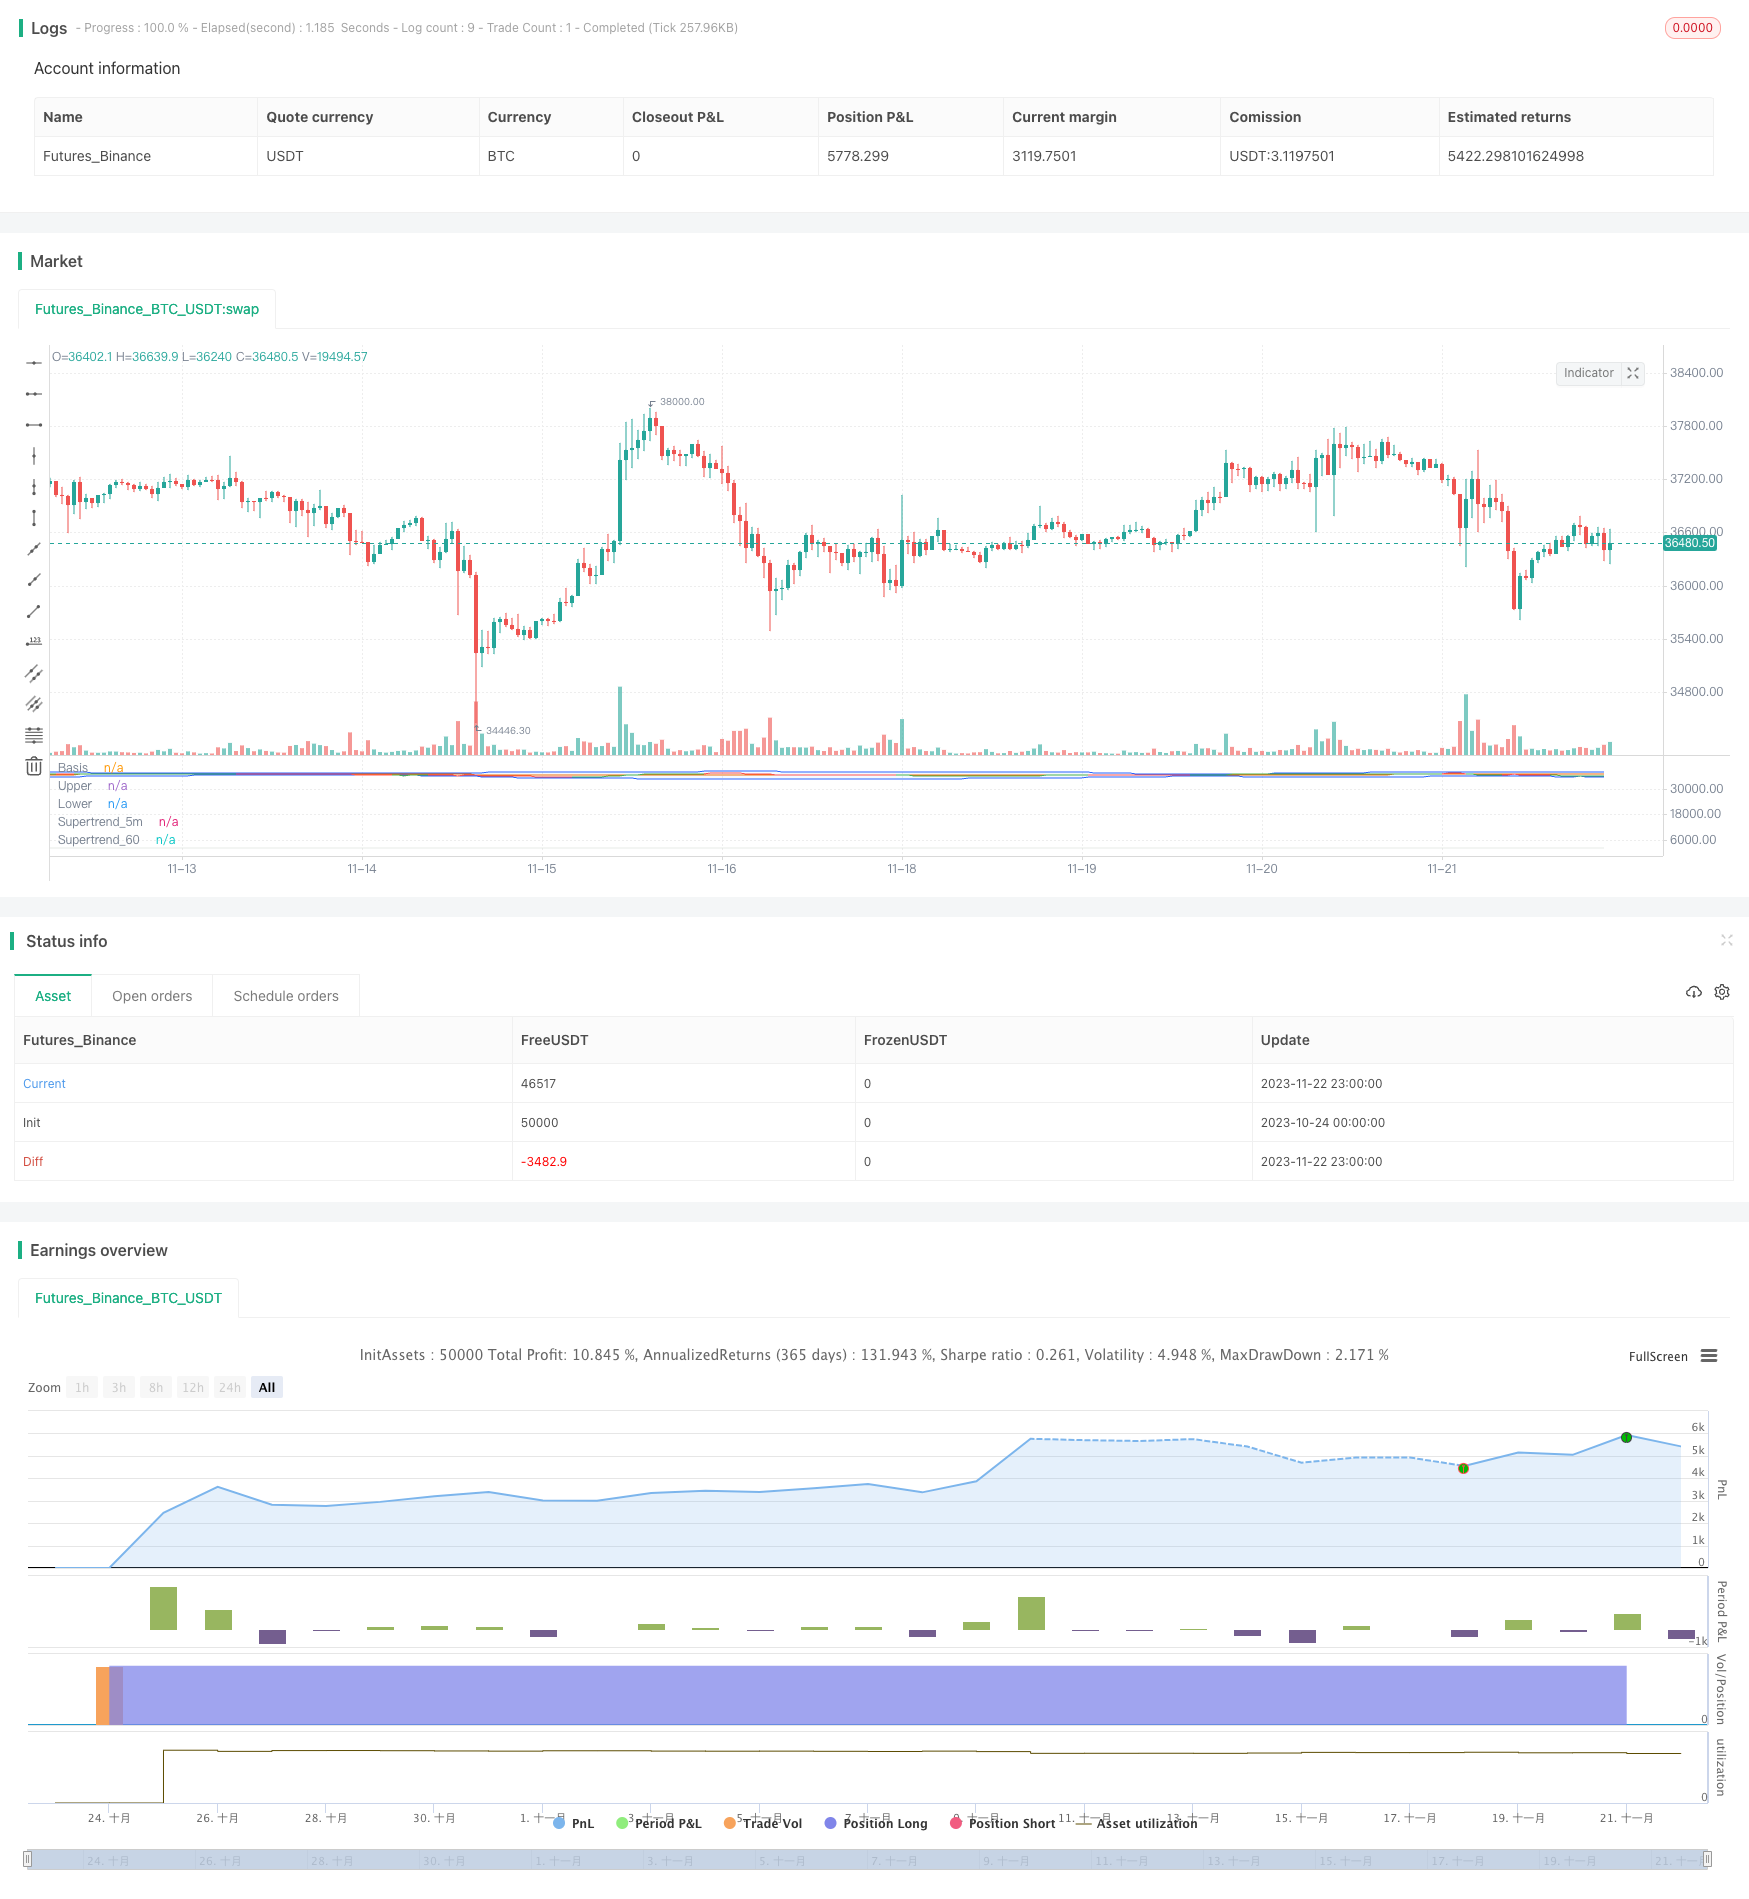
/*backtest
start: 2023-10-24 00:00:00
end: 2023-11-23 00:00:00
period: 1h
basePeriod: 15m
exchanges: [{"eid":"Futures_Binance","currency":"BTC_USDT"}]
*/

// This source code is subject to the terms of the Mozilla Public License 2.0 at https://mozilla.org/MPL/2.0/
// © ambreshc95

//@version=5
strategy("Comodity_SPL_Strategy_01", overlay=false)

// function of st
// [supertrend, direction] = ta.supertrend(3, 10)
// plot(direction < 0 ? supertrend : na, "Up direction", color = color.green, style=plot.style_linebr)
// plot(direction > 0 ? supertrend : na, "Down direction", color = color.red, style=plot.style_linebr)

// VWAP
// src_vwap = input(title = "Source", defval = hlc3, group="VWAP Settings")
// [_Vwap,stdv,_] = ta.vwap(src_vwap,false,1)
// plot(_Vwap, title="VWAP", color = color.rgb(0, 0, 0))


// The same on Pine Script®
pine_supertrend(factor, atrPeriod,len_ma) =>

    h= ta.sma(high,len_ma)
    l= ta.sma(low,len_ma)
    hlc_3 = (h+l)/2
    src = hlc_3
    atr = ta.atr(atrPeriod)
    upperBand = src + factor * atr
    lowerBand = src - factor * atr
    prevLowerBand = nz(lowerBand[1])
    prevUpperBand = nz(upperBand[1])

    lowerBand := lowerBand > prevLowerBand or close[1] < prevLowerBand ? lowerBand : prevLowerBand
    upperBand := upperBand < prevUpperBand or close[1] > prevUpperBand ? upperBand : prevUpperBand
    int direction = na
    float superTrend = na
    prevSuperTrend = superTrend[1]
    if na(atr[1])
        direction := 1
    else if prevSuperTrend == prevUpperBand
        direction := close > upperBand ? -1 : 1
    else
        direction := close < lowerBand ? 1 : -1
    superTrend := direction == -1 ? lowerBand : upperBand
    [superTrend, direction]
len_ma_given = input(75, title="MA_SMA_ST")
[Pine_Supertrend, pineDirection] = pine_supertrend(3, 10,len_ma_given)
// plot(pineDirection < 0 ? Pine_Supertrend : na, "Up direction", color = color.green, style=plot.style_linebr)
// plot(pineDirection > 0 ? Pine_Supertrend : na, "Down direction", color = color.red, style=plot.style_linebr)
//
// Define Supertrend parameters
atrLength = input(10, title="ATR Length")
factor = input(3.0, title="Factor")

// // Calculate Supertrend
[supertrend, direction] = ta.supertrend(factor, atrLength)

st_color = supertrend > close ? color.red : color.green
// // Plot Supertrend
// plot(supertrend, "Supertrend", st_color)
//

// BB Ploting
length = input.int(75, minval=1)
maType = input.string("SMA", "Basis MA Type", options = ["SMA", "EMA", "SMMA (RMA)", "WMA", "VWMA"])
src = input(close, title="Source")
mult = input.float(2.5, minval=0.001, maxval=50, title="StdDev")

ma(source, length, _type) =>
    switch _type
        "SMA" => ta.sma(source, length)
        "EMA" => ta.ema(source, length)
        "SMMA (RMA)" => ta.rma(source, length)
        "WMA" => ta.wma(source, length)
        "VWMA" => ta.vwma(source, length)

basis = ma(src, length, maType)
dev = mult * ta.stdev(src, length)
upper = basis + dev
lower = basis - dev
offset = input.int(0, "Offset", minval = -500, maxval = 500)
plot(basis, "Basis", color=#FF6D00, offset = offset)
p1 = plot(upper, "Upper", color=#2962FF, offset = offset)
p2 = plot(lower, "Lower", color=#2962FF, offset = offset)
fill(p1, p2, title = "Background", color=color.rgb(33, 150, 243, 95))


// h= ta.sma(high,60)
// l= ta.sma(low,60)
// c= sma(close,60)
// hlc_3 = (h+l)/2
// supertrend60 = request.security(syminfo.tickerid,  supertrend)

// // Define timeframes for signals
tf1 = input(title="Timeframe 1", defval="1")
tf2 = input(title="Timeframe 2",defval="5")
// tf3 = input(title="Timeframe 3",defval="30")


// // // Calculate Supertrend on multiple timeframes
supertrend_60 = request.security(syminfo.tickerid, tf1, Pine_Supertrend)
supertrend_5m = request.security(syminfo.tickerid, tf2, supertrend)
// supertrend3 = request.security(syminfo.tickerid, tf3, supertrend)

// // Plot Supertrend_60
st_color_60 = supertrend_60 > close ? color.rgb(210, 202, 202, 69) : color.rgb(203, 211, 203, 52)
plot(supertrend_60, "Supertrend_60", st_color_60)

// // Plot Supertrend_5m
st_color_5m = supertrend_5m > close ? color.red : color.green
plot(supertrend_5m, "Supertrend_5m", st_color_5m)


ma21 = ta.sma(close,21)
// rsi = ta.rsi(close,14)
// rsima = ta.sma(rsi,14)

// Define the Indian Standard Time (IST) offset from GMT
ist_offset = 5.5 // IST is GMT+5:30

// Define the start and end times of the trading session in IST
// start_time = timestamp("GMT", year, month, dayofmonth, 10, 0) + ist_offset * 60 * 60
// end_time = timestamp("GMT", year, month, dayofmonth, 14, 0) + ist_offset * 60 * 60
// Check if the current time is within the trading session
// in_trading_session = timenow >= start_time and timenow <= end_time

in_trading_session = not na(time(timeframe.period, "0945-1430"))
// bgcolor(inSession ? color.silver : na)
out_trading_session = not na(time(timeframe.period, "1515-1530"))
// // // Define buy and sell signals
buySignal = close>upper and close > supertrend_5m and close > supertrend_60 and close > ma21  and in_trading_session //close > supertrend and
sellSignal = close<lower and close < supertrend_5m and close < supertrend_60 and close < ma21  and in_trading_session //close < supertrend and

var bool long_position = false
var bool long_exit = false
var float long_entry_price = 0
var float short_entry_price = 0

if buySignal and not long_position
    // label.new(bar_index, na, yloc = yloc.belowbar, style = label.style_label_up, color = color.green, size = size.small)
    long_position := true
    strategy.entry("Buy",strategy.long)

long_exit := (close < supertrend_5m)
if long_position and long_exit
    // label.new(bar_index, na, yloc = yloc.belowbar, style = label.style_xcross, color = color.green, size = size.tiny)
    long_position := false
    strategy.exit("Exit","Buy",stop = close)

var bool short_position = false
var bool short_exit = false
if sellSignal and not short_position
    // label.new(bar_index, na, yloc = yloc.abovebar, style = label.style_label_down, color = color.red, size = size.small)
    short_position := true
    strategy.entry("Sell",strategy.short)

short_exit := (close > supertrend_5m)
if short_position and short_exit
    // label.new(bar_index, na, yloc = yloc.belowbar, style = label.style_xcross, color = color.red, size = size.tiny)
    short_position := false
    strategy.exit("Exit","Sell", stop = close)

if out_trading_session
    long_position := false
    strategy.exit("Exit","Buy",stop = close)
    short_position := false
    strategy.exit("Exit","Sell", stop = close)

// if long_position
//     long_entry_price := close[1] + 50//bar_index

// if short_position
//     short_entry_price := close[1] - 50//bar_index

// if (long_position and high[1] > long_entry_price)
//     label.new(bar_index, na, yloc = yloc.abovebar, style = label.style_triangledown, color = color.yellow, size = size.tiny)

// if (short_position and low[1] < short_entry_price)
//     label.new(bar_index, na, yloc = yloc.belowbar, style = label.style_triangleup, color = color.yellow, size = size.tiny)