Chiến lược theo dõi xu hướng đa chỉ báo

Tổng quan
Chiến lược này kết hợp 3 chỉ số nguồn mở để xác định xu hướng theo nhiều thời gian và thiết lập điểm dừng lỗ để khóa lợi nhuận. Cụ thể, chiến lược sử dụng chỉ số AK MACD BB để xác định hướng xu hướng ngắn hạn, chỉ số SSL để lọc một số tín hiệu giả, và cuối cùng kết hợp với chỉ số giao dịch tổng hợp VSF để xác định sức mạnh mua và bán thực sự, do đó xác định thời gian. Đồng thời, chiến lược đặt trước điểm dừng lỗ để khóa lợi nhuận có thể làm giảm đáng kể rủi ro mất mát của một giao dịch.
Nguyên tắc chiến lược
-
Chỉ số AK MACD BB
Chỉ số này được áp dụng cho các chỉ số MACD của Brin, tạo ra tín hiệu mua khi đường chỉ số MACD phá vỡ và đưa Brin lên đường và bán khi đi xuống đường.
-
Chỉ số SSL
Chỉ số SSL đánh giá xem giá có vượt qua đường trung bình hay không và phát hiện tín hiệu kiểm tra lại. Giá vượt qua đường trung bình và chỉ số SSL là màu xanh là xu hướng tăng, giá vượt qua đường trung bình và chỉ số SSL là màu đỏ là xu hướng giảm, phát ra tín hiệu giao dịch.
-
Chỉ số VSF
Chỉ số VSF đánh giá sức mạnh của cả hai bên. Chiến lược chỉ phát tín hiệu khi sức mạnh của người mua hoặc người bán lớn hơn 50%, để tránh phá vỡ không hiệu quả.
-
Ngăn chặn
Chiến lược này bao gồm 4 giai đoạn thu lợi nhuận tiến bộ, từ 1,5 đến 3 lần lợi nhuận. Đồng thời thiết lập 2% dừng cố định, kiểm soát hiệu quả mức thua lỗ tối đa cho một giao dịch.
Phân tích lợi thế
-
Kết hợp nhiều chỉ số, đánh giá chính xác
Các chỉ số khác nhau để đánh giá xu hướng đa thời gian có thể lọc các tín hiệu giả và đánh giá chính xác hơn.
-
Tự động dừng lỗ, kiểm soát rủi ro
Cài đặt dừng lỗ tích hợp trong chiến lược, có thể kiểm soát lỗ trên một giao dịch khoảng 2% để tránh thua lỗ lớn.
-
Dữ liệu phản hồi rất tốt
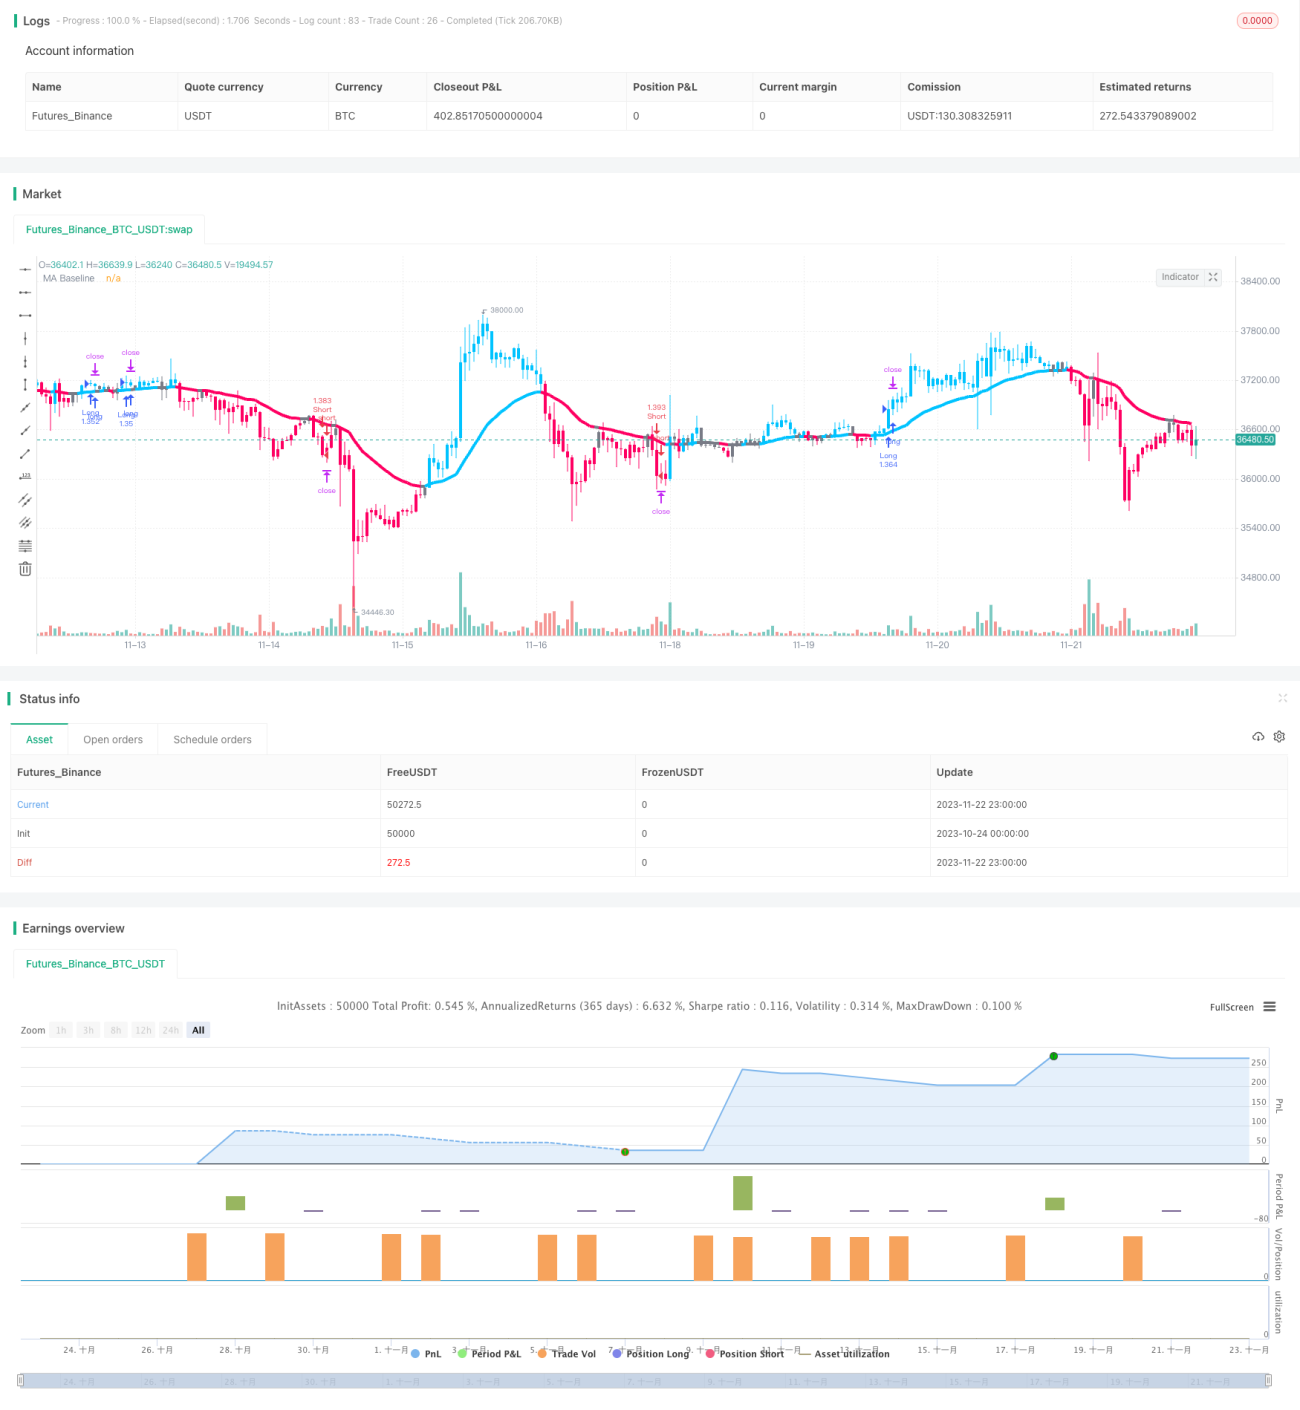
Theo đánh giá của nhà phát hành, trong 100 giao dịch, giao dịch có lợi nhuận đạt 74% và 427% tổng lợi nhuận.
Phân tích rủi ro và đối phó
-
Rủi ro biến động mạnh của thị trường
Trong các biến động lớn, có thể xảy ra nhiều lỗ nhỏ. Tại thời điểm này, có thể điều chỉnh mức dừng cố định hoặc tạm dừng giao dịch.
-
Rủi ro bị hạn chế
Chiến lược hiện tại có thể làm nhiều hơn có thể làm rỗng. Nếu giới hạn chỉ làm nhiều hoặc chỉ làm rỗng, cơ hội không kiếm được lợi nhuận sẽ giảm một nửa.
-
Rủi ro khi giao dịch
Chiến lược sử dụng dữ liệu 5 phút để đánh giá, nếu chỉ có một vài giờ dữ liệu trong một ngày giao dịch, thì số lượng mẫu là không đủ và tín hiệu có thể không đáng tin cậy.
Hướng tối ưu hóa chiến lược
-
Tối ưu hóa các tham số dừng lỗ
Bạn có thể thử nghiệm các mức dừng lỗ khác nhau để tìm các tham số tối ưu. Nếu dừng lỗ quá nhỏ, bạn không thể kiểm soát rủi ro một cách hiệu quả. Nếu dừng lỗ quá lớn, bạn có thể bỏ lỡ nhiều tiền hơn.
-
Thêm tự động điều chỉnh vị trí
Bạn có thể thiết lập Tracking Stop hoặc Move Stop để khóa lợi nhuận. Hoặc đặt cược theo điều kiện cụ thể để kiếm được nhiều lợi nhuận hơn.
-
Kết hợp với các chỉ số khác
Có thể thử nghiệm các kết hợp của các chỉ số khác nhau để xác định xem kết hợp nào hiệu quả nhất. Bạn cũng có thể thêm nhiều chỉ số để kiểm tra chéo.
-
Tối ưu hóa tham số
Bạn có thể kiểm tra lại thông qua các tham số khác nhau để tìm ra hướng tối ưu hóa tham số. Trong chiến lược này, thay đổi tham số Brin hoặc tham số đường trung bình có thể mang lại kết quả tốt hơn.
Tóm tắt
Chiến lược này tích hợp một số chỉ số để xác định hướng xu hướng, thiết lập dừng lỗ tự động, có thể kiếm lợi nhuận trong xu hướng mạnh và kiểm soát tổn thất giao dịch đơn lẻ trong phạm vi rất nhỏ. Từ dữ liệu phản hồi của nhà phát hành, tỷ lệ lợi nhuận và lợi nhuận của nó là rất lý tưởng. Với một số tối ưu hóa, có khả năng nâng cao hơn nữa sự ổn định và lợi nhuận của chiến lược.
// This source code is subject to the terms of the Mozilla Public License 2.0 at https://mozilla.org/MPL/2.0/
// © myn

//@version=5
strategy('Strategy Myth-Busting #7 - MACDBB+SSL+VSF - [MYN]', max_bars_back=5000, overlay=true, pyramiding=0, initial_capital=1000, currency='USD', default_qty_type=strategy.percent_of_equity, default_qty_value=1.0, commission_value=0.075, use_bar_magnifier = false)


/////////////////////////////////////
//* Put your strategy logic below *//

/////////////////////////////////////
//nwVqTuPe6yo- 1