Chiến lược siêu xu hướng dựa trên ATR và lệnh dừng lỗ

Tổng quan
Chiến lược này thiết kế một đường dừng di chuyển và đường quay ngược dựa trên chỉ số biến động trung bình thực tế ((ATR)). Nó sẽ theo dõi sự thay đổi của giá để điều chỉnh đường dừng trailing stop loss. Cụ thể, nếu giá thay đổi hơn 1%, đường dừng sẽ di chuyển theo hướng lợi nhuận một tỷ lệ cố định.
Nguyên tắc chiến lược
Chiến lược này sử dụng chỉ số ATR để tính toán đường dừng lỗ. Công thức cụ thể như sau:
pine
atr = multplierFactor * atr(barsBack)
longStop = hl2 - atr
shortStop = hl2 + atr
Trong đó, MultiplierFactor là hệ số tăng ATR và barsBack là số chu kỳ ATR.
LongStop và shortStop được tính dựa trên giá trị ATR.
Ngoài ra, chiến lược này cũng giới thiệu một biến direction để xác định xu hướng:
            mylang

            direction = 1
direction := nz(direction[1], direction)
direction := direction == -1 and close > shortStopPrev ? 1 : direction == 1 and close < longStopPrev ? -1 : direction
Nếu hướng là 1 thì ở xu hướng đa đầu, nếu hướng là -1 thì ở xu hướng trần.
Dưới đây là một số hình ảnh của các đường dừng có màu sắc khác nhau:
            mylang

            if (direction == 1)
    valueToPlot := longStop
    colorToPlot := color.green
else
    valueToPlot := shortStop
    colorToPlot := color.red
Điều này cho phép bạn có thể nhìn thấy rõ ràng hướng của xu hướng hiện tại và vị trí của đường dừng lỗ.
Theo dõi hệ thống dừng lỗ
Điểm mấu chốt của chiến lược này là giới thiệu một cơ chế theo dõi dừng lỗ, có thể điều chỉnh đường dừng lỗ theo thời gian thực theo hoạt động của giá.
Lập luận cụ thể là:
            mylang

            strategyPercentege = (close - updatedEntryPrice) / updatedEntryPrice * 100.00
rideUpStopLoss = hasOpenTrade() and strategyPercentege > 1

if (rideUpStopLoss)
    stopLossPercent := stopLossPercent + strategyPercentege - 1.0
    newStopLossPrice = updatedEntryPrice + (updatedEntryPrice * stopLossPercent) / 100
    stopLossPrice := max(stopLossPrice, newStopLossPrice)
    updatedEntryPrice := stopLossPrice
Nếu giá so với giá nhập cảnh tăng hơn 1%, hãy theo dõi lên để điều chỉnh đường dừng lỗ.
Điều này sẽ giúp các doanh nghiệp có thể nắm giữ nhiều lợi nhuận hơn, đồng thời giảm thiểu tổn thất.
Phân tích lợi thế
Điểm mạnh nhất của chiến lược này so với chiến lược dừng lỗ di động truyền thống là có thể điều chỉnh đường dừng lỗ theo tình hình thị trường. Các ưu điểm cụ thể như sau:
-
Có thể khóa lợi nhuận cao hơn trong tình huống xu hướng
Cơ chế theo dõi dừng lỗ cho phép đường dừng lỗ liên tục di chuyển về hướng lợi nhuận, do đó, bạn có thể khóa lợi nhuận cao hơn khi thị trường tiếp tục tăng mạnh.
-
Có thể giảm lỗ hổng tháo gỡ
Đường dừng động cố định có thể dễ dàng bị bỏ qua khi xu hướng thị trường thay đổi. Tuy nhiên, đường dừng của chiến lược này dựa trên tính toán biến động của thị trường, có thể theo dõi hợp lý sự thay đổi giá và tránh bị bỏ qua khi thu hồi.
-
Hoạt động đơn giản, dễ dàng tự động hóa
Chiến lược này hoàn toàn dựa trên hoạt động chỉ số, không có logic phán đoán xu hướng phức tạp. Có thể thực hiện giao dịch tự động rất đơn giản.
-
Các tham số có thể tùy chỉnh, áp dụng cho các giống khác nhau
Các tham số như chu kỳ ATR, hệ số tăng cường và độ dừng có thể được tùy chỉnh, có thể được tối ưu hóa cho các tham số khác nhau, làm cho chiến lược có tính phổ biến hơn.
Phân tích rủi ro
Mặc dù chiến lược này có nhiều ưu điểm, nhưng cần lưu ý những rủi ro sau:
-
Không thể xác định được điểm thay đổi của xu hướng, có nguy cơ theo đuổi cao và giảm
Chiến lược này không phân định xu hướng có kết thúc hay không.
-
Thiết lập tham số không đúng có thể làm tăng tổn thất
Nếu tham số chu kỳ ATR được đặt quá ngắn, đường dừng sẽ trở nên quá nhạy cảm và có thể được kích hoạt thường xuyên bởi hành vi chấn động.
-
Có nguy cơ bị ảnh hưởng bởi sự phản hồi của bản sao.
Chiến lược này không xem xét điểm phân loại là điểm hỗ trợ dừng lỗ. Do đó, khi đường ngắn hồi phục, nó có thể bị ném ra khỏi thị trường.
Đối với các rủi ro trên, có thể tối ưu hóa theo các khía cạnh sau:
-
Kết hợp với các chỉ số xu hướng, dự đoán xu hướng đảo ngược
-
Thử nghiệm tối ưu hóa tham số, chọn kết hợp tham số tối ưu nhất
-
Giới rộng phạm vi dừng lỗ gần một mức hỗ trợ nhất định
Hướng tối ưu hóa
Chiến lược này có thể được tối ưu hóa hơn nữa:
-
Xác định hình dạng kết hợp với đường K
Có thể xác định khả năng đảo ngược xu hướng bằng cách nhận ra một số hình dạng K điển hình, chẳng hạn như đùi, sao bắn, v.v.
-
Tối ưu hóa tham số theo dõi động
Các tham số khác như chu kỳ ATR, hệ số tăng cường cũng có thể thay đổi động, sử dụng chu kỳ ATR dài hơn và phạm vi lỗ hổng rộng hơn trong thị trường biến động lớn.
-
Kết hợp với mô hình học máy
Sử dụng mô hình học sâu như lstm, rnn để dự đoán phạm vi giá có thể xảy ra sau thị trường, động điều chỉnh khoảng cách dừng lỗ.
Tóm tắt
Chiến lược này sử dụng chỉ số ATR để thiết kế đường dừng di động và giới thiệu cơ chế theo dõi dừng lỗ, có thể điều chỉnh vị trí dừng lỗ theo thời gian thực theo thay đổi của thị trường. Điều này tạo ra khóa lợi nhuận cao hơn, đồng thời cũng làm giảm rủi ro. Bằng cách tối ưu hóa thêm, chiến lược có thể thích nghi hơn với các tình huống thị trường khác nhau, trở thành một chiến lược giao dịch linh hoạt.
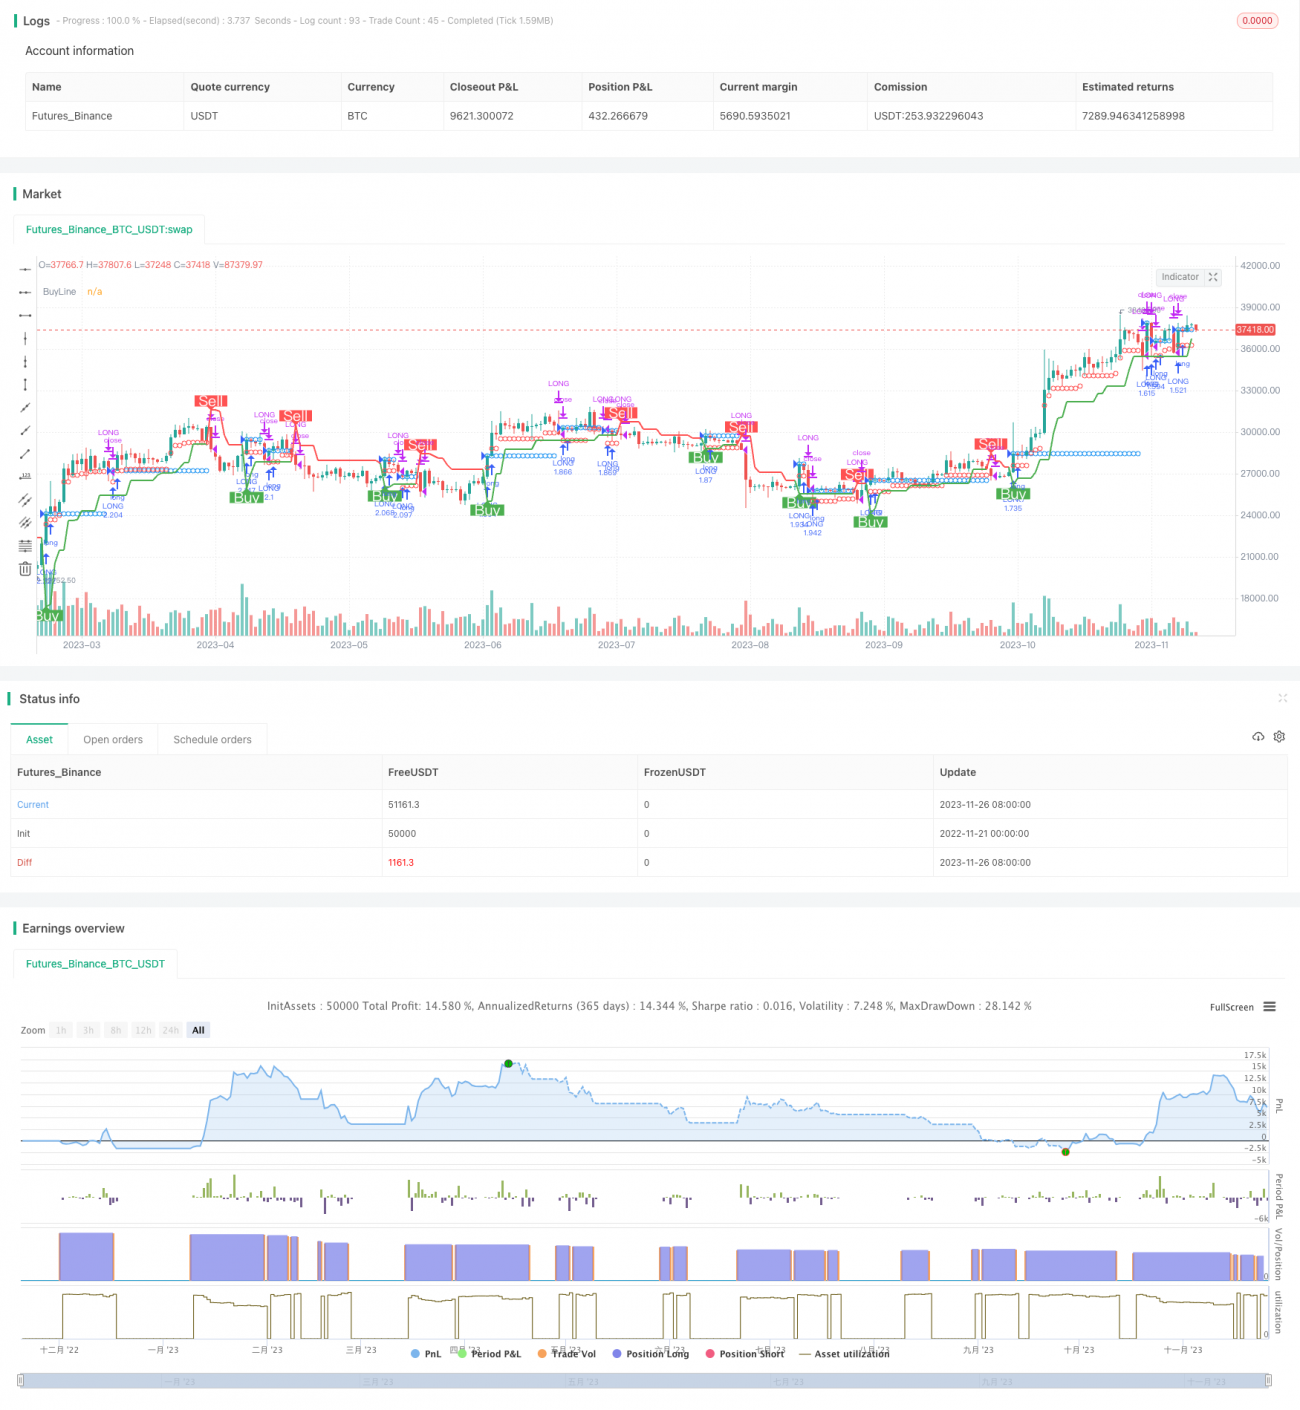
/*backtest
start: 2022-11-21 00:00:00
end: 2023-11-27 00:00:00
period: 1d
basePeriod: 1h
exchanges: [{"eid":"Futures_Binance","currency":"BTC_USDT"}]
*/

//@version=4
//
// ▒▒▒▒▒▒▒▒▒▒▒▒▒▒▒▒▒▒▒▒▒▒▒▒▒▒▒▒▒▒▒▒▒▒▒▒▒▒▒▒▒▒▒▒▒▒▒▒▒▒▒▒▒▒▒▒▒▒▒▒▒▒▒▒▒▒▒▒▒▒▒▒▒▒▒▒▒▒▒▒▒▒▒▒▒▒▒▒▒▒▒▒▒▒▒▒▒▒▒▒▒▒▒▒▒▒▒▒▒▒▒▒▒▒
// ------------------------------------------------------------------------------ 1