Chiến lược theo dõi động lượng thích ứng đa yếu tố

Tổng quan
Chiến lược theo dõi động lực tự điều chỉnh đa yếu tố thông qua việc tích hợp nhiều chỉ số kỹ thuật để xác định xu hướng thị trường và mức kháng cự hỗ trợ quan trọng, để thực hiện giao dịch tự động đối với các tài sản có biến động cao như tiền điện tử. Chiến lược này sử dụng các chỉ số như RSI, MACD, Stochastic để đánh giá thời gian mua và bán, đồng thời kết hợp với tỷ lệ biến đổi giá để xác định hình thái chính xác hơn.
Nguyên tắc chiến lược
Cốt lõi của chiến lược theo dõi động lượng tự điều chỉnh đa yếu tố là sử dụng tích hợp nhiều chỉ số kỹ thuật. Chiến lược này chủ yếu sử dụng một số thành phần sau:
-
Chỉ số RSI đánh giá quá mua quá bán. Kết hợp các tham số khác nhau có thể nhận ra tín hiệu RSI thông thường hoặc tín hiệu RSI cải tiến của Conner để đánh giá xem có cơ hội đảo ngược hay không.
-
Chỉ số MACD giúp xác định hướng xu hướng. Khi MACD đi trên hoặc xuống đường tín hiệu, nó tạo ra tín hiệu mua và bán.
-
Chỉ số Stochastic xác định vùng mua quá mức. K và D đánh giá liệu tín hiệu kết hợp vàng và vàng có bị đảo ngược hay không.
-
Tỷ lệ phần trăm thay đổi giá kiểm tra xem phá vỡ có thực hay không. Tính toán tỷ lệ phần trăm thay đổi giá cao nhất, giá thấp nhất, giá đóng cửa trong một chu kỳ nhất định để xác định xem phá vỡ có thực hay không.
-
Chỉ số EMA đánh giá mức độ chênh lệch lớn. Đường nhanh là tín hiệu lạc quan, đường chậm là tín hiệu giảm.
Chiến lược này tùy thuộc vào tình trạng thị trường dư thừa, chọn nhiều thời gian để thực hiện giao dịch, và thiết lập dừng lỗ sau khi vào vị trí, kiểm soát rủi ro hiệu quả. Khi có tín hiệu đảo ngược, chọn rời khỏi vị trí bằng phẳng. Toàn bộ quá trình ra quyết định kết hợp đầy đủ nhiều yếu tố phán đoán, do đó có thể đưa ra quyết định chính xác hơn.
Phân tích lợi thế
Chiến lược này có một số ưu điểm:
-
Động cơ đa yếu tố có lợi thế về phán đoán. So với chỉ số đơn lẻ, kết hợp nhiều chỉ số có thể xác minh lẫn nhau, làm cho kết quả chính xác và đáng tin cậy hơn, do đó tiết kiệm chi phí giao dịch không cần thiết.
-
Điều kiện nghiêm ngặt để tránh giao dịch sai. Chiến lược đặt ra các yêu cầu nghiêm ngặt về điều kiện mua và bán, cần nhiều chỉ số phát ra tín hiệu cùng một lúc, do đó có thể lọc ra nhiều tiếng ồn và tránh giao dịch sai.
-
Tự thích nghi với siêu tham số làm giảm sự can thiệp của con người. Khả năng tính toán động các tham số chỉ số trong chiến lược, tránh chủ quan của việc chọn siêu tham số bằng tay, do đó làm cho các tham số của chiến lược trở nên khách quan hơn.
-
Kiểm soát rủi ro của cơ chế dừng lỗ. Chiến lược sẽ tính toán và vẽ vị trí dừng lỗ ngay sau khi mở vị trí, có thể kiểm soát hiệu quả tổn thất đơn lẻ và tránh sự bùng nổ vị trí.
Phân tích rủi ro
Chiến lược này cũng có một số rủi ro cần được đề phòng:
-
Tỷ lệ tín hiệu phát hành sai của chỉ số. Mặc dù xác minh đa chỉ số có thể làm giảm đáng kể tỷ lệ tín hiệu sai, nhưng vẫn có khả năng xảy ra. Điều này có thể dẫn đến tổn thất không cần thiết.
-
Rủi ro bị phá vỡ. Trong trường hợp cực đoan, giá có thể giảm xuống dốc, dẫn đến việc phá vỡ mức dừng ban đầu dễ dàng, gây ra tổn thất lớn hơn.
-
Tối ưu hóa tham số dẫn đến quá tối ưu hóa. Mặc dù tham số động tránh được tính chủ quan do lựa chọn nhân tạo, nhưng nó cũng có thể dẫn đến quá tối ưu hóa tham số và mất khả năng tổng quát.
Giải pháp tương ứng:
- Tăng mức độ nghiêm ngặt của các điều kiện lọc tín hiệu, giảm tỷ lệ tín hiệu sai.
- Việc xây dựng kho dự trữ theo từng đợt sẽ giúp tránh tổn thất quá lớn trong một lần.
- Tăng số lượng mẫu thử nghiệm, đánh giá nghiêm ngặt tính ổn định của tham số.
Hướng tối ưu hóa chiến lược
Các chiến lược theo dõi động lượng tự điều chỉnh đa yếu tố có một số chiều tối ưu hóa sau:
-
Tăng số lượng các yếu tố phán đoán. Kết hợp với nhiều loại khác nhau của các tín hiệu chỉ số phán đoán, như tỷ lệ biến động, khối lượng giao dịch và các phán đoán phụ trợ.
-
Tối ưu hóa các thuật toán của cơ chế dừng lỗ. Các thuật toán dừng lỗ tiên tiến hơn có thể được giới thiệu, chẳng hạn như dừng chân theo dõi, dừng rung, để giảm thêm khả năng phá vỡ.
-
Giới thiệu mô hình học máy. Sử dụng các mô hình như RNN, LSTM để mô hình hóa dữ liệu lịch sử để hỗ trợ quyết định mua và bán.
-
Tích hợp chiến lược. Sử dụng nhiều chiến lược con và sử dụng phương pháp học tập tích hợp để tích hợp, có thể đạt được hiệu suất tổng hợp ổn định hơn.
Tóm tắt
Chiến lược theo dõi động lực tự điều chỉnh đa yếu tố tích hợp sử dụng nhiều chỉ số kỹ thuật để xác định thời gian mua và bán. Quyết định của chiến lược chính xác hơn so với chỉ số đơn lẻ, trong khi các tham số tự điều chỉnh và kiểm soát rủi ro của cơ chế dừng. Bước tiếp theo là tăng cường hiệu quả của chiến lược bằng cách giới thiệu nhiều yếu tố quyết định hỗ trợ, thuật toán dừng tiên tiến và các phương pháp học máy.
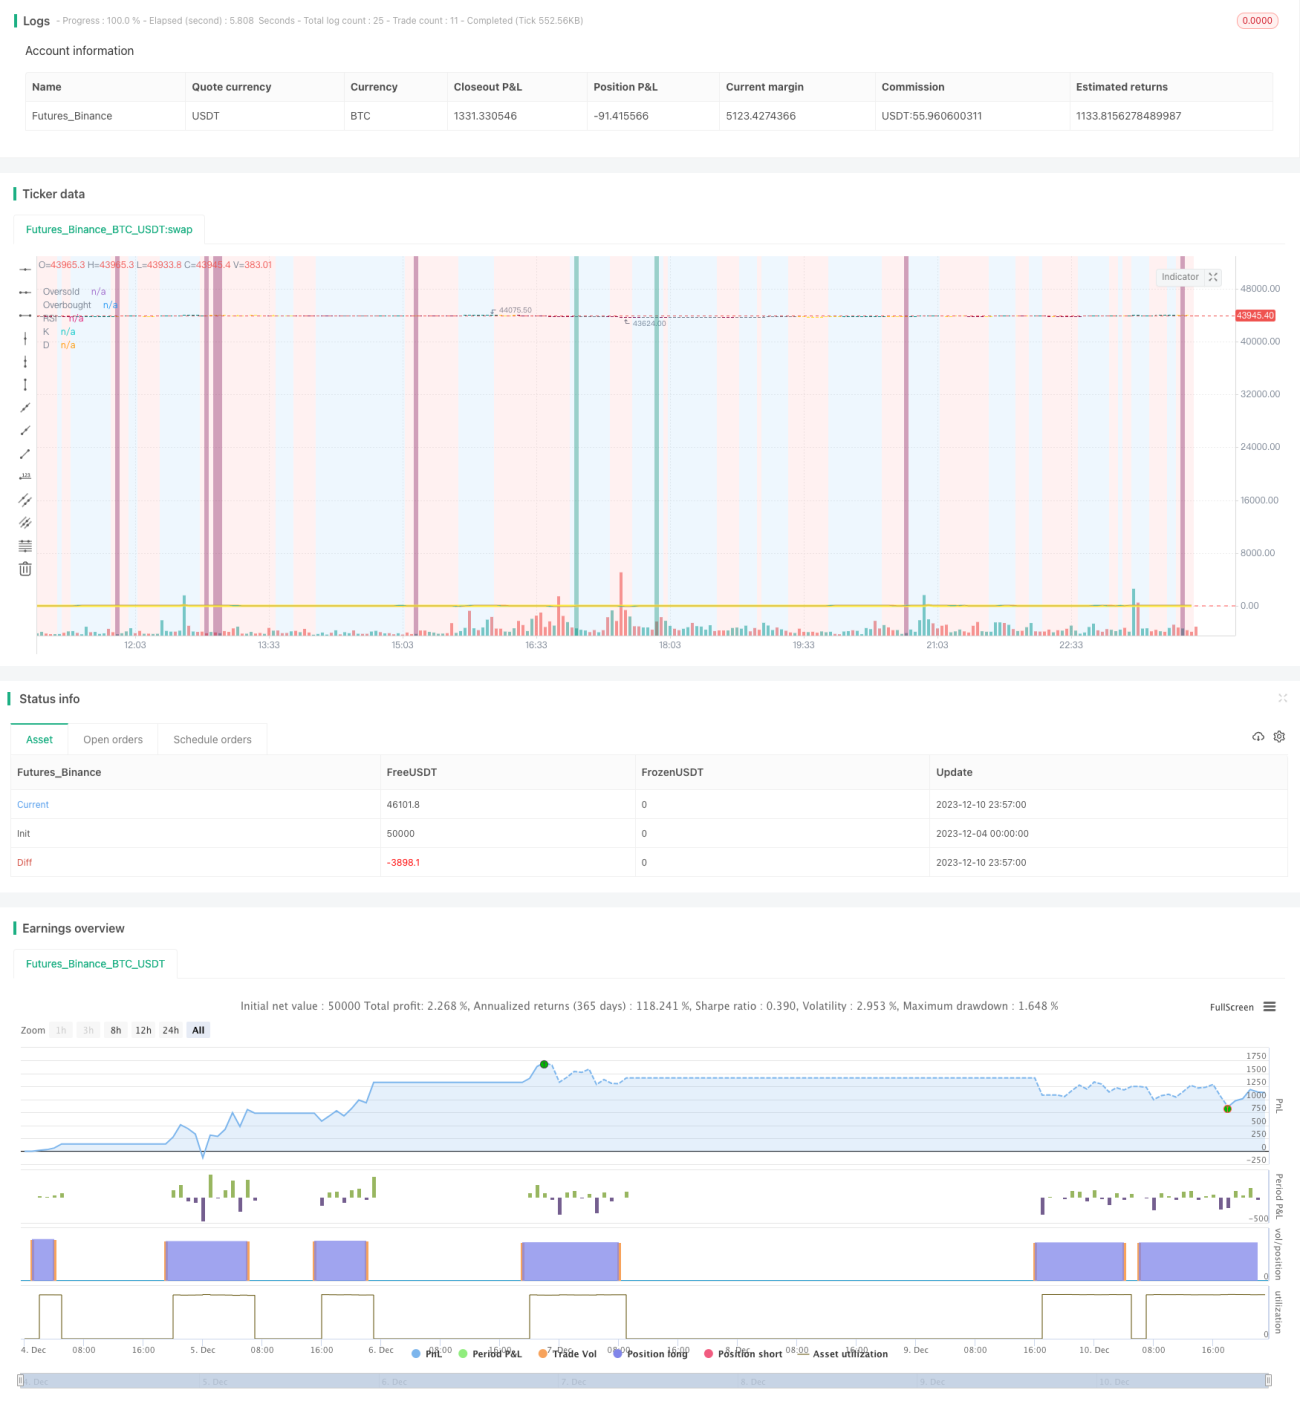
/*backtest
start: 2023-12-04 00:00:00
end: 2023-12-11 00:00:00
period: 3m
basePeriod: 1m
exchanges: [{"eid":"Futures_Binance","currency":"BTC_USDT"}]
*/

// This source code is subject to the terms of the Mozilla Public License 2.0 at https://mozilla.org/MPL/2.0/
//@version=4

// ██████╗██████╗ ███████╗ █████╗ ████████╗███████╗██████╗ ██████╗ ██╗ ██╗ - 1