Chiến lược giao dịch theo xu hướng kép Âm-Dương dựa trên RSI và khối lượng giao dịch
Tổng quan
Chiến lược này là một chiến lược sử dụng chỉ số RSI và khối lượng giao dịch để xác định xu hướng và theo dõi xu hướng. Điểm quan trọng là:
- Trục trung tâm được tính toán bằng đường trung bình chuyển động có trọng số, kết hợp với thông tin khối lượng giao dịch để đánh giá xu hướng
- Xác định vùng mua, bán dựa trên trục trung tâm
- Sử dụng thông tin RSI để điều chỉnh vùng mua và vùng bán
- Cài đặt đường dừng lỗ và đường dừng chân sau khi vào khu mua sắm
- Có cơ chế tái nhập học
Nguyên tắc chiến lược
Chính sách này sử dụng các chỉ số và tham số sau:
- Đường trục trung tâm: tính toán trung bình di chuyển có trọng số của giá cao nhất và giá thấp nhất trong một chu kỳ nhất định, sử dụng khối lượng giao dịch làm trọng lượng để đánh giá hướng trung tâm của xu hướng
- RSI: tính chỉ số cường độ tương đối trong một chu kỳ nhất định, chuyển đổi nó thành một số trong khoảng 0-1
- Khu vực mua: Trục trung tâm cộng với tỷ lệ điều chỉnh RSI, bạn có thể làm nhiều hơn sau khi vào khu vực mua
- Khu vực bán ra: Trục trung tâm trừ một tỷ lệ điều chỉnh RSI, có thể được làm trống khi vào khu vực bán ra
- Trục dừng: Trục trung tâm
- Đường dừng lỗ: đặt tỷ lệ phần trăm nhất định ở dưới khu vực mua / trên khu vực bán
Khi giá vào vùng mua hoặc bán, thực hiện các hoạt động mở vị trí theo hướng tương ứng. Sau đó, thiết lập vị trí dừng và dừng lỗ, thanh toán khi kích hoạt dừng hoặc dừng lỗ. Đồng thời, thiết lập cơ chế nhập lại, nếu cấu hình cho phép, có thể nhập lại khi kích hoạt tín hiệu mở vị trí một lần nữa.
Lợi thế chiến lược
Chiến lược này có những ưu điểm sau:
- Sử dụng RSI và khối lượng giao dịch để xác định xu hướng, cải thiện tính chính xác của phán đoán
- RSI tham số hóa các vùng mua và bán để phù hợp hơn với xu hướng thực tế
- Thông tin về khối lượng giao dịch cho sự thay đổi giá có trọng lượng cao hơn, làm cho trục trung tâm chính xác hơn
- Có cơ chế dừng lỗ để kiểm soát rủi ro
- Có thể tái nhập học, giảm nguy cơ đột nhập giả
Phân tích rủi ro
Chiến lược này cũng có một số rủi ro:
- Các tham số RSI và khối lượng giao dịch được thiết lập không chính xác có thể ảnh hưởng đến độ chính xác của việc xác định phạm vi khu vực mua và bán
- Trục trung tâm không thể đánh giá xu hướng một cách chính xác, có thể xảy ra sự phá vỡ sai
- Cài đặt điểm dừng quá rộng có thể gây ra tổn thất cao hơn
- Cơ chế tái nhập cảnh có thể dẫn đến giao dịch quá mức
Các biện pháp tối ưu hóa:
- Điều chỉnh các tham số RSI chu kỳ, khối lượng giao dịch chu kỳ để phù hợp hơn với thị trường
- Kết hợp với các chỉ số khác để xác nhận tín hiệu mua và bán, tránh phá vỡ sai
- Cắt chặt điểm dừng để kiểm soát tổn thất đơn
- Hạn chế giao dịch hàng ngày và tránh giao dịch quá mức
Hướng tối ưu hóa chiến lược
Chính sách này có thể được tối ưu hóa bằng cách:
- Thử các chỉ số khác để xác nhận tín hiệu mua bán, chẳng hạn như hình dạng K-line, chỉ số biến động.
- Tăng cơ chế quản lý vị trí, chẳng hạn như tăng vị trí sau khi kiếm được lợi nhuận
- Tăng độ chính xác của thuật toán học máy trong việc đánh giá xu hướng và tăng độ chính xác của cài đặt khu vực mua và bán
- Đánh giá các tham số tối ưu của thiết lập điểm dừng lỗ
- Các phân loại khác nhau có các tham số khác nhau, cần kiểm tra riêng và tối ưu hóa
Tóm tắt
Chiến lược này nói chung là một chiến lược định lượng sử dụng RSI và chỉ số khối lượng giao dịch để theo dõi xu hướng. Nó có cơ chế xác minh kép để nhận ra tín hiệu xu hướng và đặt lệnh dừng để kiểm soát rủi ro và cơ chế nhập lại để tăng cơ hội kiếm lợi nhuận. Bằng cách điều chỉnh tham số và tối ưu hóa thuật toán, chiến lược này có thể trở thành một chiến lược giao dịch theo dõi xu hướng rất thực tế.
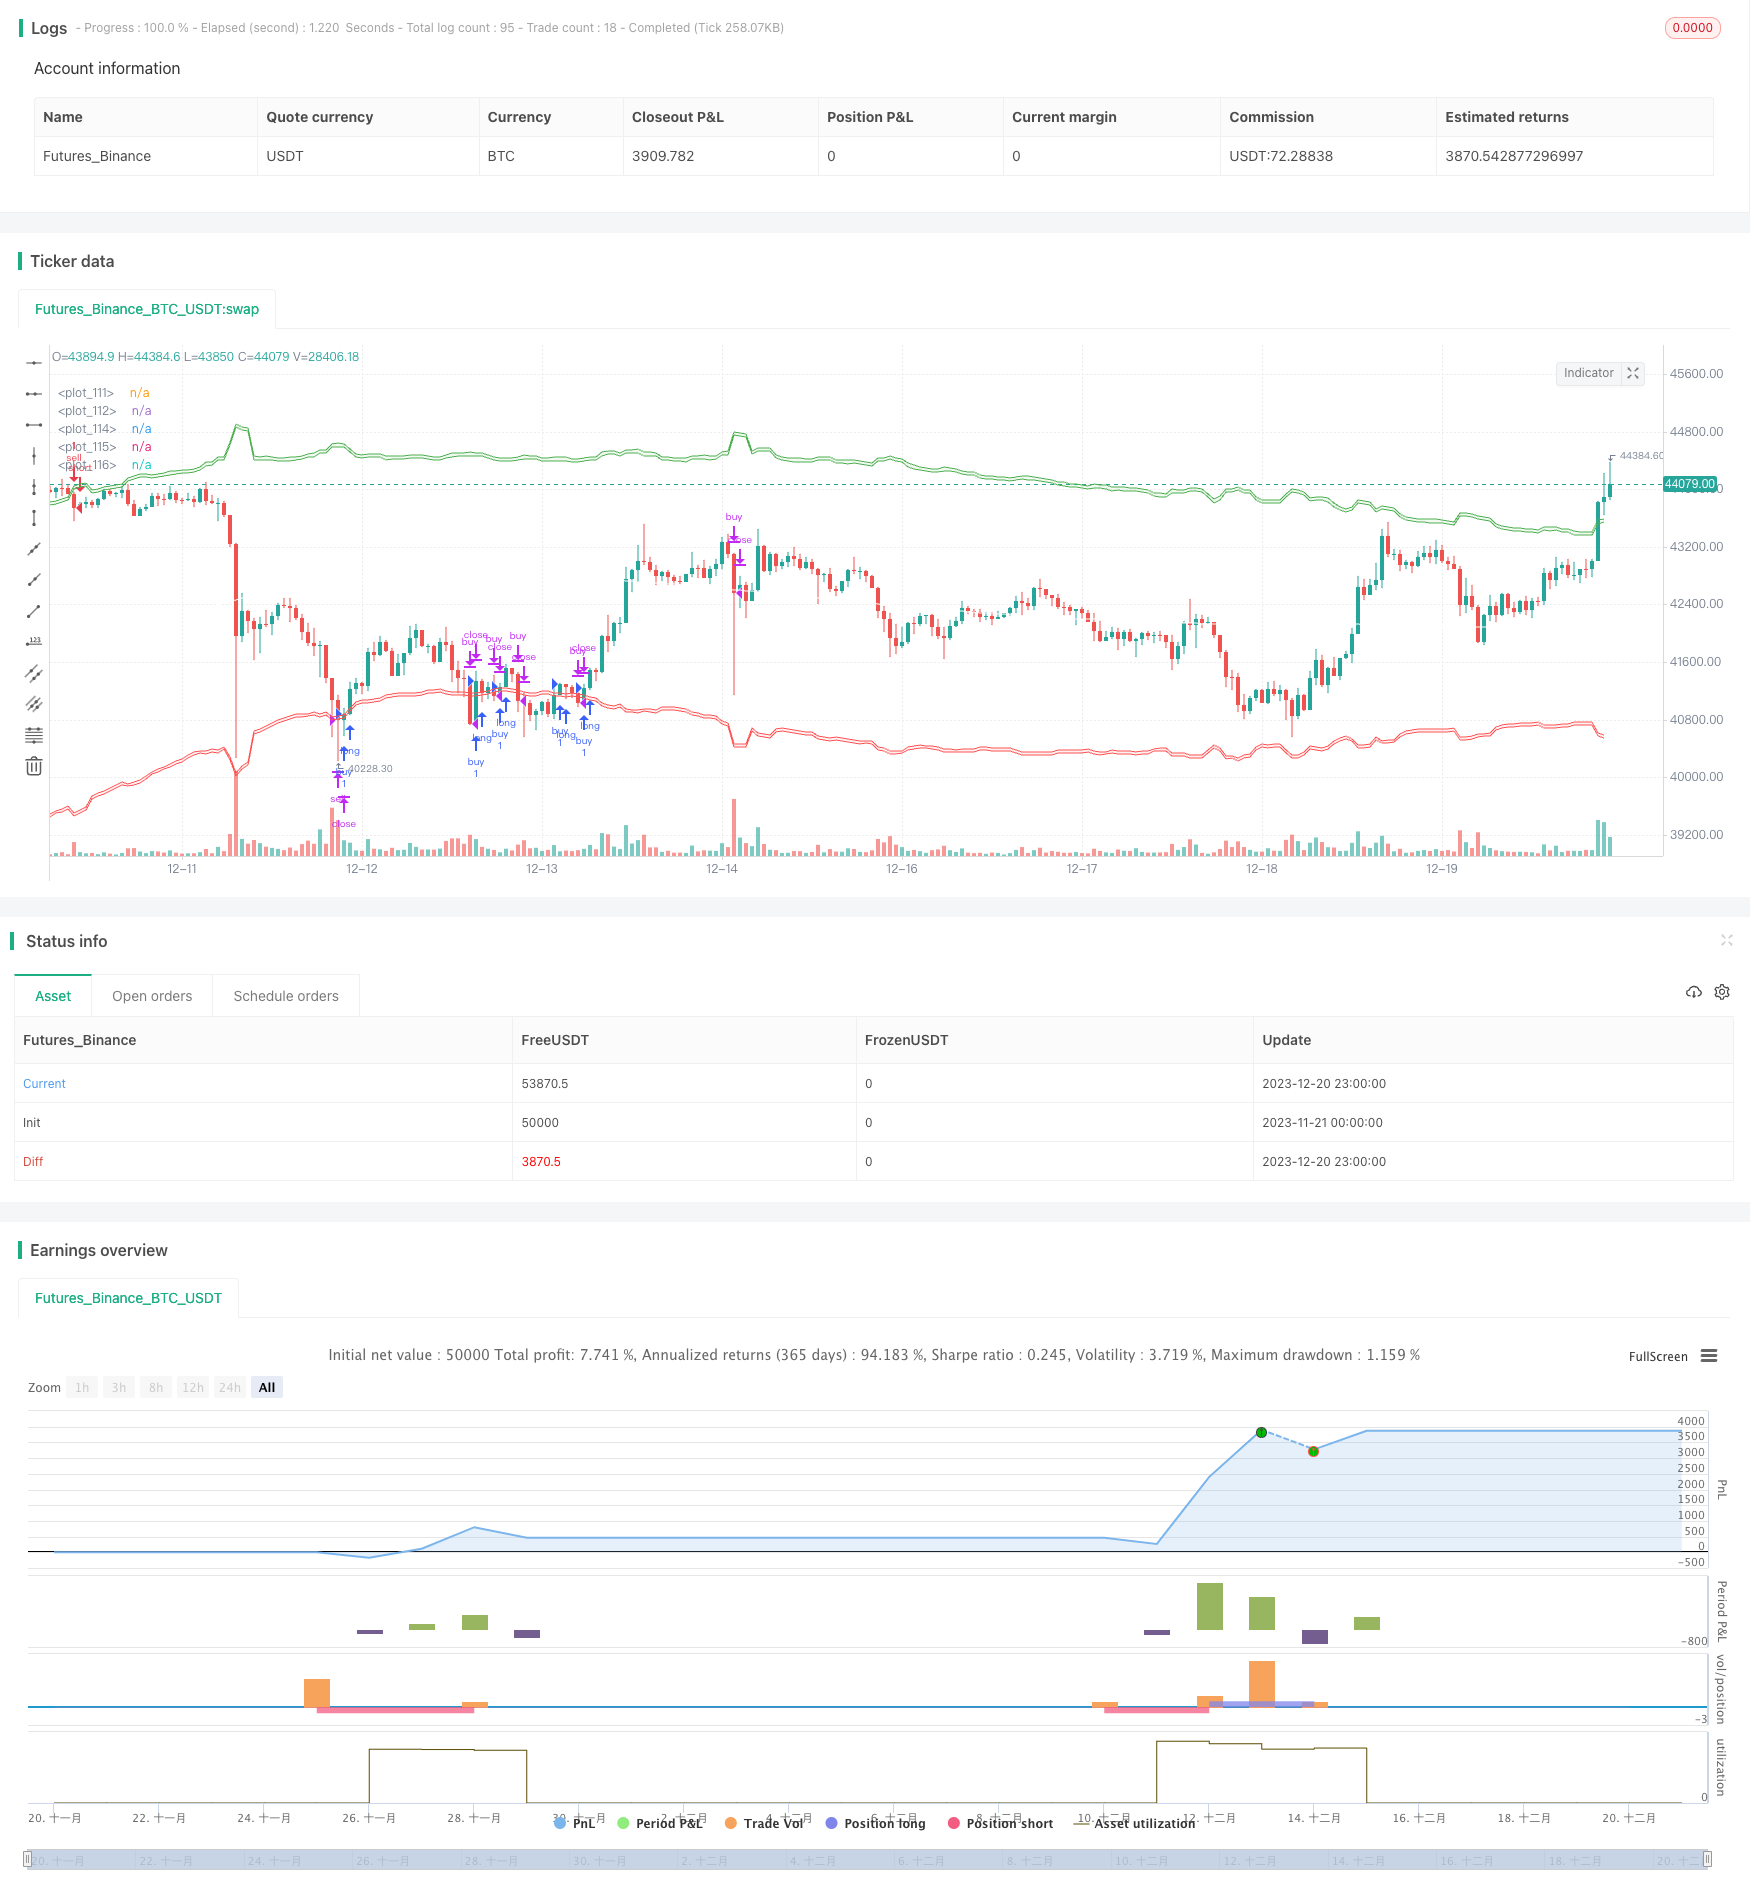
/*backtest
start: 2023-11-21 00:00:00
end: 2023-12-21 00:00:00
period: 1h
basePeriod: 15m
exchanges: [{"eid":"Futures_Binance","currency":"BTC_USDT"}]
*/

// This source code is subject to the terms of the Mozilla Public License 2.0 at https://mozilla.org/MPL/2.0/
// @@@@@@@@@@@@@@@@@@@@@@@@@@@@@@@@@@@@@@@@@@@@@@@@@@@@@@@@@@@@@@@@@@@@@@@@@@@@@@@@
// @@@@@@@@@@@@@@@@@@@@@@@@@@@@@@@@@@@@@@@@@@@@@@@@ @@@@@@@@@@@@@@@@@@@@@@@@@@@@@@@
// @@@@@@@@@@@@@@@@@@@@@@@@@@@@@@@@@@@@@@@@@@@@@@@@@@@@    ,@@@@@@@@@@@@@@@@@@@@@@@
// @@@@@@@@@@@@@@@@@@@@@@@@@@@@@@@@@@@@@@@@@@@@@@@@@@@@@@@      @@@@@@@@@@@@@@@@@@@
// @@@@@@@@@@@@@@@@@@@@@@@@@@@@@@@@@@@@@@@@@@@@@@@@@@@@@@@@@        @@@@@@@@@@@@@@@
// @@@@@@@@@@@@@@@@@@@@@@@@@@@@@@@@@@@@@@@@@@@@@@@@@@@@@@@@@@         @@@@@@@@@@@@@
// @@@@@@@@@@@@@@@@@@@@@@@@@@@@@@@@@@@@@@@@@@@@@@@@@@@@@@@@@@@           @@@@@@@@@@
// @@@@@@@@@@@@@@@@@@@@@@@@@@@@@@@@@@@@        .@@@@@@@@@@@@@@@            @@@@@@@@
// @@@@@@@@@@@@@@@@@@@@@@@@@@@@@@@@@@@          *@@@@@@@@@@@@@@             @@@@@@@
// @@@@@@@@@@@@@@@@@@@@@@@@@@@@@@@@@@@@         @@@@@@@@@@@@@@@               @@@@@
// @@@@@@@@@@@@@@@@@@@@@@@@@@@@@@@@@@@@@@     @@@@@@@@@@@@@@@@                 @@@@
// @@@@@@@@@@@@@@@@@@@@@@@@@@@@@@@@@@@@@@@@@@@@@@@@@@@@@@@@@@@                  @@@
// @@@@@@@@@@@@@@@@@@@@@@@@@@@@@@@@@@@@@@@@@@@@@@@@@@@@@@@@@.                    @@
// @@@@@@@@@@@@@@@@@@@@@@@@@@@@@@@@@@@@@@@@@@@@@@@@@@@@@@@@                      @@
// @@@@@@@@@@@@@@@@@@@@@@@@@@@@@@@@@@@@@@@@@@@@@@@@@@@@@.                         @
// @@@@@@@@@@@@@@@@@@@@@@@@@@@@@@@@@@@@@@@@@@@@@@@@@@                             @
// @@@@@@@@@@@@@@@@@@@@@@@@@@@@@@@@@@@@@@@,                                       @
// @@@@@@@@@@@@@@@@@@@@@@@@@@@@@@@                                                @
// @@@@@@@@@@@@@@@@@@@@@@@@@@@                                                    @
// @@@@@@@@@@@@@@@@@@@@@@@@@                                                     @@
// @@@@@@@@@@@@@@@@@@@@@@@                                                       @@
// @@@@@@@@@@@@@@@@@@@@@@                                                       @@@
// @@@@@@@@@@@@@@@@@@@@@*                @@@@@                                 @@@@
// @@@@@@@@@@@@@@@@@@@@@               @@@@@@@@@                              @@@@@
// @@@@@@@@@@@@@@@@@@@@@              @@@@@@@@@@@                           @@@@@@@
// @@@@@@@@@@@@@@@@@@@@@               @@@@@@@@%                           @@@@@@@@
// @@@@@@@@@@@@@@@@@@@@@@                                                @@@@@@@@@@
// @@@@@@@@@@@@@@@@@@@@@@@                                            @@@@@@@@@@@@@
// @@@@@@@@@@@@@@@@@@@@@@@@                                        %@@@@@@@@@@@@@@@
// @@@@@@@@@@@@@@@@@@@@@@@@@@                                   @@@@@@@@@@@@@@@@@@@
// @@@@@@@@@@@@@@@@@@@@@@@@@@@@@                           @@@@@@@@@@@@@@@@@@@@@@@@
// @@@@@@@@@@@@@@@@@@@@@@@@@@@@@@@@@                @@@@@@@@@@@@@@@@@@@@@@@@@@@@@@@
// © YinYangAlgorithms

//@version=5
strategy("YinYang RSI Volume Trend Strategy", shorttitle="YinYang RSVT Strategy", overlay=true )
// ~~~~~~~~~~~ INPUTS ~~~~~~~~~~~ //
len = input.int(80, "Trend Length:", tooltip="How far back should we span this indicator?\nThis length effects all lengths of the indicator")
purchaseSrc = input.source(close, "Purchase Source (Long and Short):", tooltip="What source needs to exit the purchase zone for a purchase to happen?")
exitSrc = input.source(close, "Exit Source (Long and Short):", tooltip="What source needs to hit a exit condition to stop the trade (Take profit, Stop Loss or hitting the other sides Purchase Zone)?")
useTakeProfit = input.bool(true, "Use Take Profit", tooltip="Should we take profit IF we cross the basis line and then cross it AGAIN?")
useStopLoss = input.bool(true, "Use Stop Loss", tooltip="Stop loss will ensure you don't lose too much if its a bad call")
stopLossMult = input.float(0.1, "Stoploss Multiplier %:", tooltip="How far from the purchase lines should the stop loss be")
resetCondition = input.string("Entry", "Reset Purchase Availability After:", options=["Entry", "Stop Loss", "None"],
 tooltip="If we reset after a condition is hit, this means we can purchase again when the purchase condition is met. \n" +
 "Otherwise, we will only purchase after an opposite signal has appeared.\n" +
 "Entry: means when the close enters the purchase zone (buy or sell).\n" +
 "Stop Loss: means when the close hits the stop loss location (even when were out of a trade)\n" +
 "This allows us to get more trades and also if our stop loss initally was hit but it WAS a good time to purchase, we don't lose that chance.")

// ~~~~~~~~~~~ VARIABLES ~~~~~~~~~~~ //
var bool longStart = na
var bool longAvailable = na
var bool longTakeProfitAvailable = na
var bool longStopLoss = na
var bool shortStart = na
var bool shortAvailable = na
var bool shortTakeProfitAvailable = na
var bool shortStopLoss = na

resetAfterStopLoss = resetCondition == "Stop Loss"
resetAfterEntry = resetCondition == "Entry"

// ~~~~~~~~~~~ CALCULATIONS ~~~~~~~~~~~ //
// Mid Line
midHigh = ta.vwma(ta.highest(high, len), len)
midLow = ta.vwma(ta.lowest(low, len), len)
mid = math.avg(midHigh, midLow)
midSmoothed = ta.ema(mid, len)

//Volume Filtered
avgVol = ta.vwma(volume, len)
volDiff = volume / avgVol
midVolSmoothed = ta.vwma(midSmoothed * volDiff, 3)

//RSI Filtered
midDifference = ta.sma(midHigh - midLow, len)
midRSI = ta.rsi(midVolSmoothed, len) * 0.01
midAdd = midRSI * midDifference

//Calculate Zones
purchaseZoneHigh = midSmoothed + midAdd
purchaseZoneLow = midSmoothed - midAdd
purchaseZoneBasis = math.avg(purchaseZoneHigh, purchaseZoneLow)

//Create Stop Loss Locations
stopLossHigh = purchaseZoneHigh * (1 + (stopLossMult * 0.01))
stopLossLow = purchaseZoneLow * (1 - (stopLossMult * 0.01))

// ~~~~~~~~~~~ PURCHASE CALCULATIONS ~~~~~~~~~~~ //
//Long
longEntry = ta.crossunder(purchaseSrc, purchaseZoneLow)
longStart := ta.crossover(purchaseSrc, purchaseZoneLow) and longAvailable
longAvailable := ta.crossunder(purchaseSrc, purchaseZoneHigh) or (resetAfterStopLoss and longStopLoss) or (resetAfterEntry and longEntry) ? true : longStart ? false : longAvailable[1]
longEnd = ta.crossover(exitSrc, purchaseZoneHigh)
longStopLoss := ta.crossunder(exitSrc, stopLossLow)
longTakeProfitAvailable := ta.crossover(exitSrc, purchaseZoneBasis) ? true : longEnd ? false : longTakeProfitAvailable[1]
longTakeProfit = ta.crossunder(exitSrc, purchaseZoneBasis) and longTakeProfitAvailable

//Short
shortEntry = ta.crossover(purchaseSrc, purchaseZoneHigh)
shortStart := ta.crossunder(purchaseSrc, purchaseZoneHigh) and shortAvailable
shortAvailable := ta.crossover(purchaseSrc, purchaseZoneLow) or (resetAfterStopLoss and shortStopLoss) or (resetAfterEntry and shortEntry)? true : shortStart ? false : shortAvailable[1]
shortEnd = ta.crossunder(exitSrc, purchaseZoneLow)
shortStopLoss := ta.crossover(exitSrc, stopLossHigh)
shortTakeProfitAvailable := ta.crossunder(exitSrc, purchaseZoneBasis) ? true : shortEnd ? false : shortTakeProfitAvailable[1]
shortTakeProfit = ta.crossover(exitSrc, purchaseZoneBasis) and shortTakeProfitAvailable

// ~~~~~~~~~~~ PLOTS ~~~~~~~~~~~ //
shortLine = plot(purchaseZoneHigh, color=color.green)
shortStopLossLine = plot(stopLossHigh, color=color.green) //color=color.rgb(0, 97, 3)
fill(shortLine, shortStopLossLine, color = color.new(color.green, 90))
plot(purchaseZoneBasis, color=color.white)
longLine = plot(purchaseZoneLow, color=color.red)
longStopLossLine = plot(stopLossLow, color=color.red) //color=color.rgb(105, 0, 0)
fill(longLine, longStopLossLine, color=color.new(color.red, 90))

// ~~~~~~~~~~~ STRATEGY ~~~~~~~~~~~ //
if (longStart)
    strategy.entry("buy", strategy.long)
else if (longEnd or (useStopLoss and longStopLoss) or (useTakeProfit and longTakeProfit))
    strategy.close("buy")

if (shortStart)
    strategy.entry("sell", strategy.short)
else if (shortEnd or (useStopLoss and shortStopLoss) or (useTakeProfit and shortTakeProfit))
    strategy.close("sell")

// ~~~~~~~~~~~ ALERTS ~~~~~~~~~~~ //
if longStart or (longEnd or (useStopLoss and longStopLoss) or (useTakeProfit and longTakeProfit)) or shortStart or (shortEnd or (useStopLoss and shortStopLoss) or (useTakeProfit and shortTakeProfit))
    alert("{{strategy.order.action}} | {{ticker}} | {{close}}", alert.freq_once_per_bar)