Chiến lược mở lệnh dài-ngắn dựa trên đường trung bình động khung thời gian đa dạng và MACD
Tóm tắt
Chiến lược này tận dụng đầy đủ các chỉ số MTF EMA để xác định xu hướng xu hướng và các chỉ số MACD để tạo ra tín hiệu mua và bán, đồng thời kết hợp với chỉ số ATR để thiết lập giá dừng lỗ. Chiến lược này phù hợp cho các cặp giao dịch tiền kỹ thuật số và tiền tệ pháp lý có xu hướng mạnh, hoạt động tốt trong thị trường có xu hướng mạnh.
Nguyên tắc chiến lược
MTF EMA đánh giá xu hướng
MTF EMA có thể hiển thị moving average của nhiều khoảng thời gian trên cùng một biểu đồ để đánh giá tình trạng trống tổng thể của tài sản. Chiến lược sử dụng MTF EMA của 1 chu kỳ giờ và chu kỳ 15 phút.
Khi giá cao hơn 1 giờ MTF EMA và 1 giờ MTF EMA thấp hơn 15 phút MTF EMA, được định nghĩa là xu hướng tăng; khi giá thấp hơn 1 giờ MTF EMA và 1 giờ MTF EMA cao hơn 15 phút MTF EMA, được định nghĩa là xu hướng giảm.
2. MACD tạo ra tín hiệu mua và bán
Khi đường MACD vượt qua đường Signal từ phía dưới, tạo ra tín hiệu mua; khi đi từ phía trên xuống, tạo ra tín hiệu bán. Đồng thời thiết lập giới hạn chéo của đường MACD và đường Signal để tránh tín hiệu giả.
3. Thiết lập ATR Stop Loss Stop
Sử dụng chỉ số ATR để thiết lập giá dừng lỗ. ATR có thể thiết lập khoảng cách dừng lỗ hợp lý dựa trên động lực của sự biến động của thị trường. Đồng thời, tùy thuộc vào số nhân của dừng lỗ dựa trên đo đếm điểm cao thấp, làm cho dừng lỗ linh hoạt hơn.
Chiến lược giao dịch
Tín hiệu mở cửa
Tín hiệu đa đầu: xu hướng tăng và MACD vượt qua đường Signal và giá trị chéo nhỏ hơn giá trị giới hạn Tín hiệu đầu trống: xu hướng giảm và MACD đi qua đường Signal và giá trị chéo lớn hơn giá trị giới hạn
Tín hiệu cân bằng
Giá vượt qua mức dừng ATR Giá vượt qua mức dừng ATR Giá vượt mức ATR Hạn chế đầu: Giá vượt qua mức dừng ATR
Phân tích lợi thế
Lợi thế lớn nhất của chiến lược này là tận dụng tối đa lợi thế của MTF EMA trong việc xác định xu hướng và MACD tạo ra tín hiệu mua và bán. MTF EMA có thể xác định rõ hướng xu hướng tổng thể, tránh giao dịch thường xuyên trong tình trạng biến động. Chỉ số MACD có thể nắm bắt tốt hơn các thay đổi trong tình hình giá ngắn hạn, tạo ra tín hiệu mua và bán.
Rủi ro và giải pháp
Chiến lược này có hai rủi ro chính: đầu tiên là MTF EMA có thể tạo ra tín hiệu sai khi không có xu hướng rõ ràng, dẫn đến thua lỗ; hai là MACD thường tạo ra tín hiệu sai lệch khi biến động giá lớn, có thể dẫn đến giao dịch quá mức. Đối với rủi ro đầu tiên, các tham số MTF EMA có thể được điều chỉnh thích hợp để phù hợp hơn với biến động xu hướng giá; rủi ro thứ hai có thể được giảm thiểu bằng cách đặt giới hạn chéo của MACD.
Hướng tối ưu hóa
Chiến lược này có thể được tối ưu hóa theo các khía cạnh sau:
Điều chỉnh tham số chu kỳ của MTF EMA để phù hợp hơn với đặc điểm giá của các loại giao dịch khác nhau
Tối ưu hóa đường trung bình nhanh và đường trung bình tín hiệu của MACD để có được tín hiệu tốt hơn
Kiểm tra các tham số chu kỳ ATR khác nhau và số lần dừng để có được lợi nhuận tốt nhất
Thêm các chỉ số phụ trợ khác để lọc tín hiệu
Tóm tắt
Chiến lược mở lỗ dài này sử dụng phương pháp đánh giá xu hướng EMA của MTF, tạo tín hiệu giao dịch của MACD và phương pháp dừng lỗ động ATR, có thể thu được lợi nhuận tốt hơn trong thị trường có xu hướng rõ ràng. Chiến lược này có không gian tối ưu hóa lớn, có thể đạt được hiệu suất tốt hơn thông qua điều chỉnh và tối ưu hóa các tham số. Tuy nhiên, cần chú ý kiểm soát rủi ro và tránh giao dịch mù quáng trong tình huống xung đột.
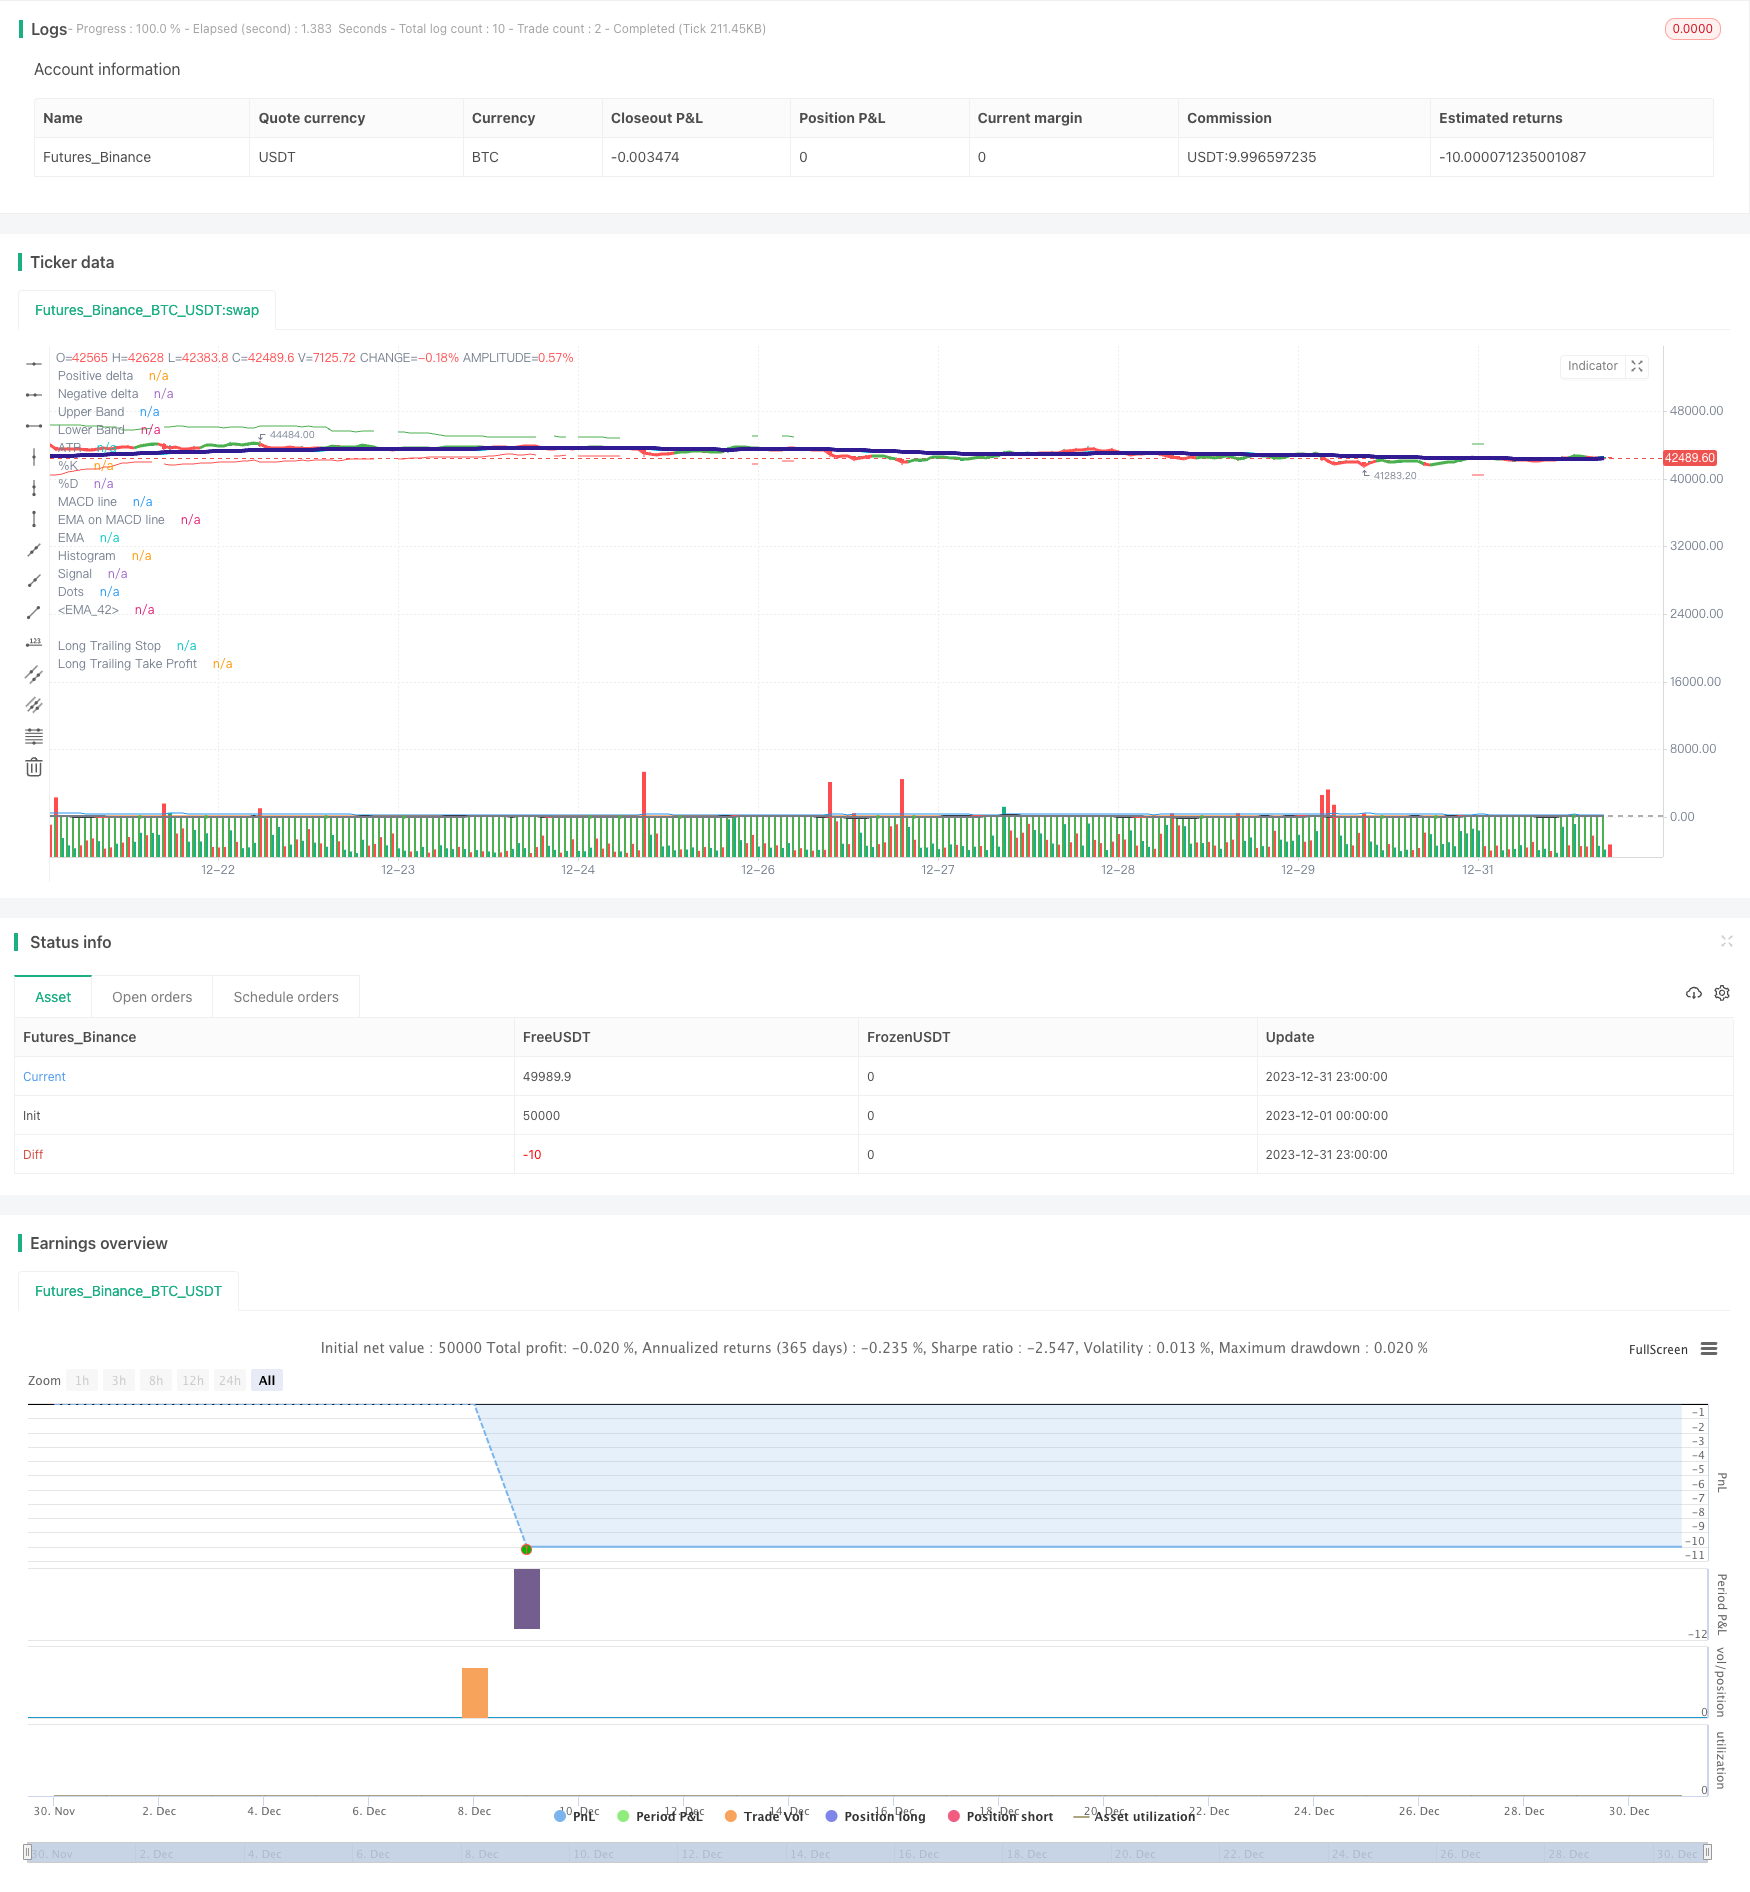
/*backtest
start: 2023-12-01 00:00:00
end: 2023-12-31 23:59:59
period: 1h
basePeriod: 15m
exchanges: [{"eid":"Futures_Binance","currency":"BTC_USDT"}]
*/

// This source code is subject to the terms of the Mozilla Public License 2.0 at https://mozilla.org/MPL/2.0/
// © Steven A. Zmuda Burke / stevenz17
//@version=4
// From Date Inputs
fromDay = input(defval = 01, title = "From Day", minval = 1, maxval = 31)
fromMonth = input(defval = 04, title = "From Month", minval = 1, maxval = 12)
fromYear = input(defval = 2022, title = "From Year", minval = 1970)

// To Date Inputs
toDay = input(defval = 01, title = "To Day", minval = 1, maxval = 31)
toMonth = input(defval = 05, title = "To Month", minval = 1, maxval = 12)
toYear = input(defval = 2022, title = "To Year", minval = 1970)

// Calculate start/end date and time condition
startDate = timestamp(fromYear, fromMonth, fromDay, 00, 00)
finishDate = timestamp(toYear, toMonth, toDay, 00, 00)
time_cond = true

// Input
strategy("LONG", overlay=true, initial_capital=1000, default_qty_type=strategy.percent_of_equity, default_qty_value=100, slippage=1, commission_type=strategy.commission.percent,
     commission_value=0.015)
SOURCE = input(title = "═════════════════════ SOURCE ═════════════════════", defval = false, type = input.bool)
sourcehl2 = input(title="Source hl2 or (open+close)/2 ?",type=input.bool,defval=true)
source = sourcehl2 ? hl2 : ((open+close)/2)

//MTF EMA
MTFEMA = input(title = "════════════════════ MTF EMA ════════════════════", defval = false, type = input.bool)

res1=input(title="MTF EMA 1", type=input.resolution, defval="60")
len1 = input(title = "EMA Period 1", type=input.integer, defval=70, minval=1)
ema1 = ema(source, len1)
emaStep1 = security (syminfo.tickerid, res1, ema1, barmerge.gaps_off, barmerge.lookahead_off)
mtf1 = emaStep1

res2=input(title="MTF EMA 2", type=input.resolution, defval="15")
len2 = input(title = "EMA Period 2", type=input.integer, defval=68, minval=1)
ema2 = ema(source, len2)
emaStep2 = security (syminfo.tickerid, res2, ema2, barmerge.gaps_off, barmerge.lookahead_off)
mtf2 = emaStep2

t1 = plot(mtf1, linewidth=4, color= color.aqua, title="EMA")
t2 = plot(mtf2, linewidth=4, color= color.navy, title="EMA")
fill(t1, t2, transp = 70, color = mtf1 > mtf2 ? color.red : color.green)

///MACD
MACD= input(title = "═════════════════════ MACD ══════════════════════", defval = false, type = input.bool)
MACDsource=close
fastLength = input(13, minval=1, title="MACD fast moving average")
slowLength=input(18,minval=1, title="MACD slow moving average")
signalLength=input(24,minval=1, title="MACD signal line moving average")
MacdEmaLength =input(9, title="MACD EMA period", minval=1)
useEma = input(true, title="Use EMA (otherwise SMA)")
useOldAlgo = input(false, title="Use normal MACD")
Lmacsig=input(title="LONG MACD and signal crossover limit",type=input.integer,defval=180)

// Fast line
ma1= useEma ? ema(MACDsource, fastLength) : sma(MACDsource, fastLength)
ma2 = useEma ?  ema(ma1,fastLength) :  sma(ma1,fastLength)
fastMA = ((2 * ma1) - ma2)

// Slow line
mas1=  useEma ? ema(MACDsource , slowLength) :  sma(MACDsource , slowLength)
mas2 =  useEma ? ema(mas1 , slowLength): sma(mas1 , slowLength)
slowMA = ((2 * mas1) - mas2)

// MACD line
macd = fastMA - slowMA

// Signal line
emasig1 = ema(macd, signalLength)
emasig2 = ema(emasig1, signalLength)
signal = useOldAlgo ? sma(macd, signalLength) : (2 * emasig1) - emasig2

hist = macd - signal

histline = hist > 0 ? color.green : color.red

//MACD ribbon
macdribbon=input(title="Show MACD ribbon?",type=input.bool,defval=false)
macdx=input(title="MACD ribbon multiplier", type=input.integer, defval=3, minval=1)

leadLine1 = macdribbon ? macd*macdx + source : na
leadLine2 = macdribbon ? signal*macdx + source : na
leadLine3 = hist + source

//MACD plot
p3 = plot(leadLine1, color= color.green, title="MACD", transp = 100, linewidth = 8)
p4 = plot(leadLine2, color= color.red, title="Signal", transp = 100, linewidth = 8)
fill(p3, p4, transp = 20, color = leadLine1 > leadLine2 ? #53b987 : #eb4d5c)

plot((leadLine3), color = histline, title="Histogram", linewidth = 3)


l="TEst"

upHist = (hist > 0) ? hist : 0
downHist = (hist <= 0) ? hist : 0

p1 = plot(upHist, color=color.green, transp=40, style=plot.style_columns, title='Positive delta')
p2 = plot(downHist, color=color.green, transp=40, style=plot.style_columns, title='Negative delta')

zeroLine = plot(macd, color=color.black, transp=0, linewidth=2, title='MACD line')
signalLine = plot(signal, color=color.gray, transp=0, linewidth=2, title='Signal')

ribbonDiff = color.green
fill(zeroLine, signalLine, color=ribbonDiff)

circleYPosition = signal
plot(ema(macd,MacdEmaLength) , color=color.red, transp=0, linewidth=2, title='EMA on MACD line')

ribbonDiff2 = hist > 0 ? color.green : color.red
plot(crossunder(signal,macd) ? circleYPosition : na,style=plot.style_circles, linewidth=4, color=ribbonDiff, title='Dots')


//STOCHASTIC
stochchch= input(title = "═══════════════════ STOCHASTIC ════════════════════", defval = false, type = input.bool)
StochOn = input(title="Stochastic On?",type=input.bool,defval=true)
periodK = input(10, title="K", minval=1)
periodD = input(1, title="D", minval=1)
smoothK = input(3, title="Smooth", minval=1)
stochlimit = input(30, title="Stoch value crossover", minval=1)
k = sma(stoch(close, high, low, periodK), smoothK)
d = sma(k, periodD)

stochSignal = StochOn ? (d < stochlimit ? true : false) : true

pp= input(1, title="avg price length", minval=1)
p = ema (source, pp)
K = k + p

plot(k, title="%K", color=#0094FF)
plot(d, title="%D", color=#FF6A00)
h0 = hline(72, "Upper Band", color=#606060)
h1 = hline(20, "Lower Band", color=#606060)
fill(h0, h1, color=#9915FF, transp=80, title="Background")


//Long
LS= "════════════════════════════════ LONG CONDITIONS ═══════════════════════════"

uptrend = close > mtf1 and mtf1 < mtf2
downtrend = close < mtf1 and mtf1 > mtf2

crossMACD = crossunder(macd,signal)

LongBuy = uptrend and stochSignal? crossMACD and signal < Lmacsig and macd < Lmacsig : na

LONG = strategy.position_size > 0
SHORT = strategy.position_size < 0
FLAT = strategy.position_size == 0

plotshape(LongBuy, style=shape.xcross, text="LONG", color=color.green)

//ATR & TP/SL

ATRTPSLX= input(title = "═════════════════ LONG SL ═════════════════", defval = false, type = input.bool)

maxIdLossPcnt = input(5, "Max Intraday Loss(%)", type=input.float, minval=0.0, step=0.1)
// strategy.risk.max_intraday_loss(maxIdLossPcnt, strategy.percent_of_equity)

SSL2=input(title="Long Stop Loss when MTF EMA cross?",type=input.bool,defval=false)

SSLOP = LONG  and crossunder(source, mtf1)

SlossPercOn = input(title="Long Stop Loss (%) on?",type=input.bool,defval=false)
SlossPerc = input(title="Long Stop Loss (%)", type=input.float, minval=0.0, step=0.1, defval=4.7) * 0.01
SSpricePerc = LONG and SlossPercOn? strategy.position_avg_price * (-1 - SlossPerc) : na
plot(series = SSpricePerc, linewidth=2, color= color.maroon,style=plot.style_linebr, title="Long Stop Loss %")
SSLX = LONG and crossunder(source, SSpricePerc)

SSLatr= input(title="Long Stop Loss ATR?",type=input.bool,defval=true)
useStructure=input(title="Look back for High/Lows?",type=input.bool,defval=true)
Slookback=input(title="How far to look back for High/Lows:",type=input.integer,defval=18,minval=1)
SatrLenghth=input(title="Long ATR Lenghth",type=input.integer,defval=9,minval=1)
SatrStopMultiplier=input(title="Long ATR Stop x ?", type=input.float,defval=4.3, minval=0.1,step=0.1)

Satr = atr(SatrLenghth)
LongStop = SSLatr ? ((useStructure ? lowest(low, Slookback) : source) - Satr * SatrStopMultiplier) : na

SStop = crossunder(source,LongStop)

plot(Satr, color=color.blue, title="ATR", transp=100)
plot(series = uptrend ? LongStop : na, color=color.red, style=plot.style_linebr, title="Long Trailing Stop", transp=0)


ATRTPSLXX= input(title = "═════════════════ LONG TP ═════════════════", defval = false, type = input.bool)

TpPercOn = input(title="Long Take Profit (%) on?",type=input.bool,defval=true)
TpPerc = input(title="Long Take Profit (%)", type=input.float, minval=0.0, step=0.1, defval=5.3) * 0.01
TppricePerc = LONG and TpPercOn? strategy.position_avg_price * (-1 + TpPerc) : na
plot(series = TppricePerc, linewidth=2, color= color.lime,style=plot.style_linebr, title="Long Take Profit %")
TPLX = LONG and crossunder(source, TppricePerc)

TP1=input(title="1 Long Take Profit On?",type=input.bool,defval=true)

useStructure1=input(title="Look back for High/Lows?",type=input.bool,defval=true)
STplookback=input(title="How far to look back for High/Lows for 1 TP",type=input.integer,defval=12,minval=1)
STpatrLenghth=input(title="Long ATR Lenghth 1 TP",type=input.integer,defval=24,minval=1)
SatrProfitMultiplier = input(title="First Long ATR Take Profit x ?", type=input.float,defval=5.5, minval=0.1,step=0.1)
STpatr = atr(STpatrLenghth)
LongTakeProfit = (useStructure1 ? highest(high, STplookback) : source) + STpatr * SatrProfitMultiplier
LongTP = TP1 ? crossover(source, LongTakeProfit): false
plot(series = uptrend ? LongTakeProfit: na , color=color.green, style=plot.style_linebr, title="Long Trailing Take Profit", transp=0)


// Bar color
barcolor(cross(macd, signal) ? (macd - signal > 0 ? (uptrend and macd < 0 and signal < 0 ? color.yellow : na) : (downtrend and macd > 0 and signal > 0 ? color.blue : na)) : na)

// Strategy ATR

GOLONG = LongBuy and SSLatr and FLAT

if GOLONG and TP1
    strategy.entry(id="Entry LONG 1TP", long=true,comment="Entry Long")
    strategy.exit("Long Profit or Loss 1TP","Entry LONG 1TP", limit=LongTakeProfit, stop=LongStop)
if SSLX
    strategy.close(id="Entry LONG 1TP", comment="% Long SL EXIT")
if TPLX
    strategy.close(id="Entry LONG 1TP", comment="% Long TP EXIT")

if SSLOP and SSL2
    strategy.close(id="Entry LONG 1TP", comment="MTF EMA cross EXIT")

if (not time_cond)
    strategy.close_all()
    strategy.cancel_all()


//plot(strategy.equity, title="equity", color=red, linewidth=2, style=areabr)

//@version=4