Kiên nhẫn theo dõi chiến lược theo xu hướng
Tổng quan
Chiến lược theo dõi xu hướng kiên nhẫn là một chiến lược theo dõi xu hướng. Nó sử dụng một bộ chỉ số của đường trung bình di chuyển để xác định xu hướng và kết hợp với chỉ số CCI mua quá mức để phát tín hiệu giao dịch. Chiến lược này theo đuổi xu hướng lớn và có thể tránh được trong tình huống biến động.
Nguyên tắc chiến lược
Chiến lược này sử dụng sự kết hợp của EMA 21 chu kỳ và 55 chu kỳ để xác định xu hướng. EMA ngắn hạn được xác định là xu hướng tăng khi nằm trên EMA dài hạn và xu hướng giảm khi nằm dưới EMA dài hạn.
Chỉ số CCI được sử dụng để đánh giá tình trạng quá mua quá bán. CCI trên 100 đường là tín hiệu quá bán dưới cùng, dưới 100 đường là tín hiệu quá mua trên cùng.
Khi đánh giá là xu hướng tăng, nếu chỉ số CCI phát ra tín hiệu bán quá mức mạnh mẽ ở dưới, thì sẽ được tham gia nhiều đầu. Khi đánh giá là xu hướng giảm, nếu chỉ số CCI phát ra tín hiệu mua quá mức mạnh mẽ ở trên, thì sẽ được tham gia bằng đầu trống.
Đường dừng lỗ được thiết lập là chỉ số SuperTrend và mục tiêu lợi nhuận được thiết lập là số điểm cố định.
Phân tích lợi thế
Chiến lược này có những lợi thế chính như sau:
- Theo dõi xu hướng lớn và tránh bị mắc kẹt
- Chỉ số CCI có thể đánh giá hiệu quả điểm đảo ngược
- Đường dừng SuperTrend được thiết lập hợp lý
- Lệnh dừng cố định và dừng cố định, rủi ro có thể kiểm soát được
Phân tích rủi ro
Chiến lược này có những rủi ro:
- Tỷ lệ sai lầm trong định kiến xu hướng
- Tỷ lệ phát tín hiệu sai của chỉ số CCI
- Khả năng gây ra thiệt hại không cần thiết khi điểm dừng quá nông hoặc quá sâu
- Tỷ lệ lợi nhuận của các điểm dừng cố định không thể theo dõi xu hướng liên tục
Đối với những rủi ro này, chúng ta có thể tối ưu hóa bằng cách điều chỉnh các tham số chu kỳ EMA, tham số CCI và điểm dừng lỗ. Ngoài ra, việc giới thiệu nhiều chỉ số hơn để xác minh tín hiệu chiến lược cũng rất cần thiết.
Hướng tối ưu hóa
Chiến lược này được tối ưu hóa bởi:
Kiểm tra các kết hợp của các chỉ số khác nhau, tìm kiếm các định hướng tốt hơn và các chỉ số xác nhận tín hiệu.
Sử dụng ATR để theo dõi xu hướng tốt hơn và kiểm soát rủi ro.
Giới thiệu mô hình học máy dựa trên đào tạo dữ liệu lịch sử để đánh giá xác suất xu hướng.
Điều chỉnh và tối ưu hóa các tham số cho các giống khác nhau.
Tóm tắt
Chiến lược theo dõi xu hướng kiên nhẫn nói chung là một chiến lược theo dõi xu hướng rất thực tế. Nó sử dụng đường trung bình di chuyển để xác định hướng của xu hướng lớn, chỉ số CCI tìm thấy tín hiệu vị trí đảo ngược, thiết lập đường dừng xu hướng siêu hợp lý.
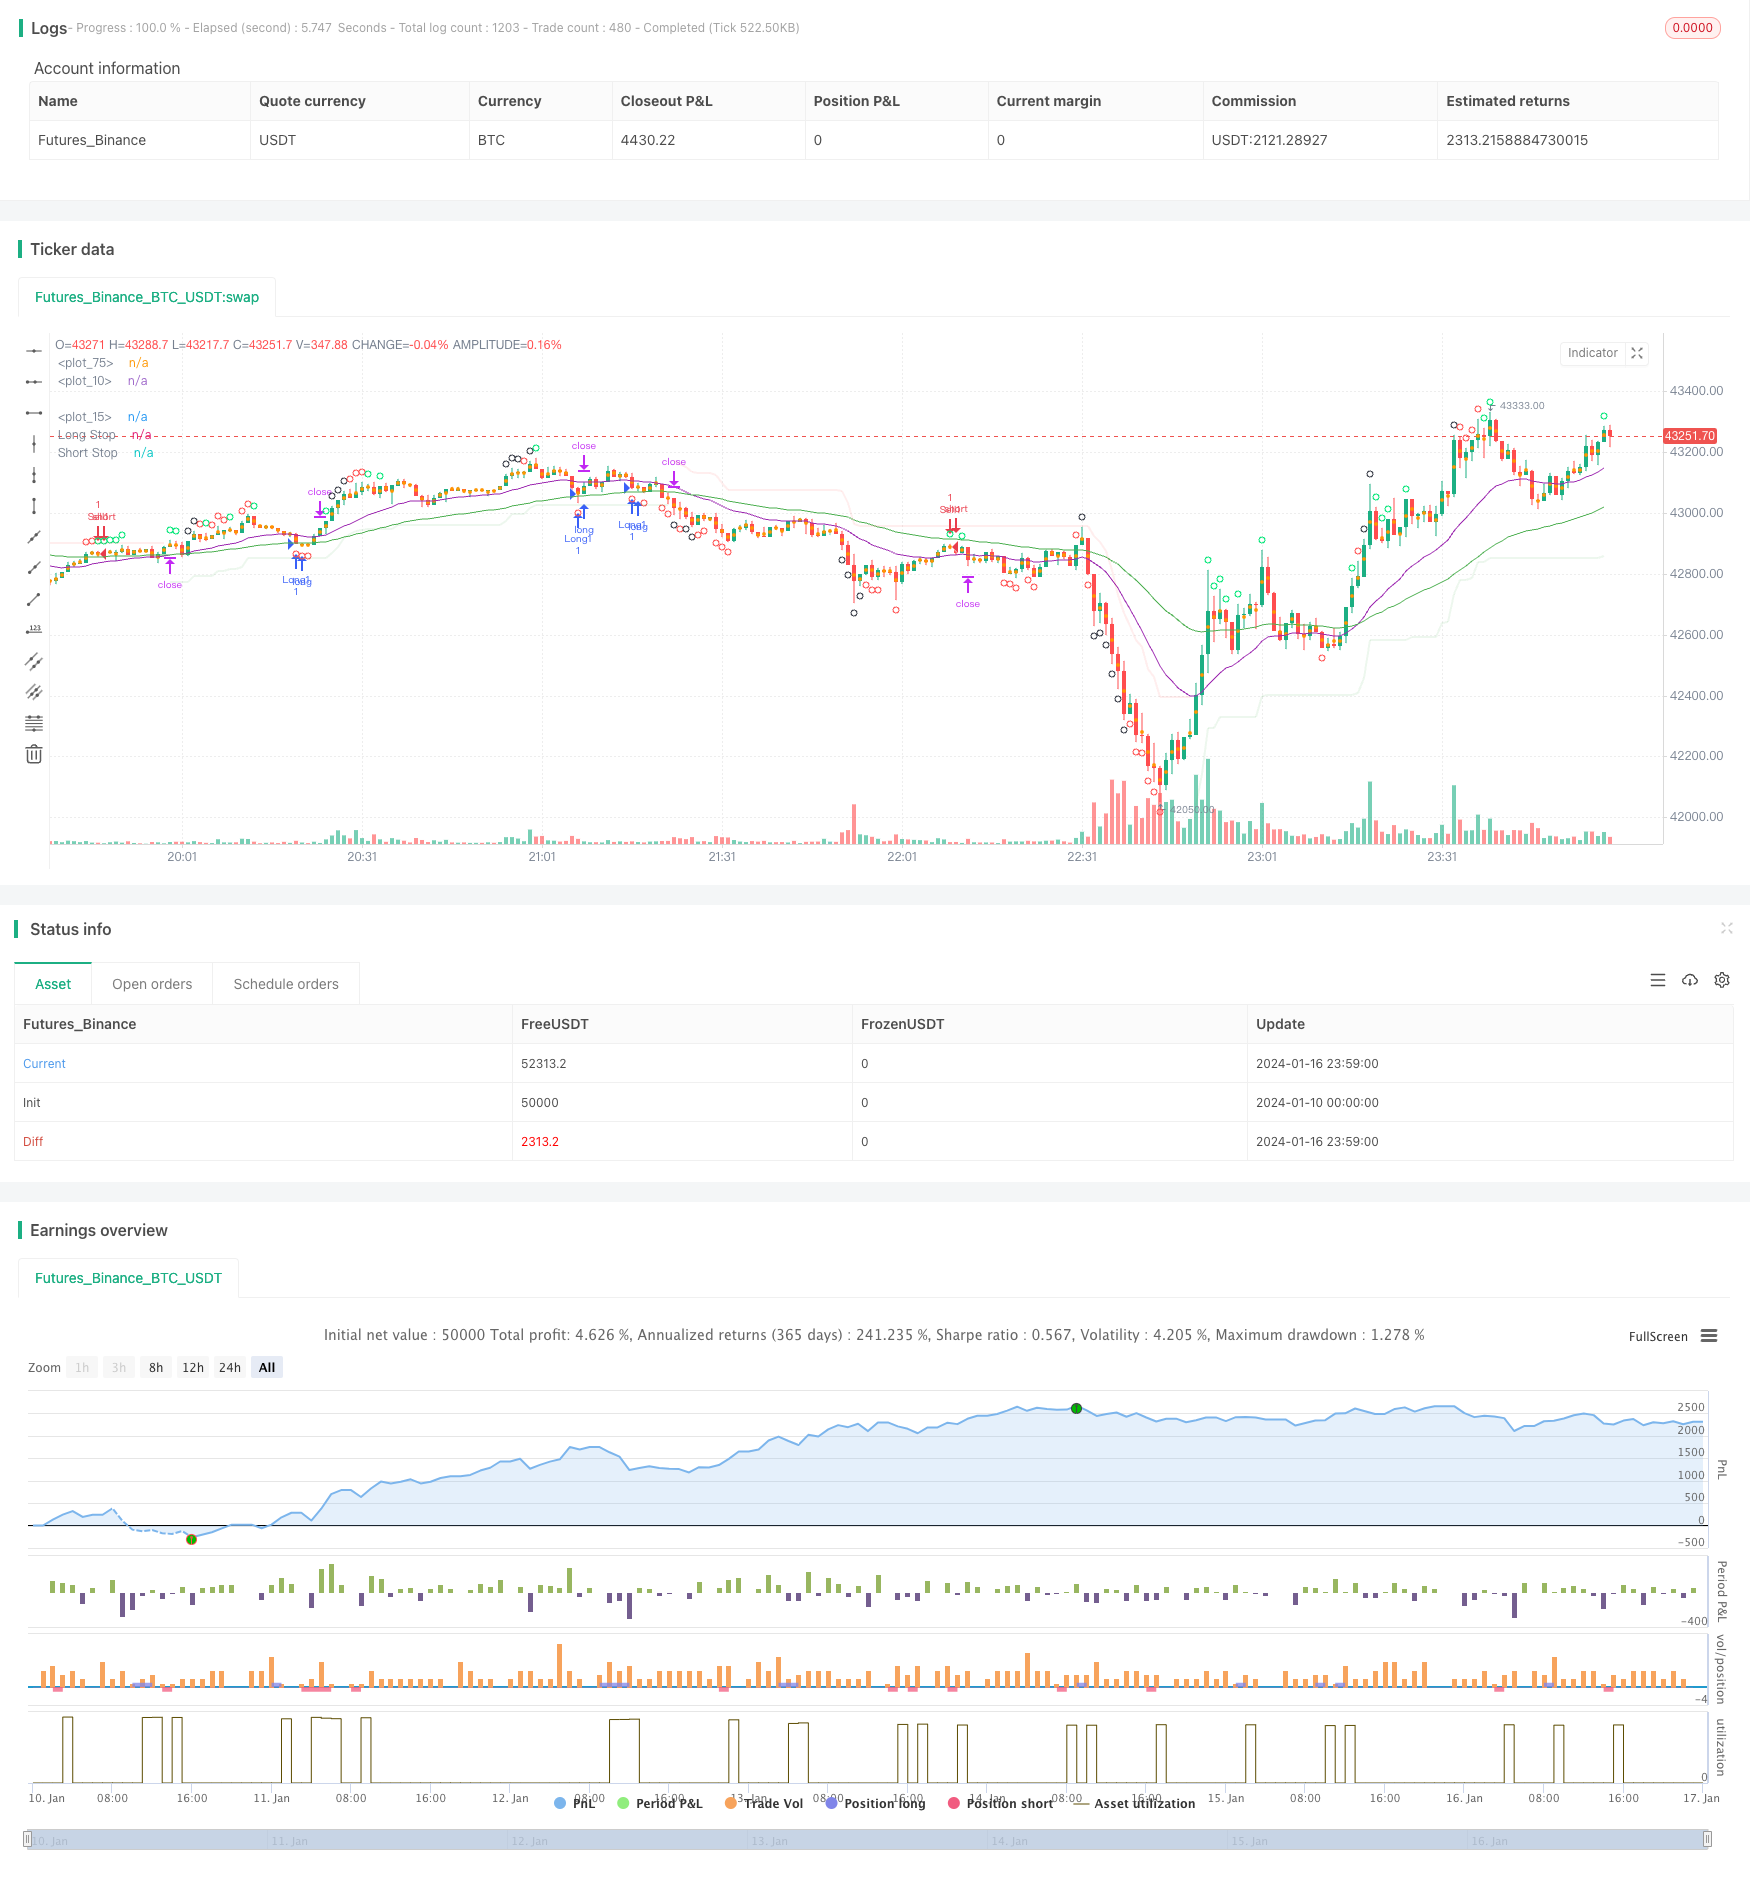
/*backtest
start: 2024-01-10 00:00:00
end: 2024-01-17 00:00:00
period: 1m
basePeriod: 1m
exchanges: [{"eid":"Futures_Binance","currency":"BTC_USDT"}]
*/

// This source code is subject to the terms of the Mozilla Public License 2.0 at https://mozilla.org/MPL/2.0/
// © greenmask9

//@version=4
strategy("Patient Trendfollower (7) Strategy", overlay=true)

// 21 EMA
emalength = input(21, title="Short EMA")
emashort = ema(close, emalength)
plot(emashort, color = color.purple, linewidth=1)

// 55 EMA
emalength2 = input(55, title="Long EMA")
ema = ema(close, emalength2)
plot(ema, color = color.green, linewidth=1)

//CCI calculation and inputs
lengthcci = input(20, minval=1, title="Overbought/sold detector period")
src = input(close, title="Overbought/sold detector source")
ma = sma(src, lengthcci)
ccivalue = (src - ma) / (0.015 * dev(src, lengthcci))


//CCI plotting
ccioverbought = input(defval=100, title="Overbought level 1")
ccioverbought2 = input(defval=140, title="Overbought level 2")
ccioverbought3 = input(defval=180, title="Overbought level 3")

ccioversold = input(defval=-100, title="Oversold level 1")
ccioversold2 = input(defval=-140, title="Oversold level 2")
ccioversold3 = input(defval=-180, title="Oversold level 3")

cciOB = (ccivalue >= ccioverbought and ccivalue < ccioverbought2)
plotshape(cciOB,  title= "Overbought", location=location.abovebar, color=color.lime, transp=0, style=shape.circle)
cciOS = (ccivalue <= ccioversold and ccivalue > ccioversold2)
plotshape(cciOS, title= "Oversold", location=location.belowbar, color=color.lime, transp=0, style=shape.circle)

cciOB2 = (ccivalue >= ccioverbought2 and ccivalue < ccioverbought3)
plotshape(cciOB2,  title= "Overbought", location=location.abovebar, color=color.red, transp=0, style=shape.circle)
cciOS2 = (ccivalue <= ccioversold and ccivalue > ccioversold3)
plotshape(cciOS2, title= "Oversold", location=location.belowbar, color=color.red, transp=0, style=shape.circle)

cciOB3 = (ccivalue >= ccioverbought3)
plotshape(cciOB3,  title= "Overbought", location=location.abovebar, color=color.black, transp=0, style=shape.circle)
cciOS3 = (ccivalue <= ccioversold3)
plotshape(cciOS3, title= "Oversold", location=location.belowbar, color=color.black, transp=0, style=shape.circle)

//Supertrend

length = input(title="ATR Period", type=input.integer, defval=55)
mult = input(title="ATR Multiplier", type=input.float, step=0.1, defval=5.0)
wicks = input(title="Take Wicks into Account ?", type=input.bool, defval=true)
illuminate = input(title="Illuminate Trend", type=input.bool, defval=true)

atr = mult * atr(length)

longStop = hl2 - atr
longStopPrev = nz(longStop[1], longStop)
longStop := (wicks ? low[1] : close[1]) > longStopPrev ? max(longStop, longStopPrev) : longStop

shortStop = hl2 + atr
shortStopPrev = nz(shortStop[1], shortStop)
shortStop := (wicks ? high[1] : close[1]) < shortStopPrev ? min(shortStop, shortStopPrev) : shortStop

dir = 1
dir := nz(dir[1], dir)
dir := dir == -1 and (wicks ? high : close) > shortStopPrev ? 1 : dir == 1 and (wicks ? low : close) < longStopPrev ? -1 : dir

longColor = color.new(color.green, 90)
shortColor = color.new(color.red, 90)
noneColor = color.new(color.white, 100)

longStopPlot = plot(dir == 1 ? longStop : na, title="Long Stop", style=plot.style_linebr, linewidth=2, color=longColor)
shortStopPlot = plot(dir == 1 ? na : shortStop, title="Short Stop", style=plot.style_linebr, linewidth=2, color=shortColor)
midPricePlot = plot(ohlc4, title="", style=plot.style_circles, linewidth=0)

longFillColor = illuminate ? (dir == 1 ? longColor : noneColor) : noneColor
shortFillColor = illuminate ? (dir == -1 ? shortColor : noneColor) : noneColor
fill(midPricePlot, longStopPlot, title="Long State Filling", color=longFillColor)
fill(midPricePlot, shortStopPlot, title="Short State Filling", color=shortFillColor)

//entries
uptrend = emashort>ema and dir == 1
upsignal = ccivalue<=ccioversold and ccivalue>ccioversold2
upsignal2 = ccivalue<=ccioversold2 and ccivalue>ccioversold3
upsignal3 = ccivalue<=ccioversold3
downtrend = emashort<ema and dir == -1
downsignal = ccivalue>=ccioverbought and ccivalue<ccioverbought2
downsignal2 = ccivalue>=ccioverbought2 and ccivalue<ccioverbought3
downsignal3 = ccivalue>=ccioverbought3

//adapts to the current bar, I need to save the bars number when the condition for buy was true, static number is spread
spread = input (0.00020, title="Spread")
upstoploss = longStop - spread
downstoploss = shortStop + spread
strategy.initial_capital = 50000
ordersize=floor(strategy.initial_capital/close)
testlong = input(title="Test longs", type=input.bool, defval=true)
testshort = input(title="Test shorts", type=input.bool, defval=true)
//new
degree = input(title="Test level 1 overbought/sold levels", type=input.bool, defval=true)
degree2 = input(title="Test level 2 overbought/sold levels", type=input.bool, defval=false)
degree3 = input(title="Test level 3 overbought/sold levels", type=input.bool, defval=false)

statictarget = input(title="Use static target", type=input.bool, defval=true)
statictargetvalue = input(title="Static target in pips", type=input.integer, defval=400)

//timetrade = input(title="Open trades only withing specified time", type=input.bool, defval=true)
//timtrade = input()

//přidat možnost TP podle ATR a sl podle ATR
buy1 = uptrend and upsignal and strategy.opentrades==0 and testlong and degree
x1 = barssince (buy1)
if (buy1)
//bodlo by zakázat atrtarget v tomto případě
    if (statictarget)
        strategy.entry("Long1", strategy.long, ordersize)
        strategy.exit( "Exitlong", from_entry="Long1" , profit=statictargetvalue,stop=upstoploss[x1])

buy2 = uptrend and upsignal2 and strategy.opentrades==0 and testlong and degree2
x2 = barssince (buy2)
if (buy2)
//bodlo by zakázat atrtarget v tomto případě
    if (statictarget)
        strategy.entry("Long2", strategy.long, ordersize)
        strategy.exit( "Exitlong", from_entry="Long2" , profit=statictargetvalue,stop=upstoploss[x2])

buy3 = uptrend and upsignal3 and strategy.opentrades==0 and testlong and degree3
x3 = barssince (buy3)
if (buy3)
//bodlo by zakázat atrtarget v tomto případě
    if (statictarget)
        strategy.entry("Long3", strategy.long, ordersize)
        strategy.exit( "Exitlong", from_entry="Long3" , profit=statictargetvalue,stop=upstoploss[x3])

sell1 = downtrend and downsignal and strategy.opentrades==0 and testshort and degree
y1 = barssince (sell1)
if (sell1)
    if (statictarget)
        strategy.entry("Sell1", strategy.short, ordersize)
        strategy.exit( "Exitshort", from_entry="Sell1" , profit=statictargetvalue,stop=downstoploss[y1])

sell2 = downtrend and downsignal2 and strategy.opentrades==0 and testshort and degree2
y2 = barssince (sell2)
if (sell2)
    if (statictarget)
        strategy.entry("Sell2", strategy.short, ordersize)
        strategy.exit( "Exitshort", from_entry="Sell2" , profit=statictargetvalue,stop=downstoploss[y2])

sell3 = downtrend and downsignal3 and strategy.opentrades==0 and testshort and degree3
y3 = barssince (sell3)
if (sell3)
    if (statictarget)
        strategy.entry("Sell3", strategy.short, ordersize)
        strategy.exit( "Exitshort", from_entry="Sell3" , profit=statictargetvalue,stop=downstoploss[y3])