Chiến lược theo xu hướng với đường trung bình động kép và StochRSI Crossover
Tổng quan
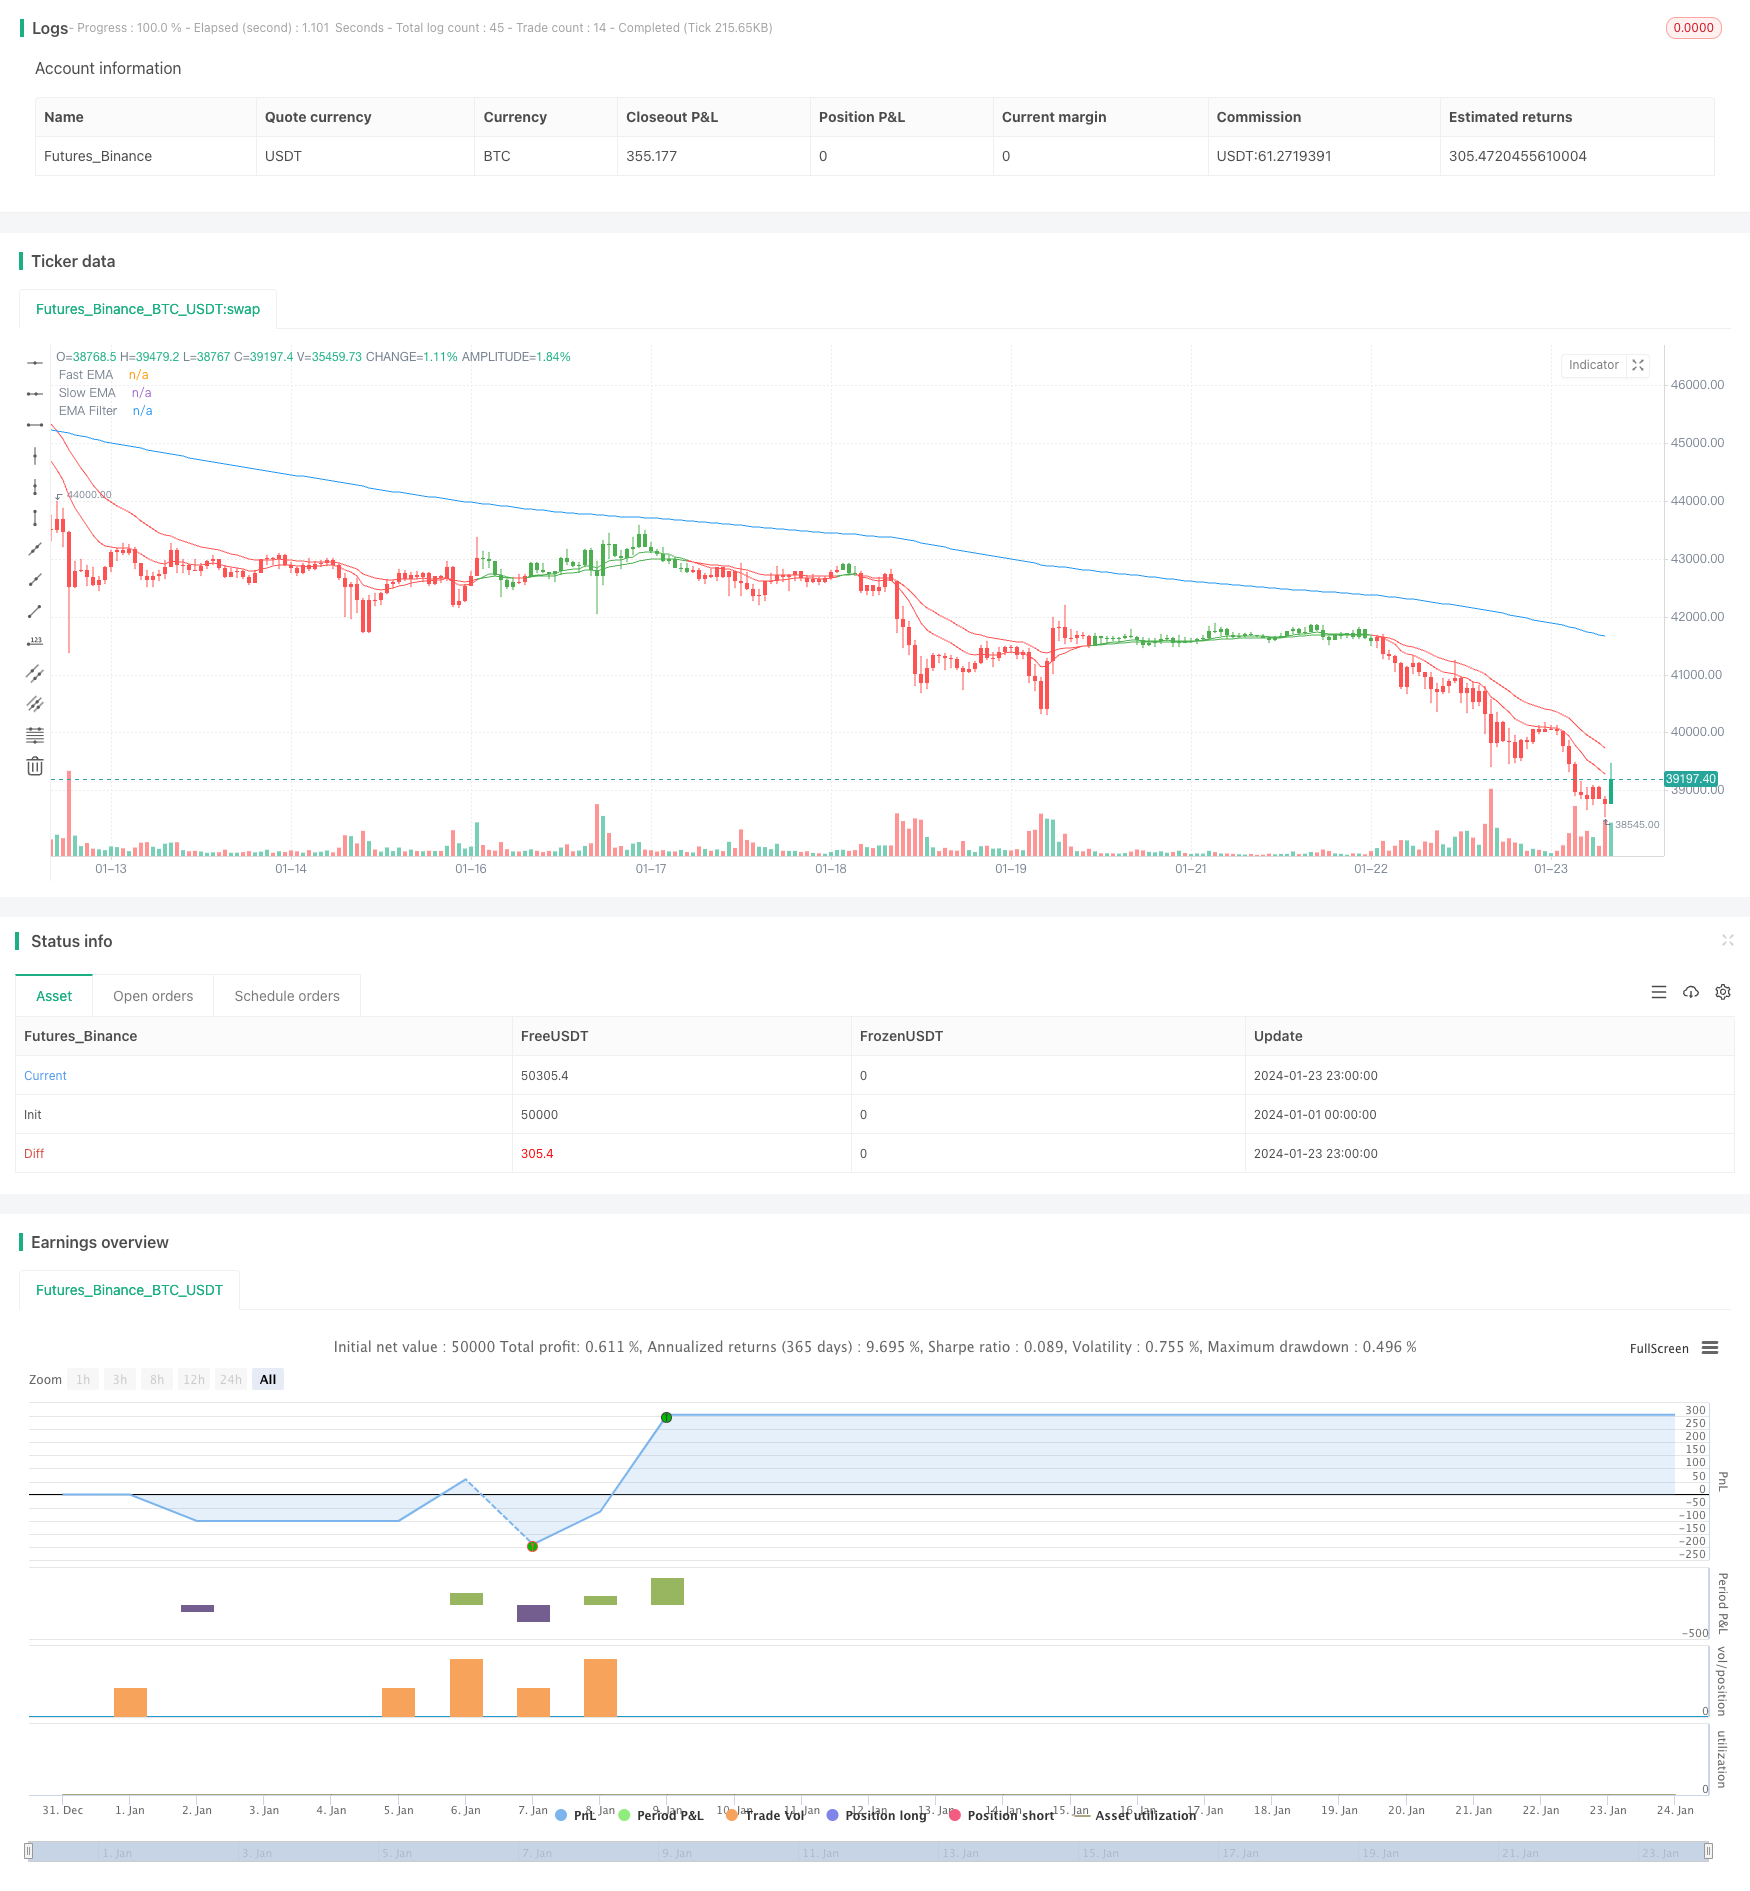
Chiến lược này kết hợp sử dụng đường trung bình di chuyển kép và chỉ số StochRSI để xác định hướng xu hướng và điểm vào. Đặc điểm chính của nó là có thể vào thị trường trong giai đoạn bắt đầu của xu hướng, đồng thời sử dụng tính năng mua quá mức của chỉ số StochRSI để lọc các đột phá giả.
Nguyên tắc chiến lược
Chiến lược này sử dụng trung bình di chuyển nhanh EMA ((12) và trung bình di chuyển chậm EMA ((25) để xây dựng hệ thống trung bình di chuyển kép, tạo ra tín hiệu mua khi đường nhanh đi qua đường chậm và tín hiệu bán khi đường nhanh đi qua đường chậm, để xác định hướng của xu hướng lớn.
Trong khi đó, chiến lược này kết hợp với sự giao thoa của chỉ số StochRSI để xác định thêm thời gian vào. Chỉ số StochRSI kết hợp với chỉ số ngẫu nhiên KDJ và RSI, tạo ra tín hiệu mua khi đường K đi qua đường D từ vùng bán tháo và bán khi đường K đi qua đường D từ vùng mua tháo.
Chiến lược này chỉ mở vị trí khi đường trung bình di chuyển kép tạo ra tín hiệu và StochRSI cũng tạo ra tín hiệu tương ứng. Do đó, nó có thể lọc một số trường hợp phá vỡ giả và tránh giao dịch không hiệu quả.
Phân tích lợi thế
Lợi thế lớn nhất của chiến lược này là có thể xác định sớm hướng xu hướng và điểm vào tiềm năng. Hệ thống trung bình di chuyển có thể tạo ra tín hiệu khi xu hướng bắt đầu, và việc thêm chỉ số StochRSI có thể lọc hiệu quả các đợt phá vỡ giả mạo và tránh giao dịch sai.
Ngoài ra, chiến lược này kết hợp cả phân tích xu hướng và phán đoán mua bán quá mức, cùng với lợi thế của việc theo dõi xu hướng và đảo ngược giao dịch.
Phân tích rủi ro
Rủi ro chính của chiến lược này nằm ở sự chậm trễ của hệ thống trung bình di chuyển. Hệ thống trung bình di chuyển đôi thường có thể phát ra tín hiệu muộn hơn một chút khi tình hình thị trường đột ngột thay đổi mạnh mẽ, dễ dàng làm cho chiến lược bỏ lỡ thời gian đầu vào tốt nhất.
Ngoài ra, chỉ số StochRSI cũng có thể tạo ra tín hiệu sai, gây ra giao dịch không cần thiết. Đặc biệt là trong thời gian biến động thị trường, đường K và đường D có thể xuyên qua nhau thường xuyên, gây rủi ro cho chiến lược.
Hướng tối ưu hóa
Chiến lược này đã được tối ưu hóa trong một số lĩnh vực:
Điều chỉnh các tham số của đường trung bình di chuyển đôi để sử dụng chu kỳ trung bình thuận lợi hơn để nắm bắt xu hướng;
Tối ưu hóa các tham số của StochRSI để tạo ra các tiêu chuẩn đánh giá mua quá mức hợp lý hơn;
Tăng số lượng đơn đặt hàng hoặc điều chỉnh mức dừng lỗ để theo đuổi tỷ lệ lợi nhuận cao hơn;
Kết hợp với các chỉ số khác làm điều kiện lọc để giảm thêm tín hiệu vô hiệu.
Tóm tắt
Chiến lược này rất phù hợp để nắm bắt xu hướng đường dài trung bình, có tiềm năng lợi nhuận lớn trong giai đoạn đầu của xu hướng. Đồng thời kết hợp với chỉ số StochRSI như một phán đoán phụ trợ, có thể lọc hiệu quả các tín hiệu sai lệch và tránh mất mát không cần thiết.
/*backtest
start: 2024-01-01 00:00:00
end: 2024-01-24 00:00:00
period: 1h
basePeriod: 15m
exchanges: [{"eid":"Futures_Binance","currency":"BTC_USDT"}]
*/

// This source code is subject to the terms of the Mozilla Public License 2.0 at https://mozilla.org/MPL/2.0/
// © btc_charlie / @TheParagonGrp

//@version=5
strategy('BlackBit Trader XO Macro Trend Scanner', overlay=true)

// Variables
var ok = 0
var countBuy = 0
var countSell = 0
src = input(close, title='OHLC Type')
i_fastEMA = input(12, title='Fast EMA')
i_slowEMA = input(25, title='Slow EMA')
i_defEMA = input(25, title='Consolidated EMA')

// Allow the option to show single or double EMA
i_bothEMAs = input(title='Show Both EMAs', defval=true)

// Define EMAs
v_fastEMA = ta.ema(src, i_fastEMA)
v_slowEMA = ta.ema(src, i_slowEMA)
v_biasEMA = ta.ema(src, i_defEMA)

// Color the EMAs
emaColor = v_fastEMA > v_slowEMA ? color.green : v_fastEMA < v_slowEMA ? color.red : #FF530D

// Plot EMAs
plot(i_bothEMAs ? na : v_biasEMA, color=emaColor, linewidth=3, title='Consolidated EMA')
plot(i_bothEMAs ? v_fastEMA : na, title='Fast EMA', color=emaColor)
plot(i_bothEMAs ? v_slowEMA : na, title='Slow EMA', color=emaColor)

// Colour the bars
buy = v_fastEMA > v_slowEMA
sell = v_fastEMA < v_slowEMA

if buy
    countBuy += 1
    countBuy

if buy
    countSell := 0
    countSell

if sell
    countSell += 1
    countSell

if sell
    countBuy := 0
    countBuy

buysignal = countBuy < 2 and countBuy > 0 and countSell < 1 and buy and not buy[1]
sellsignal = countSell > 0 and countSell < 2 and countBuy < 1 and sell and not sell[1]

barcolor(buysignal ? color.green : na)
barcolor(sellsignal ? color.red : na)


bull = countBuy > 1
bear = countSell > 1

barcolor(bull ? color.green : na)
barcolor(bear ? color.red : na)

// Set Alerts

// alertcondition(ta.crossover(v_fastEMA, v_slowEMA), title='Bullish EMA Cross', message='Bullish EMA crossover')
// alertcondition(ta.crossunder(v_fastEMA, v_slowEMA), title='Bearish EMA Cross', message='Bearish EMA Crossover')

// Stoch RSI code

smoothK = input.int(3, 'K', minval=1)
smoothD = input.int(3, 'D', minval=1)
lengthRSI = input.int(14, 'RSI Length', minval=1)
lengthStoch = input.int(14, 'Stochastic Length', minval=1)

rsi1 = ta.rsi(src, lengthRSI)
k = ta.sma(ta.stoch(rsi1, rsi1, rsi1, lengthStoch), smoothK)
d = ta.sma(k, smoothD)

bandno0 = input.int(80, minval=1, title='Upper Band', group='Bands (change this instead of length in Style for Stoch RSI colour to work properly)')
bandno2 = input.int(50, minval=1, title='Middle Band', group='Bands (change this instead of length in Style for Stoch RSI colour to work properly)')
bandno1 = input.int(20, minval=1, title='Lower Band', group='Bands (change this instead of length in Style for Stoch RSI colour to work properly)')

// Alerts

crossoverAlertBgColourMidOnOff = input.bool(title='Crossover Alert Background Colour (Middle Level) [ON/OFF]', group='Crossover Alerts', defval=false)
crossoverAlertBgColourOBOSOnOff = input.bool(title='Crossover Alert Background Colour (OB/OS Level) [ON/OFF]', group='Crossover Alerts', defval=false)

crossoverAlertBgColourGreaterThanOnOff = input.bool(title='Crossover Alert >input [ON/OFF]', group='Crossover Alerts', defval=false)
crossoverAlertBgColourLessThanOnOff = input.bool(title='Crossover Alert <input [ON/OFF]', group='Crossover Alerts', defval=false)

maTypeChoice = input.string('EMA', title='MA Type', group='Moving Average', options=['EMA', 'WMA', 'SMA', 'None'])
maSrc = input.source(close, title='MA Source', group='Moving Average')
maLen = input.int(200, minval=1, title='MA Length', group='Moving Average')

maValue = if maTypeChoice == 'EMA'
    ta.ema(maSrc, maLen)
else if maTypeChoice == 'WMA'
    ta.wma(maSrc, maLen)
else if maTypeChoice == 'SMA'
    ta.sma(maSrc, maLen)
else
    0

crossupCHECK = maTypeChoice == 'None' or open > maValue and maTypeChoice != 'None'
crossdownCHECK = maTypeChoice == 'None' or open < maValue and maTypeChoice != 'None'

crossupalert = crossupCHECK and ta.crossover(k, d) and (k < bandno2 or d < bandno2)
crossdownalert = crossdownCHECK and ta.crossunder(k, d) and (k > bandno2 or d > bandno2)
crossupOSalert = crossupCHECK and ta.crossover(k, d) and (k < bandno1 or d < bandno1)
crossdownOBalert = crossdownCHECK and ta.crossunder(k, d) and (k > bandno0 or d > bandno0)

aboveBandalert = ta.crossunder(k, bandno0)
belowBandalert = ta.crossover(k, bandno1)

bgcolor(color=crossupalert and crossoverAlertBgColourMidOnOff ? #4CAF50 : crossdownalert and crossoverAlertBgColourMidOnOff ? #FF0000 : na, title='Crossover Alert Background Colour (Middle Level)', transp=70)
bgcolor(color=crossupOSalert and crossoverAlertBgColourOBOSOnOff ? #fbc02d : crossdownOBalert and crossoverAlertBgColourOBOSOnOff ? #000000 : na, title='Crossover Alert Background Colour (OB/OS Level)', transp=70)

bgcolor(color=aboveBandalert and crossoverAlertBgColourGreaterThanOnOff ? #ff0014 : crossdownalert and crossoverAlertBgColourMidOnOff ? #FF0000 : na, title='Crossover Alert - K > Upper level', transp=70)
bgcolor(color=belowBandalert and crossoverAlertBgColourLessThanOnOff ? #4CAF50 : crossdownalert and crossoverAlertBgColourMidOnOff ? #FF0000 : na, title='Crossover Alert - K < Lower level', transp=70)

// alertcondition(crossupalert or crossdownalert, title='Stoch RSI Crossover', message='STOCH RSI CROSSOVER')

// Calculate start/end date and time condition
startDate = input(timestamp('2000-12-24T00:00:00'),group = "---------TIME RANGE SETTINGS---------")
finishDate = input(timestamp('2029-02-26T00:00:00'),group = "---------TIME RANGE SETTINGS---------")
time_cond = true


//ema filter
emalen = input(200,"EMA Filter Length",group = "EMA FILTER SETTINGS")
emasource = input(close,"EMA Filter Source",group = "EMA FILTER SETTINGS")
ema_fil = ta.ema(emasource,emalen)
plot(ema_fil,"EMA Filter")

//macd
fast_length = input(title="Fast Length", defval=26,group = "MACD FILTER SETTINGS")
slow_length = input(title="Slow Length", defval=100,group = "MACD FILTER SETTINGS")
src_macd = input(title="Source", defval=close,group = "MACD FILTER SETTINGS")
signal_length = input.int(title="Signal Smoothing",  minval = 1, maxval = 50, defval = 9,group = "MACD FILTER SETTINGS")
sma_source = input.string(title="Oscillator MA Type",  defval="EMA", options=["SMA", "EMA"],group = "MACD FILTER SETTINGS")
sma_signal = input.string(title="Signal Line MA Type", defval="EMA", options=["SMA", "EMA"],group = "MACD FILTER SETTINGS")

// Calculating
fast_ma = sma_source == "SMA" ? ta.sma(src_macd, fast_length) : ta.ema(src_macd, fast_length)
slow_ma = sma_source == "SMA" ? ta.sma(src_macd, slow_length) : ta.ema(src_macd, slow_length)
macd = fast_ma - slow_ma
signal = sma_signal == "SMA" ? ta.sma(macd, signal_length) : ta.ema(macd, signal_length)
hist = macd - signal

//tpsl
takeprofit=input.float(defval=0.3,title="Enter The Take Profit %",group="TP/SL CONDITION INPUTS HERE")/100
stoploss=input.float(defval=0.16,title="Enter The Stop %",group="TP/SL CONDITION INPUTS HERE")/100
tp = strategy.opentrades.entry_price(0)*takeprofit/syminfo.mintick
sl = strategy.opentrades.entry_price(0)*stoploss/syminfo.mintick

lg_rule = buysignal and hist > 0 and close > ema_fil
sh_rule = sellsignal and hist < 0 and close < ema_fil

// Plot Bull/Bear

plotshape(lg_rule, title='Bull', text='Bull', style=shape.triangleup, location=location.belowbar, color=color.new(color.green, 0), textcolor=color.new(color.black, 0), size=size.tiny)
plotshape(sh_rule, title='Bear', text='Bear', style=shape.triangledown, location=location.abovebar, color=color.new(color.red, 0), textcolor=color.new(color.black, 0), size=size.tiny)

//alert
lg_entryal = input("Long entry","Long entry alert",group = "ALERT MESSAGE SETTINGS")
sh_entryal = input("Short entry","Short entry alert",group = "ALERT MESSAGE SETTINGS")

if lg_rule and time_cond and barstate.isconfirmed
    strategy.entry("LONG",strategy.long)
    alert(lg_entryal,alert.freq_once_per_bar_close)
if strategy.position_size > 0
    strategy.exit("LONG EX","LONG",loss = sl,profit = tp,comment_loss = "LONG SL",comment_profit = "LONG TP")

if sh_rule and time_cond and barstate.isconfirmed
    strategy.entry("SHORT",strategy.short)
    alert(sh_entryal,alert.freq_once_per_bar_close)

if strategy.position_size < 0
    strategy.exit("SHORT EX","SHORT",loss = sl,profit = tp,comment_loss = "SHORT SL",comment_profit = "SHORT TP")

//end