Một chiến lược giao dịch định lượng sử dụng nhiều chỉ báo kỹ thuật
Tổng quan
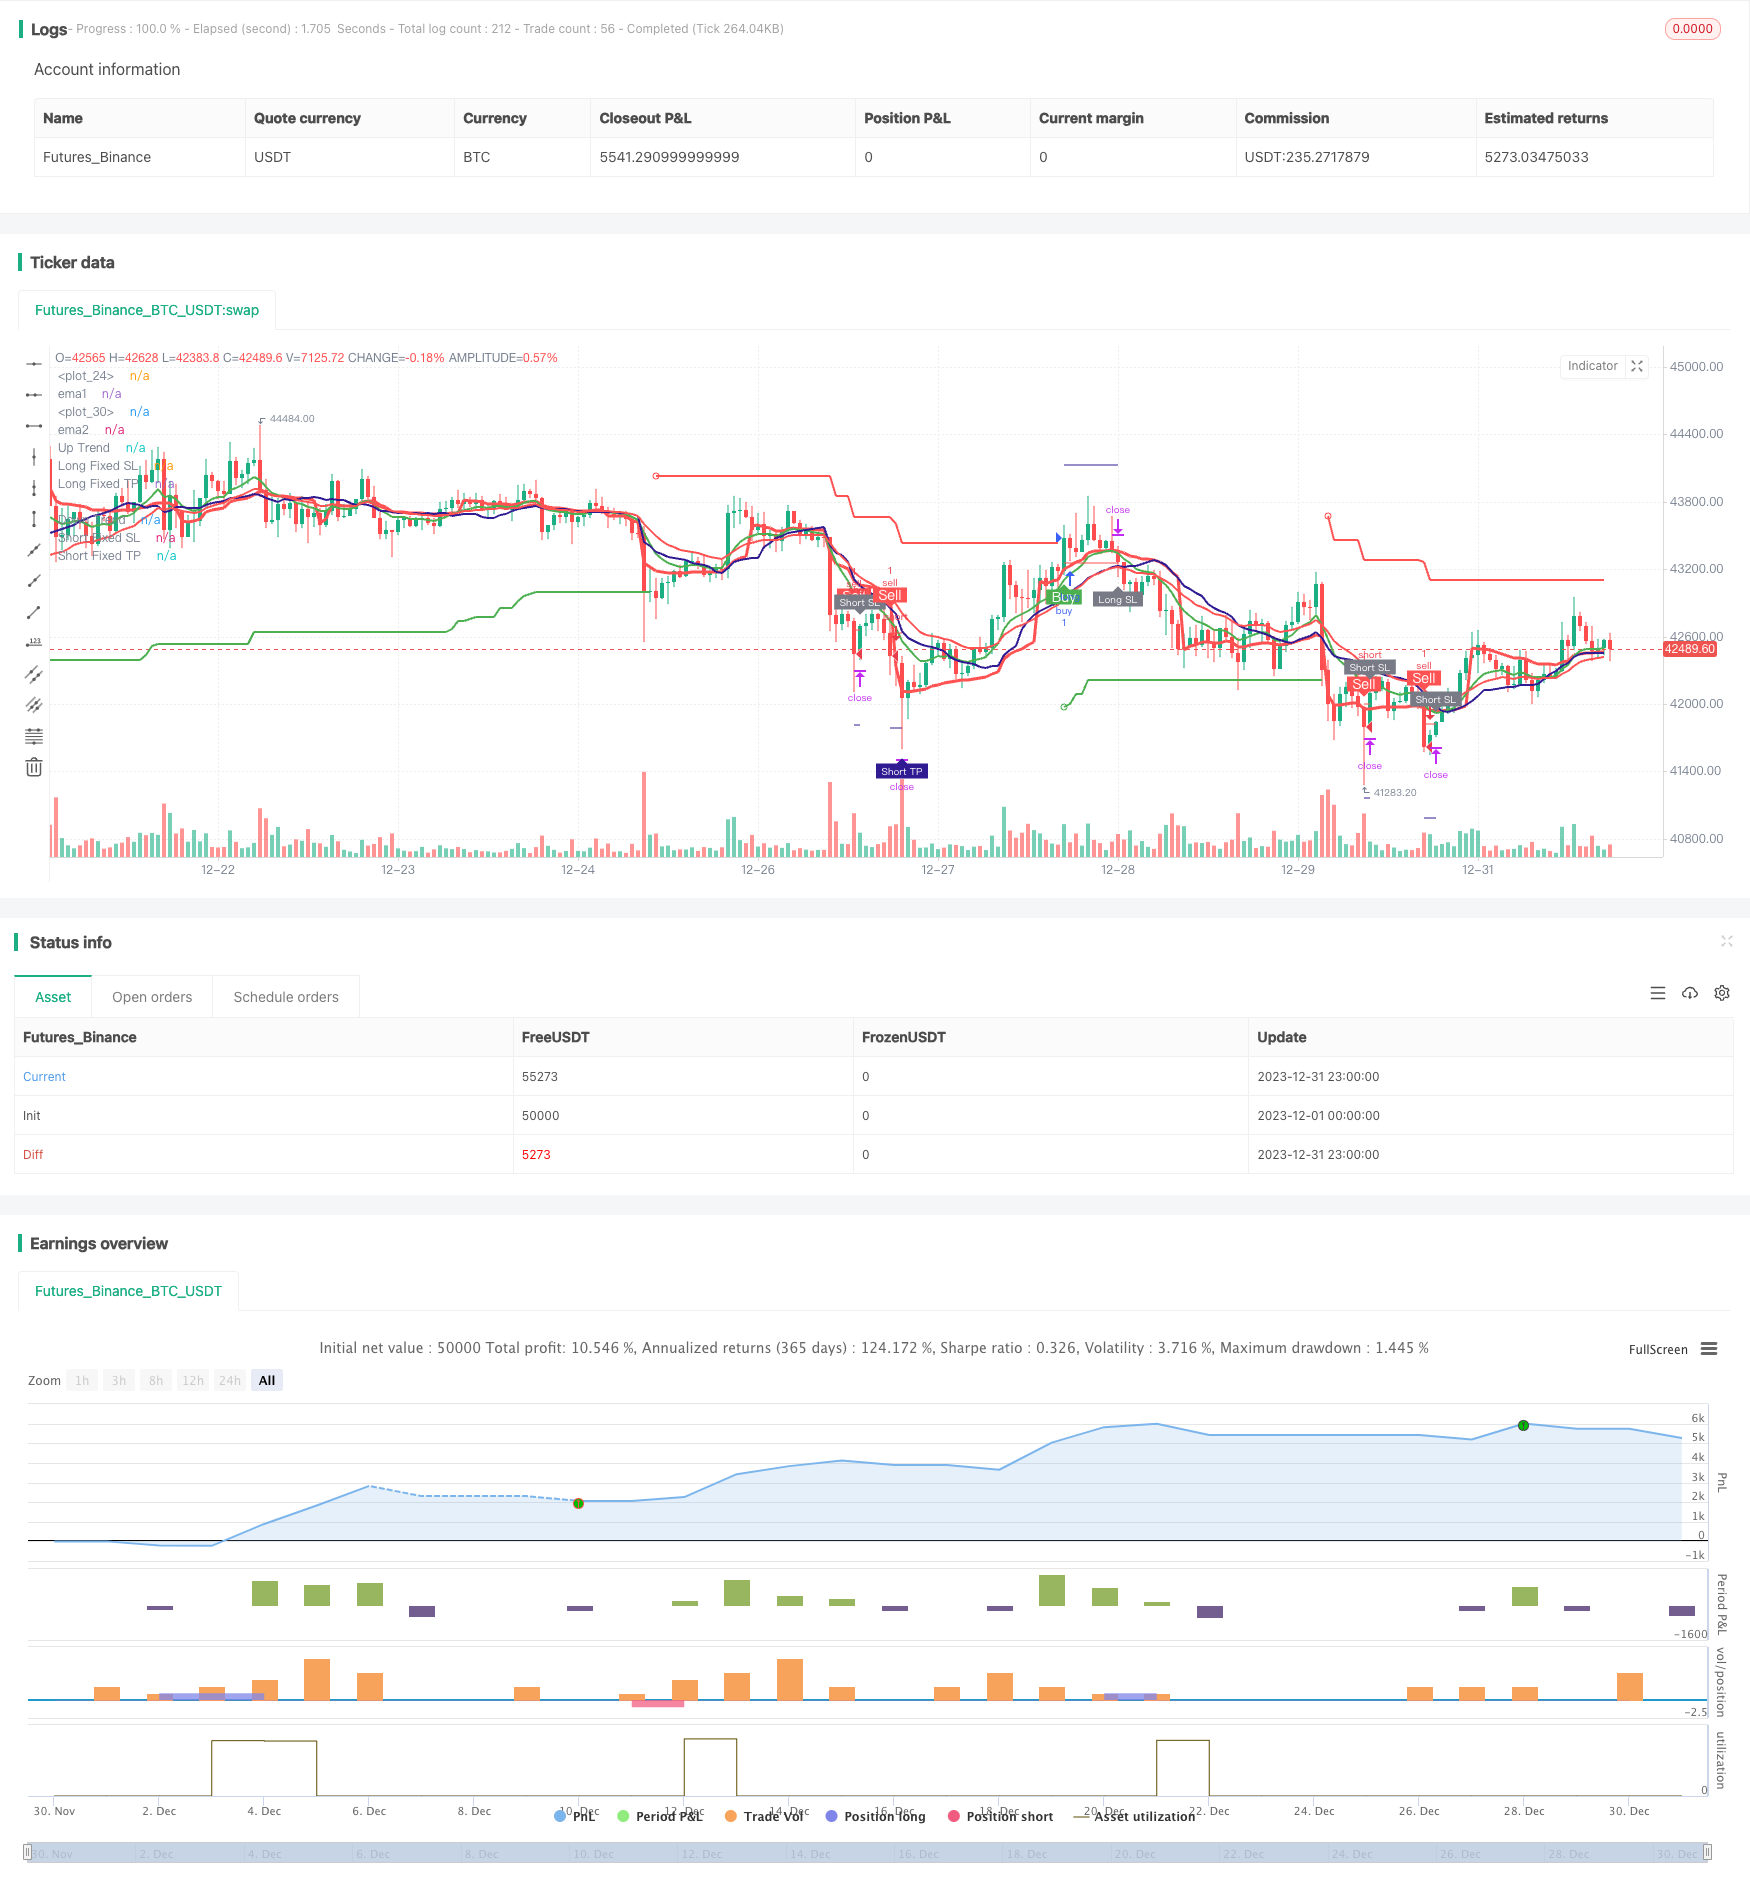
Chiến lược này là một chiến lược sử dụng nhiều chỉ số kỹ thuật để định lượng giao dịch. Chủ yếu sử dụng các chỉ số EMA, SuperTrend, RSI và MACD để tạo ra tín hiệu giao dịch.
Nguyên tắc chiến lược
Lập luận giao dịch cốt lõi của chiến lược này dựa trên các yếu tố sau:
EMA trung bình: tính toán đường nhanh EMA1 và đường chậm EMA2, tạo ra tín hiệu mua khi đường nhanh đi qua đường chậm và tạo ra tín hiệu bán khi đường nhanh đi qua đường chậm.
Đường trung bình VWMA: Xây dựng đường trung bình VWMA, xem xét khi vượt qua đường trung bình trên giá đóng cửa là tín hiệu mua, khi vượt qua đường trung bình dưới đây là tín hiệu bán.
Chỉ số SuperTrend: tính toán đường đua của SuperTrend dựa trên ATR và tham số nhân và xác định hướng của xu hướng. Tạo tín hiệu mua trong xu hướng tăng và tạo tín hiệu bán trong xu hướng giảm.
Chỉ số RSI: Xác định chỉ số RSI, RSI được coi là tín hiệu bán khi nó vượt quá đường mua và RSI được coi là tín hiệu mua khi nó thấp hơn vùng mua.
Chỉ số MACD: Tính toán đường nhanh, đường chậm và đường tín hiệu của MACD, tạo ra tín hiệu mua khi đi qua đường tín hiệu trên đường nhanh, tạo ra tín hiệu bán khi đi qua đường tín hiệu dưới đường nhanh.
Sau khi nhận được tín hiệu giao dịch của nhiều chỉ số trên, chiến lược sử dụng logic AND để phán đoán, tức là nhiều chỉ số phát ra tín hiệu mua và bán cuối cùng khi phát ra tín hiệu cùng một lúc.
Lợi thế chiến lược
Chiến lược này kết hợp nhiều chỉ số để đánh giá thị trường và có thể làm giảm hiệu quả các tín hiệu giả. Những lợi thế chính bao gồm:
Sử dụng nhiều chỉ số để lọc tổng hợp, bạn có thể giảm tín hiệu sai do chỉ số đơn lẻ.
Kết hợp chỉ số xu hướng và chỉ số biến động, bạn có thể kiếm thêm lợi nhuận trong tình huống xu hướng.
Sử dụng logic dừng lỗ hoàn hảo, bạn có thể kiểm soát hiệu quả tổn thất tối đa của một giao dịch.
Lập luận đúp cược cho phép bạn có thể lấy lại cơ hội này bằng cách đặt cược thêm sau khi thua lỗ.
Rủi ro chiến lược
Chiến lược này có những rủi ro:
Một danh mục đa chỉ số có thể quá bảo thủ và bỏ lỡ một số cơ hội giao dịch. Các danh mục chỉ số có thể được đơn giản hóa thích hợp.
Lập luận gia tăng thế chấp có thể dẫn đến sự gia tăng thua lỗ.
Đặt vị trí dừng không đúng có thể dẫn đến dừng không cần thiết. Đặt vị trí dừng thích ứng phải được tùy chỉnh.
Thiết lập tham số chỉ số không đúng có thể dẫn đến quá nhiều tín hiệu sai. Các tham số nên được tối ưu hóa để có được sự kết hợp tham số tốt nhất.
Hướng tối ưu hóa chiến lược
Chiến lược này có thể được tối ưu hóa hơn nữa ở những khía cạnh sau:
Đánh giá hiệu quả của các chỉ số kết hợp các tham số khác nhau, chọn trọng số cho các chỉ số.
Kiểm tra các thiết lập tham số chỉ số khác nhau.
Thêm logic tự điều chỉnh để ngăn chặn thiệt hại.
Tham gia cơ chế quản lý vị thế động.
Sử dụng phương pháp học máy để tối ưu hóa tham số và mô hình.
Tóm tắt
Chiến lược này tổng thể là một chiến lược giao dịch định lượng rất thực tế. Nó kết hợp các lợi thế của nhiều chỉ số kỹ thuật cổ điển để đưa ra phán đoán thị trường hiệu quả. Bằng cách tối ưu hóa tham số và lặp lại mô hình, chiến lược này có thể đạt được hiệu quả giao dịch tốt hơn.
/*backtest
start: 2023-12-01 00:00:00
end: 2023-12-31 23:59:59
period: 1h
basePeriod: 15m
exchanges: [{"eid":"Futures_Binance","currency":"BTC_USDT"}]
*/


//@version=5
strategy(title='Pinku Buy', overlay=true)

fromMonth = input.int(defval=1, title='From Month', minval=1, maxval=12)
fromDay = input.int(defval=1, title='From Day', minval=1, maxval=31)
fromYear = input.int(defval=2021, title='From Year', minval=1970)
thruMonth = input.int(defval=1, title='Thru Month', minval=1, maxval=12)
thruDay = input.int(defval=1, title='Thru Day', minval=1, maxval=31)
thruYear = input.int(defval=2112, title='Thru Year', minval=1970)

showDate = input(defval=true, title='Show Date Range')

start = timestamp(fromYear, fromMonth, fromDay, 00, 00)
finish = timestamp(thruYear, thruMonth, thruDay, 23, 59)
window() => true
// ema crossover
length1 = input.int(10)
length2 = input.int(20)
ema1 = ta.ema(close , length1)
ema2 = ta.ema(close , length2)
//vwap
VWAP = ta.vwap(hlc3)
plot(VWAP, color=color.new(color.red, 0), linewidth=3)
buy_1 = close > VWAP
sell_1 = close < VWAP
//vwma
len = input.int(20, 'VWMA_len', minval=1)
ma = ta.vwma(close, len)
plot(ma, color=color.new(color.navy, 0), linewidth=2)
buy_2 = close > ma
sell_2 = close < ma
//super trend
//inputs
Periods = input(title='STR Period', defval=22)
Source = input(hl2, title='Source')
Multiplier = input.float(title='STR Multiplier', step=0.1, defval=5.0)


//Compute ATR Levels
atr = ta.atr(Periods)


//Creating Upper Channel

up = Source - Multiplier * atr
up1 = nz(up[1], up)
up := close[1] > up1 ? math.max(up, up1) : up

//Creating Down Channel
dn = Source + Multiplier * atr
dn1 = nz(dn[1], dn)
dn := close[1] < dn1 ? math.min(dn, dn1) : dn


//Compute the Trend Stream +1/-1
trend = 1
trend := nz(trend[1], trend)
trend := trend == -1 and close > dn1 ? 1 : trend == 1 and close < up1 ? -1 : trend

//Create Stoploss for Longs
upPlot = plot(trend == 1 ? up : na, title='Up Trend', style=plot.style_linebr, linewidth=2, color=color.new(color.green, 0))
//buy_a = close > upPlot
//Buy Signal
buy_3 = trend == 1 and trend[1] == -1

plotshape(buy_3 ? up : na, title='Go Long', location=location.absolute, style=shape.circle, size=size.tiny, color=color.new(color.green, 0))

dnPlot = plot(trend == 1 ? na : dn, title='Down Trend', style=plot.style_linebr, linewidth=2, color=color.new(color.red, 0))
//sell_a = close < dnPlot
//Sell Signal
sell_3 = trend == -1 and trend[1] == 1

plotshape(sell_3 ? dn : na, title='Go Short', location=location.absolute, style=shape.circle, size=size.tiny, color=color.new(color.red, 0))
// //paraboloic sar
// start = input(0.02)
// increment = input(0.02)
// maximum = input(0.2, 'Max Value')
// out = ta.sar(start, increment, maximum)


buy_4 = ema1 > ema2
//buy_4 = buy1 and not buy1[1]
//plotshape(buy_4 , color = color.green , text = "Buy" , location = location.belowbar , textcolor = color.white , style = shape.labelup , size = size.small)
sell_4 = close < ema2
//sell_4 = sell1 and not sell1[1]
//plotshape(sell_4, color = color.red , text = "Sell" , location = location.abovebar , textcolor = color.white , style = shape.labeldown , size = size.small)
plot(ema1, 'ema1', color=color.new(color.green, 0), linewidth=2)
plot(ema2, 'ema2', color=color.new(color.red, 0), linewidth=2)

// rsi
lenr = input(14, title='Rsi Period')
rs = ta.rsi(close, lenr)

over_sold = input(44)
over_bought = input(56)

buy_5 = rs > over_bought
sell_5 = rs < over_sold
// macd
slow_len_macd = input.int(12)
fast_len_macd = input.int(26)
signal_len_macd = input.int(9)

ema3 = ta.ema(close , slow_len_macd)
ema4 = ta.ema(close , fast_len_macd)
ema5 = ta.ema(close , signal_len_macd)

buy_6 = ema5 > ema4
sell_6 = ema5 < ema4

// adx
adxlen = input(14, title="ADX Smoothing")
dilen = input(14, title="DI Length")
dirmov(len) =>
	up = ta.change(high)
	down = -ta.change(low)
	plusDM = na(up) ? na : (up > down and up > 0 ? up : 0)
	minusDM = na(down) ? na : (down > up and down > 0 ? down : 0)
	truerange = ta.rma(ta.tr, len)
	plus = fixnan(100 * ta.rma(plusDM, len) / truerange)
	minus = fixnan(100 * ta.rma(minusDM, len) / truerange)
	[plus, minus]
adx(dilen, adxlen) =>
	[plus, minus] = dirmov(dilen)
	sum = plus + minus
	adx = 100 * ta.rma(math.abs(plus - minus) / (sum == 0 ? 1 : sum), adxlen)
sig = adx(dilen, adxlen)
//plot(sig, color=color.red, title="ADX")
adx_Greater_than = input.int(25)

signal = sig > adx_Greater_than
// volume ema
volume_ema = input.int(10)

vema = ta.ema(volume,volume_ema)

signal_2 = volume > vema


//define buy sell
g = buy_1 and buy_2 and buy_4 and trend == 1 and buy_5 and buy_6 and signal and signal_2 and window()
r = sell_1 and sell_2 and sell_4 and trend == -1 and sell_5 and sell_6 and signal and signal_2 and window()

rg = 0
rg := r ? 1 : g ? 2 : nz(rg[1])

buy11 = 0
buy11 := r ? 0 : g ? 1 : nz(buy11[1])
sell11 = 0
sell11 := r ? 1 : g ? 0 : nz(sell11[1])

buy = buy11 and not buy11[1]
sell = sell11 and not sell11[1]
multiple_signals = input(true)

if multiple_signals
    buy := g and not g[1] and  window()
    sell := r and not r[1] and  window()
    sell
else
    buy := buy and window()
    sell := sell and window()
    sell


//plotshape(long  , color = color.green , text = "Buy" , location = location.belowbar , textcolor = color.white , style = shape.labelup , size = size.small)
//plotshape(short   , color = color.red , text = "Sell" , location = location.abovebar , textcolor = color.white , style = shape.labeldown , size = size.small)
Stop = input(0.5, title='StopLoss') / 100

ProfitPerc = input(defval=1.5, title='Profit') / 100

rev = input(1024,title = "Reverse Limit")

Averaging_position_ = input(true , title = "Averaging position ? ")

qn = 1
qn := nz(qn[1])


long_short = 0
long_last = buy and (nz(long_short[1]) == 0 or nz(long_short[1]) == -1)
short_last = sell and (nz(long_short[1]) == 0 or nz(long_short[1]) == 1)
long_short := long_last ? 1 : short_last ? -1 : long_short[1]

long_entered = false
long_entered := long_entered[1]

short_entered = false
short_entered := short_entered[1]


longPrice = ta.valuewhen(long_last, close, 0)
shortPrice = ta.valuewhen(short_last, close, 0)


longStop = longPrice * (1 - Stop)
shortStop = shortPrice * (1 + Stop)
longTake = longPrice * (1 + ProfitPerc)
shortTake = shortPrice * (1 - ProfitPerc)
plot(long_short == 1 ? longStop : na, style=plot.style_linebr, color=color.new(color.red, 0), linewidth=1, title='Long Fixed SL')
plot(long_short == -1 ? shortStop : na, style=plot.style_linebr, color=color.new(color.red, 0), linewidth=1, title='Short Fixed SL')
plot(long_short == 1 ? longTake : na, style=plot.style_linebr, color=color.new(color.navy, 0), linewidth=1, title='Long Fixed TP')


plot(long_short == -1 ? shortTake : na, style=plot.style_linebr, color=color.new(color.navy, 0), linewidth=1, title='Short Fixed TP')


longBar1 = ta.barssince(long_last)
longBar2 = longBar1 >= 1 ? true : false
shortBar1 = ta.barssince(short_last)
shortBar2 = shortBar1 >= 1 ? true : false

longSLhit = long_short == 1 and longBar2 and low < longStop

if long_entered and sell
    longSLhit := true
    longSLhit

plotshape(longSLhit and not(sell and not short_entered and long_entered), style=shape.labelup, location=location.belowbar, color=color.new(color.gray, 0), size=size.tiny, title='Stop Loss', text='Long SL', textcolor=color.new(color.white, 0))
shortSLhit = long_short == -1 and shortBar2 and high > shortStop


if short_entered and buy
    shortSLhit := true
    shortSLhit

plotshape(shortSLhit and not(buy and not long_entered and short_entered), style=shape.labeldown, location=location.abovebar, color=color.new(color.gray, 0), size=size.tiny, title='Stop Loss', text='Short SL', textcolor=color.new(color.white, 0))


longTPhit = long_short == 1 and longBar2 and high > longTake
plotshape(longTPhit, style=shape.labeldown, location=location.abovebar, color=color.new(color.navy, 0), size=size.tiny, title='Target', text='Long TP', textcolor=color.new(color.white, 0))
shortTPhit = long_short == -1 and shortBar2 and low < shortTake
plotshape(shortTPhit, style=shape.labelup, location=location.belowbar, color=color.new(color.navy, 0), size=size.tiny, title='Target', text='Short TP', textcolor=color.new(color.white, 0))

long_short := (long_short == 1 or long_short == 0) and longBar2 and (longSLhit or longTPhit) ? 0 : (long_short == -1 or long_short == 0) and shortBar2 and (shortSLhit or shortTPhit) ? 0 : long_short

if(shortSLhit or longSLhit or (long_entered[1] and sell) or (short_entered[1] and buy ))
    qn := qn*2

if(longTPhit or shortTPhit or qn > rev)
    qn := 1

if Averaging_position_
    qn := 1

plotshape(buy and not long_entered, color=color.new(color.green, 0), style=shape.labelup, text='Buy', textcolor=color.new(color.white, 0), location=location.belowbar)
plotshape(sell and not short_entered, color=color.new(color.red, 0), style=shape.labeldown, text='Sell', textcolor=color.new(color.white, 0), location=location.abovebar)


// plotshape(buy and not(long_entered) and (short_entered), color = color.green , style = shape.labelup , text = "FA Buy" , textcolor = color.white , location = location.belowbar)
// plotshape(sell and not(short_entered)  and (long_entered), color = color.red , style = shape.labeldown , text = "FA Sell" , textcolor = color.white , location = location.abovebar)


// alertcondition(condition=buy and  not(long_entered)  and (short_entered), title="Fully Algo Buy")
// alertcondition(condition=sell and  not(short_entered)  and (long_entered), title="Fully Algo sell")

alertcondition(condition=buy and not long_entered, title='Buy')
alertcondition(condition=sell and not short_entered, title='Sell')

if long_last
    long_entered := true
    short_entered := false
    short_entered
if short_last
    short_entered := true
    long_entered := false
    long_entered

alertcondition(condition=longSLhit and not(sell and not short_entered and long_entered), title='Long SL')
alertcondition(condition=shortSLhit and not(buy and not long_entered and short_entered), title='Short SL')

alertcondition(condition=longTPhit, title='Long TP')
alertcondition(condition=shortTPhit, title='Short TP')

if longSLhit or longTPhit
    long_entered := false
    long_entered

if shortSLhit or shortTPhit
    short_entered := false
    short_entered

// if buy
//     strategy.entry('buy', strategy.long)
//     strategy.exit('exit', 'buy', limit=longTake, stop=longStop)


// if sell
//     strategy.entry('sell', strategy.short)
//     strategy.exit('exit', 'sell', limit=shortTake, stop=shortStop)
if(buy)
    strategy.entry("buy",strategy.long,qty = qn)
    strategy.exit("Stop","buy",limit = longTake,stop = longStop)

if(sell)
    strategy.entry("sell",strategy.short,qty = qn)
    strategy.exit("Stop","sell",limit = shortTake,stop = shortStop)

strategy.close("buy",when =  longTPhit or sell or longSLhit, comment = "Target")
strategy.close("sell",when =  shortSLhit or shortTPhit or buy , comment = "Stop Loss")

strategy.cancel("buy",when =  longTPhit or sell or longSLhit)
strategy.cancel("sell",when =  shortSLhit or shortTPhit or buy )