Chiến lược định lượng theo xu hướng dựa trên Wave Trend và VWMA
Tổng quan
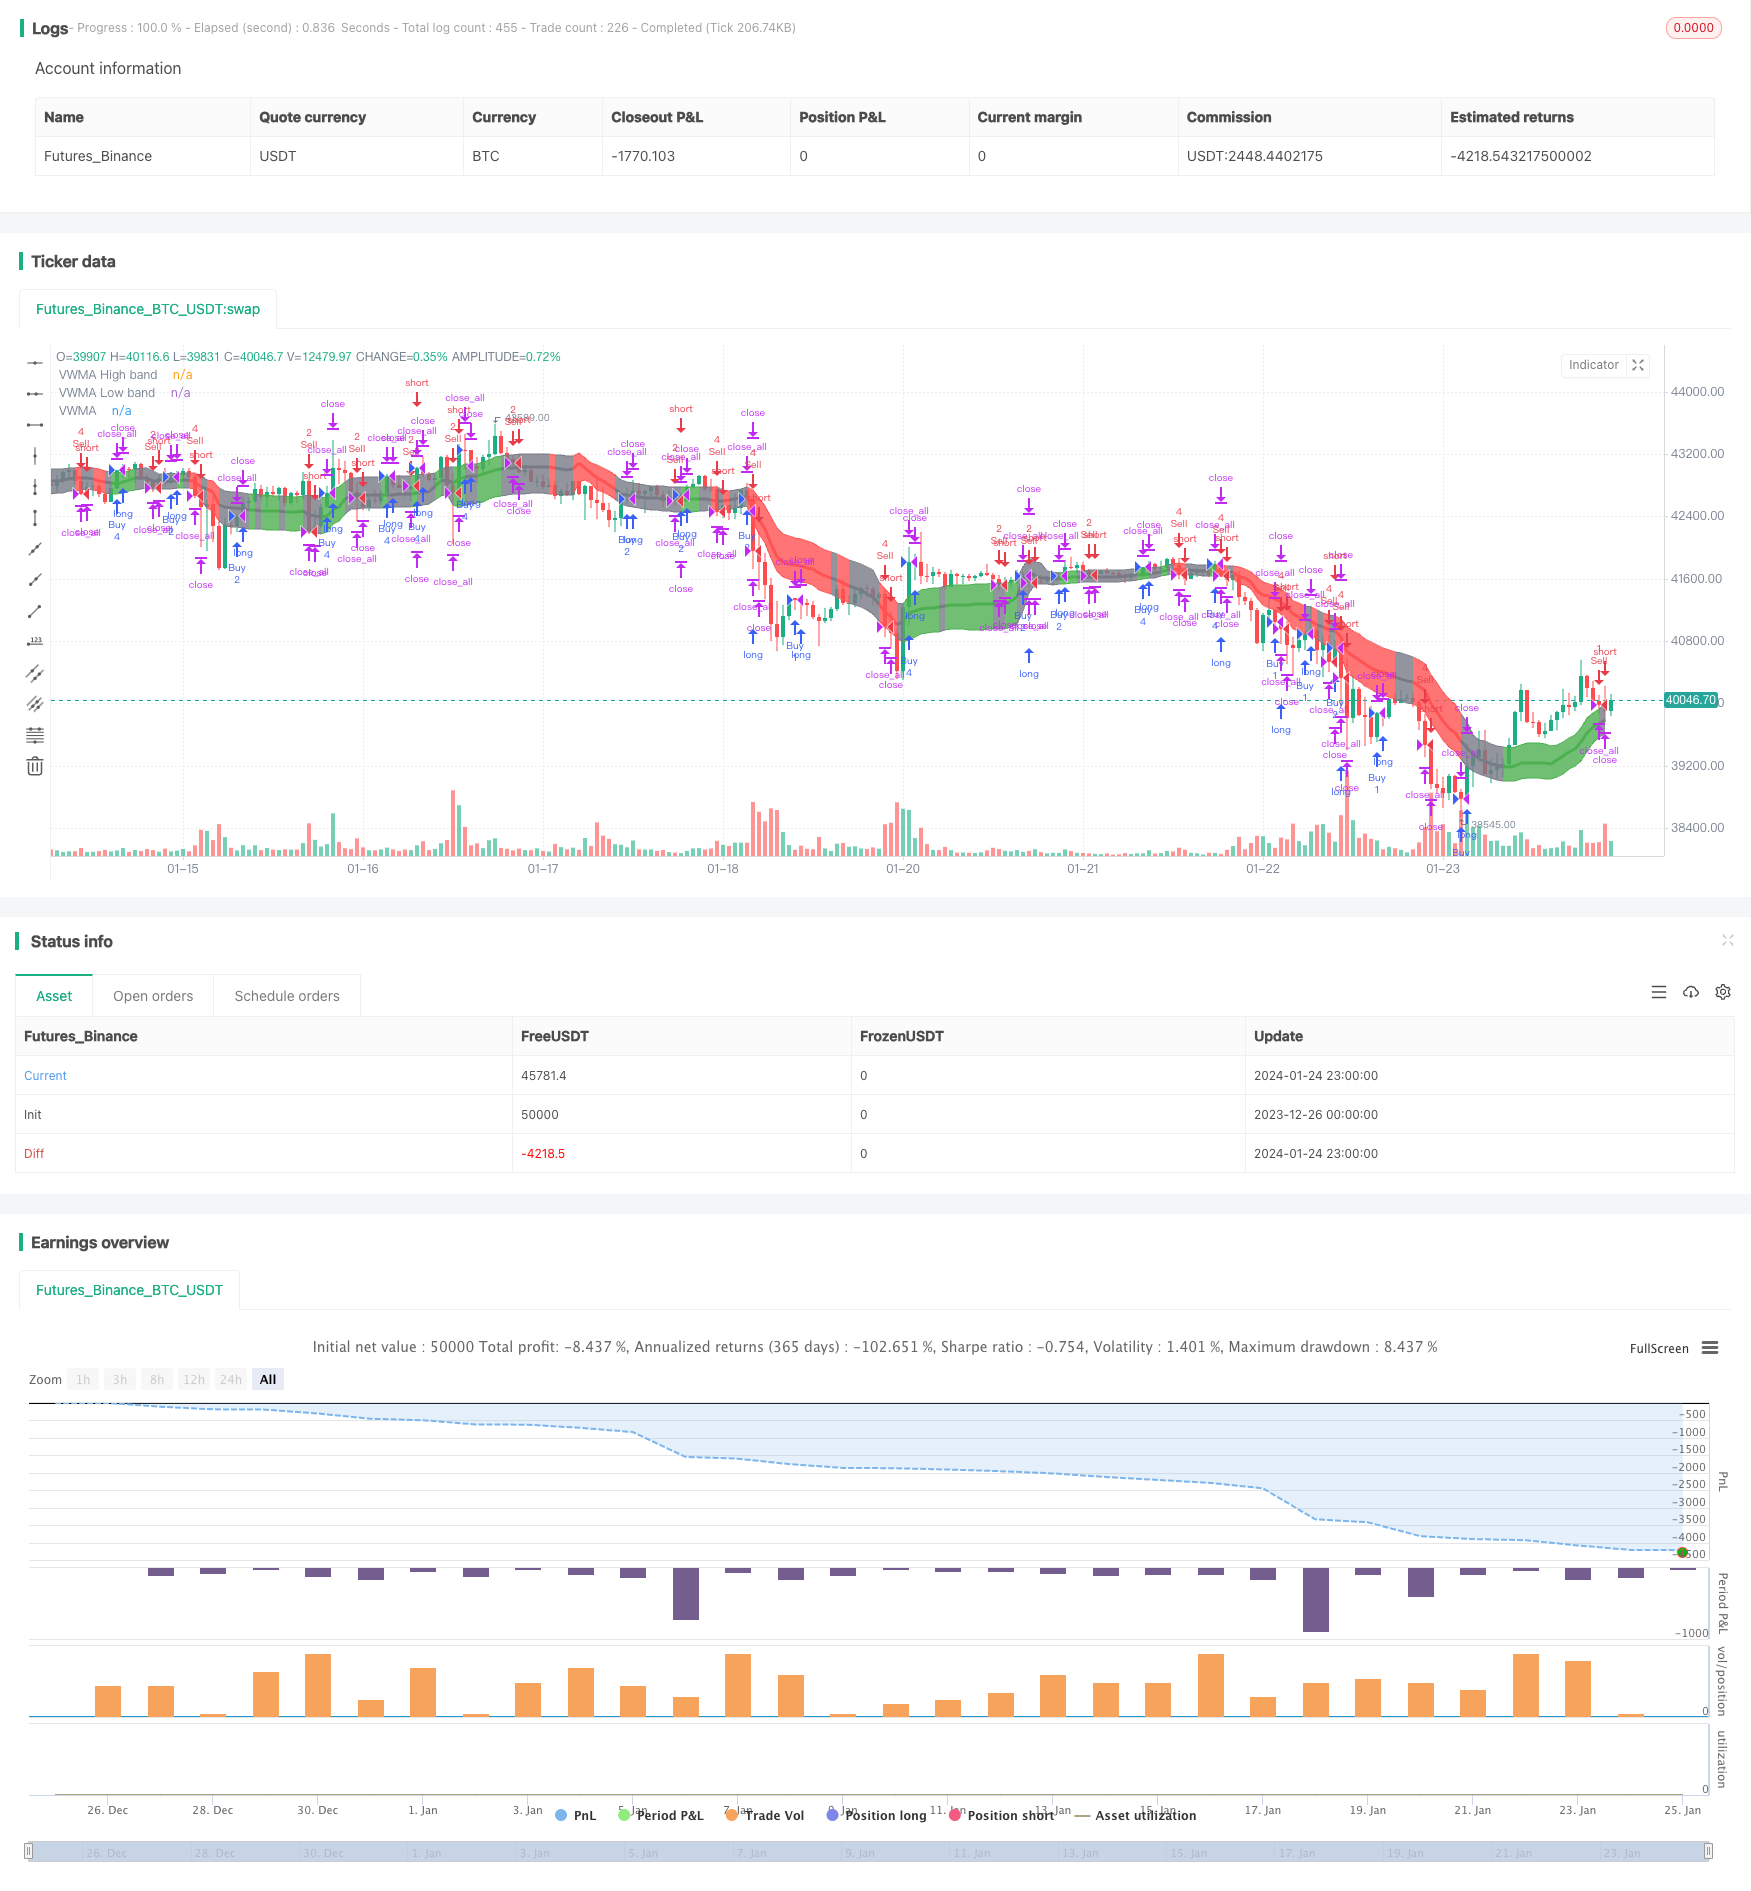
Chiến lược này kết hợp với dao động xu hướng sóng và chỉ số VWMA để thực hiện một chiến lược giao dịch định lượng theo dõi xu hướng. Chiến lược này có thể xác định xu hướng thị trường và mua hoặc bán dựa trên tín hiệu của dao động xu hướng sóng. Ngoài ra, kích thước giao dịch được xác định dựa trên tín hiệu của chỉ số VWMA.
Nguyên tắc chiến lược
Chiến lược này dựa trên hai chỉ số sau:
Wave Trend Oscillator: Đây là một chỉ số được đưa vào TradingView bởi LazyBear, có thể xác định các đợt sóng lốc của biến động giá và tạo ra tín hiệu mua / bán. Cách tính toán cụ thể là: tính trung bình giá ap, sau đó tính EMA của ap (được gọi là esa), sau đó tính EMA tuyệt đối của sự khác biệt giữa ap và esa (được gọi là d), và cuối cùng tính chỉ số thống nhất ci = ap-esa) / 0.015*d), EMA của ci là Wave Trend ((wt1), SMA 4 chu kỳ của wt1 là wt2. Khi wt1 đi qua wt2 là tín hiệu mua, khi đi qua là sell.
Chỉ số VWMA: Đây là một trung bình di chuyển có trọng lượng xem xét số lượng giao dịch. Tùy thuộc vào giá cả trong hoặc ngoài VWMABands, nó tạo ra tín hiệu + 1 (vô đầu), 0 (trung tính) hoặc - 1 (vô đầu).
Định thời gian mua và bán dựa trên tín hiệu của Wave Trend. Định số lượng giao dịch cụ thể trên mỗi giao dịch dựa trên tín hiệu đa luồng của chỉ số VWMA.
Lợi thế chiến lược
- Kết hợp các tín hiệu của hai chỉ số này giúp cải thiện tính chính xác của các quyết định
- Chỉ số VWMA dựa trên khối lượng giao dịch cho thấy sức mạnh của thị trường
- Có thể tùy chỉnh thời gian giao dịch để tránh biến động mạnh trong các sự kiện tin tức quan trọng
- Số lượng giao dịch được điều chỉnh theo tín hiệu của VWMA để giảm rủi ro giao dịch
Rủi ro chiến lược
- Chỉ số Wave Trend có thể tạo ra tín hiệu giả
- Dữ liệu giao dịch không chính xác có thể ảnh hưởng đến chỉ số VWMA
- Cần dữ liệu lịch sử dài hơn để tính toán chỉ số
- Không có chiến lược ngăn chặn thiệt hại
Hướng tối ưu hóa
- Kiểm tra các tổ hợp tham số khác nhau để tìm ra tham số tốt nhất
- Tăng chiến lược dừng lỗ
- Xem xét lọc tín hiệu kết hợp với các chỉ số khác
- Kiểm tra các thiết lập giao dịch khác nhau
- Phương pháp tính toán số lượng giao dịch điều chỉnh động
Tóm tắt
Chiến lược này tích hợp các chỉ số định hướng và năng lượng định lượng, để thực hiện một chiến lược theo dõi xu hướng tiên tiến hơn. Chiến lược này có một số lợi thế, nhưng cũng có một số rủi ro cần lưu ý. Bằng cách tối ưu hóa các tham số và quy tắc, có thể cải thiện hơn nữa sự ổn định và lợi nhuận của chiến lược.
/*backtest
start: 2023-12-26 00:00:00
end: 2024-01-25 00:00:00
period: 1h
basePeriod: 15m
exchanges: [{"eid":"Futures_Binance","currency":"BTC_USDT"}]
*/

// This source code is subject to the terms of the Mozilla Public License 2.0 at
// https://mozilla.org/MPL/2.0/
//
// Created by jadamcraig
//
// This strategy benefits from extracts taken from the following
// studies/authors.  Thank you for developing and sharing your ideas in an open
// way!
//  * Wave Trend Strategy by thomas.gigure
//  * cRSI + Waves Strategy with VWMA overlay by Dr_Roboto
//
//@version=4

//==============================================================================
//==============================================================================
overlay = true  // plots VWMA (need to close and re-add)
//overlay = false // plots Wave Trend (need to close and re-add)

strategy("Wave Trend w/ VWMA overlay", overlay=overlay)

baseQty = input(defval=1, title="Base Quantity", type=input.float, minval=1)

useSessions = input(defval=true, title="Limit Signals to Trading Sessions?")
sess1_startHour = input(defval=8, title="Session 1: Start Hour",
     type=input.integer, minval=0, maxval=23)
sess1_startMinute = input(defval=25, title="Session 1: Start Minute",
     type=input.integer, minval=0, maxval=59)
sess1_stopHour = input(defval=10, title="Session 1: Stop Hour",
     type=input.integer, minval=0, maxval=23)
sess1_stopMinute = input(defval=25, title="Session 1: Stop Minute",
     type=input.integer, minval=0, maxval=59)
sess2_startHour = input(defval=12, title="Session 2: Start Hour",
     type=input.integer, minval=0, maxval=23)
sess2_startMinute = input(defval=55, title="Session 2: Start Minute",
     type=input.integer, minval=0, maxval=59)
sess2_stopHour = input(defval=14, title="Session 2: Stop Hour",
     type=input.integer, minval=0, maxval=23)
sess2_stopMinute = input(defval=55, title="Session 2: Stop Minute",
     type=input.integer, minval=0, maxval=59)
sess1_closeAll = input(defval=false, title="Close All at End of Session 1")
sess2_closeAll = input(defval=true, title="Close All at End of Session 2")

//==============================================================================
//==============================================================================
//                    Volume Weighted Moving Average (VWMA)
//==============================================================================
//==============================================================================
plotVWMA = overlay

// check if volume is available for this equity
useVolume = input(
     title="VWMA: Use Volume (uncheck if equity does not have volume)",
     defval=true)

vwmaLen = input(defval=21, title="VWMA: Length", type=input.integer, minval=1,
     maxval=200)
vwma = vwma(close, vwmaLen)
vwma_high = vwma(high, vwmaLen)
vwma_low = vwma(low, vwmaLen)

if not(useVolume)
    vwma := wma(close, vwmaLen)
    vwma_high := wma(high, vwmaLen)
    vwma_low := wma(low, vwmaLen)

// +1 when above, -1 when below, 0 when inside
vwmaSignal(priceOpen, priceClose, vwmaHigh, vwmaLow) =>
    sig = 0
    color = color.gray
    if priceClose > vwmaHigh
        sig := 1
        color := color.green
    else if priceClose < vwmaLow
        sig := -1
        color := color.red
    else
        sig := 0
        color := color.gray
    [sig,color]

[vwma_sig, vwma_color] = vwmaSignal(open, close, vwma_high, vwma_low)

priceAboveVWMA = vwma_sig ==  1 ? true : false
priceBelowVWMA = vwma_sig == -1 ? true : false
// plot(priceAboveVWMA?2.0:0,color=color.blue)
// plot(priceBelowVWMA?2.0:0,color=color.maroon)

//bandTrans = input(defval=70, title="VWMA Band Transparancy (100 invisible)",
//     type=input.integer, minval=0, maxval=100)
//fillTrans = input(defval=70, title="VWMA Fill Transparancy (100 invisible)",
//     type=input.integer, minval=0, maxval=100)
bandTrans = 60
fillTrans = 60

// ***** Plot VWMA *****
highband = plot(plotVWMA?fixnan(vwma_high):na, title='VWMA High band',
     color = vwma_color, linewidth=1, transp=bandTrans)
lowband = plot(plotVWMA?fixnan(vwma_low):na, title='VWMA Low band',
     color = vwma_color, linewidth=1, transp=bandTrans)
fill(lowband, highband, title='VWMA Band fill', color=vwma_color,
     transp=fillTrans)
plot(plotVWMA?vwma:na, title='VWMA', color = vwma_color, linewidth=3,
     transp=bandTrans)

//==============================================================================
//==============================================================================
//                                  Wave Trend
//==============================================================================
//==============================================================================
plotWaveTrend = not(overlay)

n1 = input(10, "Wave Trend: Channel Length")
n2 = input(21, "Wave Trend: Average Length")
obLevel1 = input(60, "Wave Trend: Over Bought Level 1")
obLevel2 = input(53, "Wave Trend: Over Bought Level 2")
osLevel1 = input(-60, "Wave Trend: Over Sold Level 1")
osLevel2 = input(-53, "Wave Trend: Over Sold Level 2")

ap = hlc3
esa = ema(ap, n1)
d = ema(abs(ap - esa), n1)
ci = (ap - esa) / (0.015 * d)
tci = ema(ci, n2)

wt1 = tci
wt2 = sma(wt1,4)

plot(plotWaveTrend?0:na, color=color.gray)
plot(plotWaveTrend?obLevel1:na, color=color.red)
plot(plotWaveTrend?osLevel1:na, color=color.green)
plot(plotWaveTrend?obLevel2:na, color=color.red, style=3)
plot(plotWaveTrend?osLevel2:na, color=color.green, style=3)

plot(plotWaveTrend?wt1:na, color=color.green)
plot(plotWaveTrend?wt2:na, color=color.red, style=3)
plot(plotWaveTrend?wt1-wt2:na, color=color.blue, transp=80)

//==============================================================================
//==============================================================================
//                               Order Management
//==============================================================================
//==============================================================================
// Define Long and Short Conditions
longCondition = crossover(wt1, wt2)
shortCondition = crossunder(wt1, wt2)

// Define Quantities
orderQty = baseQty * 2
if (longCondition)
    if (vwma_sig == 1)
        if ( strategy.position_size >= (baseQty * 4 * -1) and
             strategy.position_size < 0 )
            orderQty := baseQty * 4 + abs(strategy.position_size)
        else
            orderQty := baseQty * 4
    else if (vwma_sig == 0)
        if ( strategy.position_size >= (baseQty * 2 * -1) and
             strategy.position_size < 0 )
            orderQty := baseQty * 2 + abs(strategy.position_size)
        else
            orderQty := baseQty * 2
    else if (vwma_sig == -1)
        if ( strategy.position_size >= (baseQty * 1 * -1) and
             strategy.position_size < 0 )
            orderQty := baseQty * 1 + abs(strategy.position_size)
        else
            orderQty := baseQty * 1
else if (shortCondition)
    if (vwma_sig == -1)
        if ( strategy.position_size <= (baseQty * 4) and
             strategy.position_size > 0 )
            orderQty := baseQty * 4 + strategy.position_size
        else
            orderQty := baseQty * 4
    else if (vwma_sig == 0)
        if ( strategy.position_size <= (baseQty * 2) and
             strategy.position_size > 2 )
            orderQty := baseQty * 2 + strategy.position_size
        else
            orderQty := baseQty * 2
    else if (vwma_sig == 1)
        if ( strategy.position_size <= (baseQty * 1) and
             strategy.position_size > 0 )
            orderQty := baseQty * 1 + strategy.position_size
        else
            orderQty := baseQty * 1

// Determine if new trades are permitted
newTrades = false
if (useSessions)
    if ( hour == sess1_startHour and minute >= sess1_startMinute )
        newTrades := true
    else if ( hour > sess1_startHour and hour < sess1_stopHour )
        newTrades := true
    else if ( hour == sess1_stopHour and minute < sess1_stopMinute )
        newTrades := true
    else if ( hour == sess2_startHour and minute >= sess2_startMinute )
        newTrades := true
    else if ( hour > sess2_startHour and hour < sess2_stopHour )
        newTrades := true
    else if ( hour == sess2_stopHour and minute < sess2_stopMinute )
        newTrades := true
    else
        newTrades := false
else
    newTrades := true

// Long Signals
if ( longCondition  )
    strategy.order("Buy", strategy.long, orderQty)

// Short Signals
if ( shortCondition  )
    strategy.order("Sell", strategy.short, orderQty)

// Close open position at end of Session 1, if enabled
if (sess1_closeAll )
    strategy.close_all()

// Close open position at end of Session 2, if enabled
if (sess2_closeAll  )
    strategy.close_all()