Chiến lược giao dịch theo dõi nến lưới hai chiều
Tổng quan
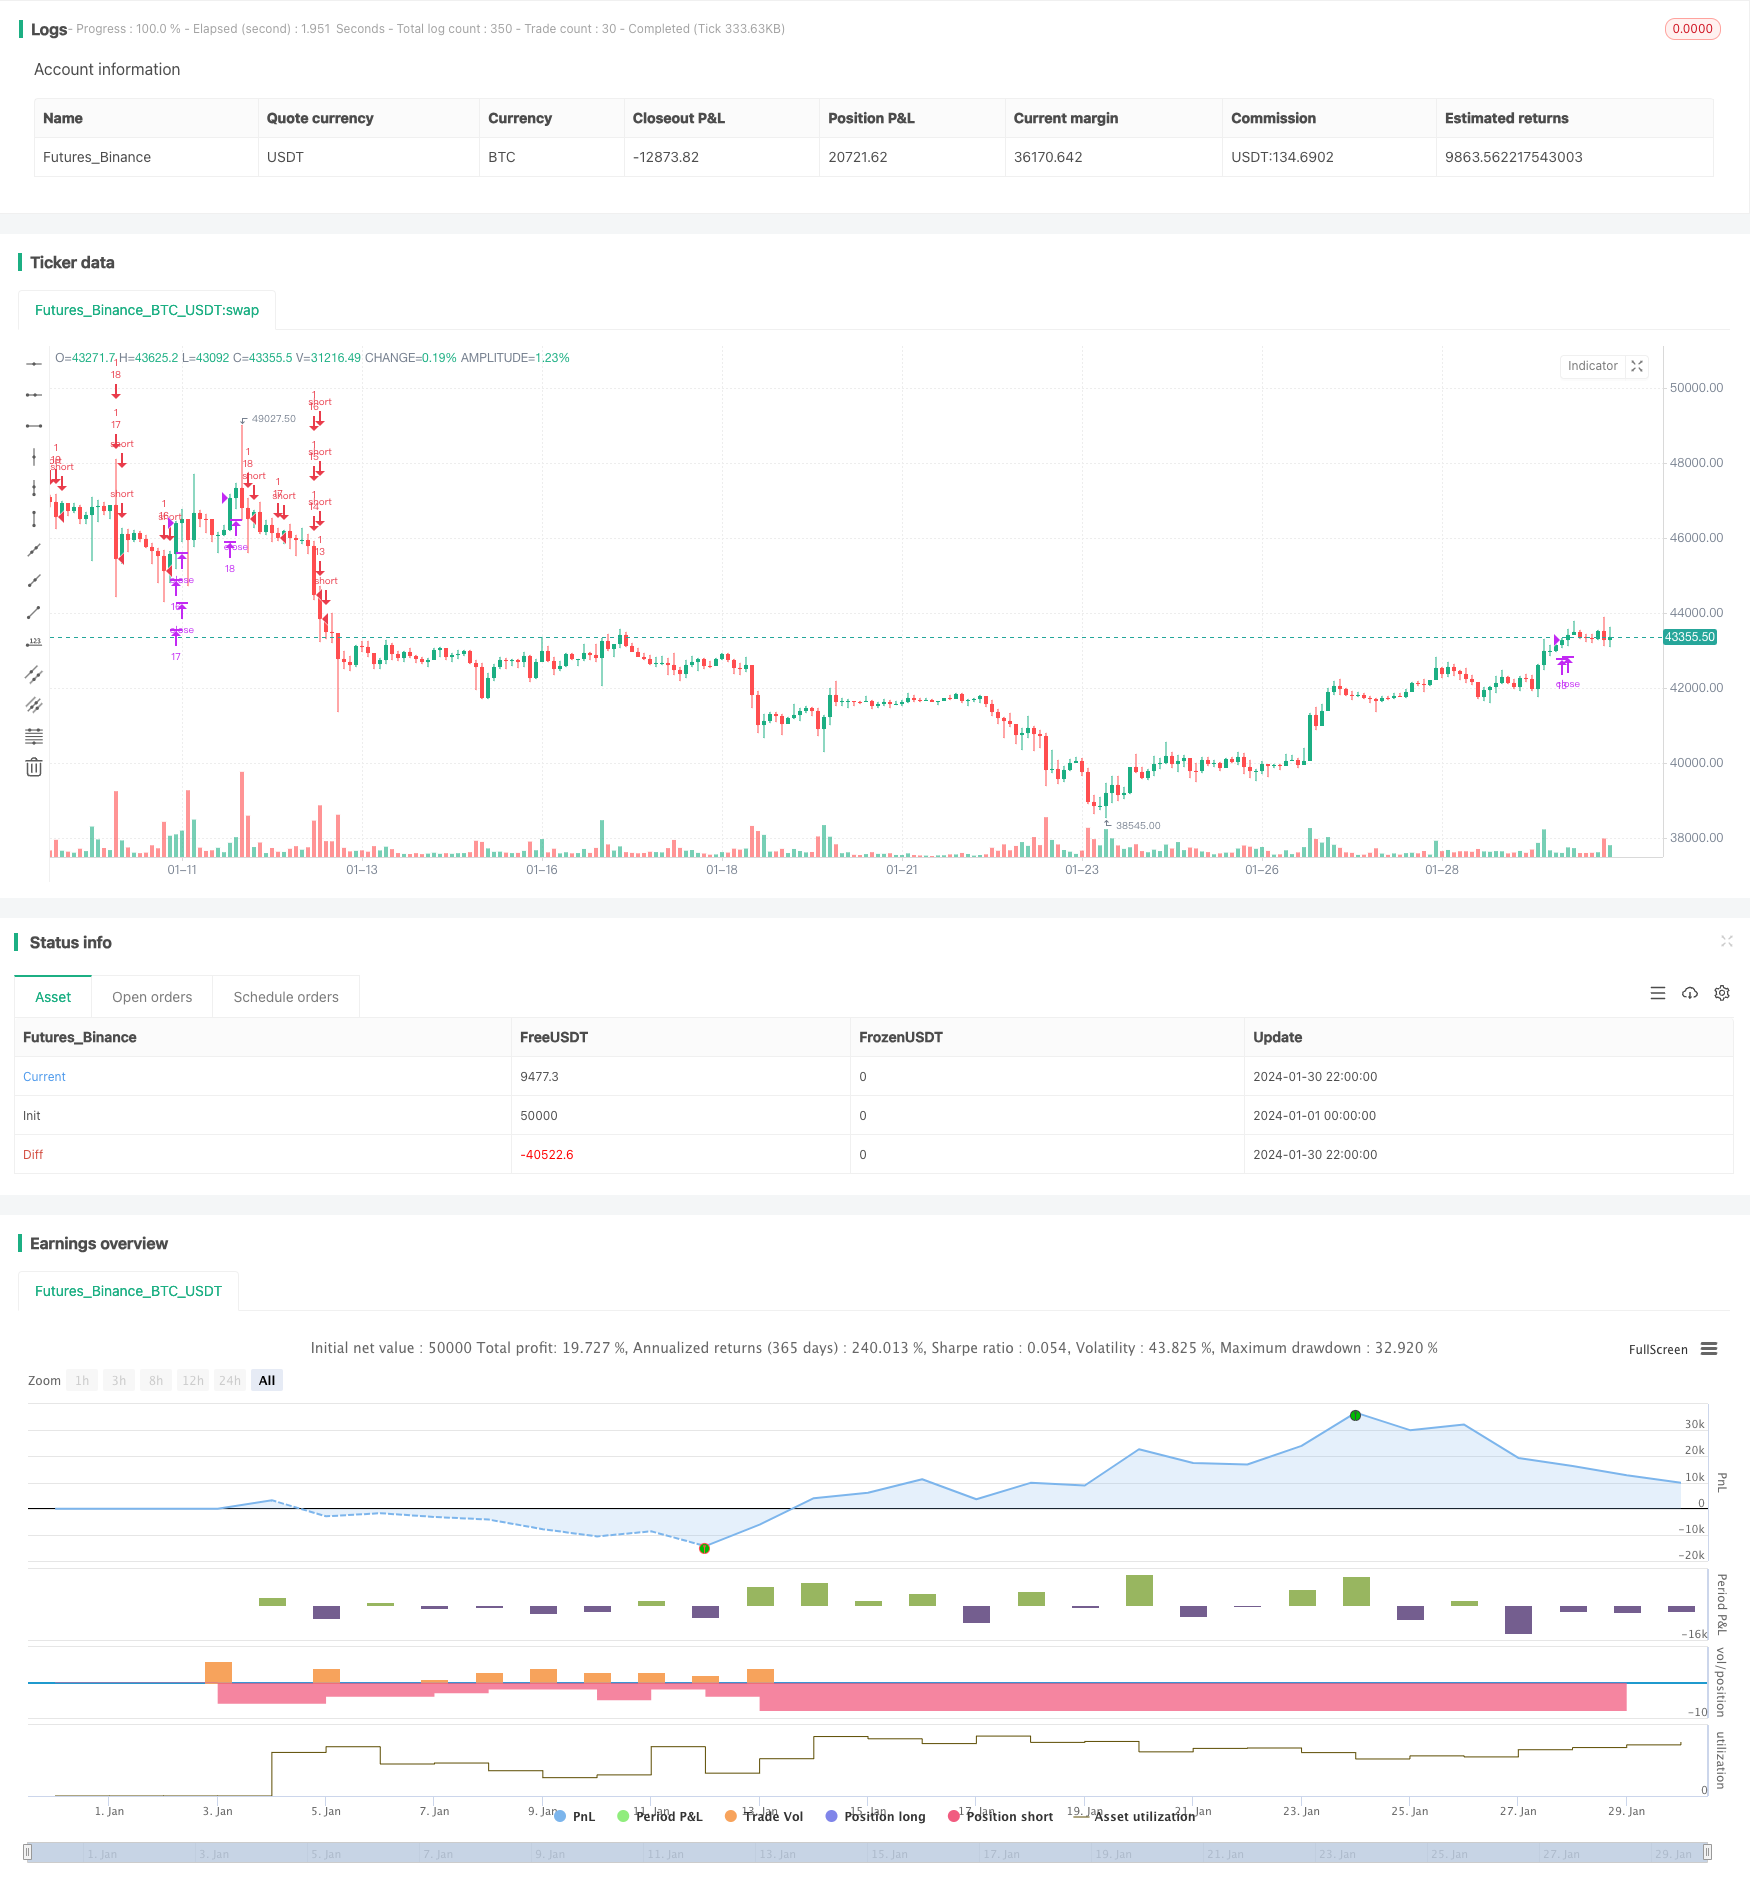
Chiến lược này là một chiến lược giao dịch lưới theo dõi hai chiều dựa trên sự thay đổi thời gian thực của đường K. Nó có thể kiếm được lợi nhuận ổn định trong cả thị trường bò và thị trường gấu.
Nguyên tắc chiến lược
Theo số lượng lưới được thiết lập bởi người dùng, giá lưới và giá mỗi lưới được tính tự động.
Khi giá vượt qua giá lưới, mở thêm vị trí theo số lượng cố định; khi giá giảm xuống giá lưới, đặt vị trí thêm vị trí và mở vị trí trống.
Do đó, khi giá dao động trong một khoảng lưới, bạn có thể kiếm lợi nhuận bằng cách theo dõi sự thay đổi giá.
Phân tích lợi thế
Tự động tính toán khoảng cách lưới hợp lý, không cần xác định sức đề kháng hỗ trợ bằng tay.
Giao dịch hai chiều, thích ứng với môi trường thị trường thay đổi.
Số lượng vị trí mở cố định có lợi cho việc kiểm soát rủi ro.
Mã được thiết kế đơn giản, dễ hiểu và dễ sửa đổi.
Phân tích rủi ro
Sự biến động mạnh mẽ của tình hình có thể dẫn đến tổn thất lớn hơn.
Việc tích lũy chi phí giao dịch cũng ảnh hưởng đến lợi nhuận cuối cùng.
Cần xác định một cách hợp lý số lượng lưới, quá nhiều lưới làm tăng số lần giao dịch nhưng lợi nhuận mỗi lần là hạn chế.
Hướng tối ưu hóa
Tham gia chiến lược dừng lỗ để tránh sự gia tăng tổn thất.
Thêm chức năng điều chỉnh động số lượng lưới.
Xem xét việc gia nhập đòn bẩy để tăng khối lượng giao dịch.
Tóm tắt
Chiến lược này có ý tưởng tổng thể rõ ràng và đơn giản, có thể đạt được lợi nhuận ổn định thông qua giao dịch lưới theo dõi hai chiều, đồng thời cũng có một số rủi ro giao dịch. Có thể đạt được hiệu quả tốt hơn bằng cách tối ưu hóa liên tục.
/*backtest
start: 2024-01-01 00:00:00
end: 2024-01-31 00:00:00
period: 2h
basePeriod: 15m
exchanges: [{"eid":"Futures_Binance","currency":"BTC_USDT"}]
*/

//@version=4

//hk4jerry

strategy("Grid Bot Backtesting", overlay=false, pyramiding=3000, close_entries_rule="ANY", default_qty_type=strategy.cash, initial_capital=100.0, currency="USD", commission_type=strategy.commission.percent, commission_value=0.025)
i_autoBounds    = input(group="Grid Bounds", title="Use Auto Bounds?", defval=true, type=input.bool)                             // calculate upper and lower bound of the grid automatically? This will theorhetically be less profitable, but will certainly require less attention
i_boundSrc      = input(group="Grid Bounds", title="(Auto) Bound Source", defval="Hi & Low", options=["Hi & Low", "Average"])     // should bounds of the auto grid be calculated from recent High & Low, or from a Simple Moving Average
i_boundLookback = input(group="Grid Bounds", title="(Auto) Bound Lookback", defval=250, type=input.integer, maxval=500, minval=0) // when calculating auto grid bounds, how far back should we look for a High & Low, or what should the length be of our sma
i_boundDev      = input(group="Grid Bounds", title="(Auto) Bound Deviation", defval=0.10, type=input.float, maxval=1, minval=-1)  // if sourcing auto bounds from High & Low, this percentage will (positive) widen or (negative) narrow the bound limits. If sourcing from Average, this is the deviation (up and down) from the sma, and CANNOT be negative.
i_upperBound    = input(group="Grid Bounds", title="(Manual) Upper Boundry(상단 가격)", defval=0.285, type=input.float)                      // for manual grid bounds only. The upperbound price of your grid
i_lowerBound    = input(group="Grid Bounds", title="(Manual) Lower Boundry(하단 가격)", defval=0.225, type=input.float)                      // for manual grid bounds only. The lowerbound price of your grid.
i_gridQty       = input(group="Grid Lines",  title="Grid Line Quantity(그리드 수)", defval=30, maxval=999, minval=1, type=input.integer)       // how many grid lines are in your grid
initial_balance = input(group="Trading option", title="Initial balance(투자금액)", defval=100, step=0.01)


start_time = input(group="Trading option",defval=timestamp('15 March 2023 06:00'), title='Start Time', type = input.time)
end_time = input(group="Trading option",defval=timestamp('31 Dec 2035 20:00'), title='End Time', type = input.time)
isAfterStartDate = true

tradingtime= (timenow - start_time)/(86400000*30)
yeartime=tradingtime/12


f_getGridBounds(_bs, _bl, _bd, _up) =>
    if _bs == "Hi & Low"
        _up ? highest(close, _bl) * (1 + _bd) : lowest(close, _bl)  * (1 - _bd)
    else
        avg = sma(close, _bl)
        _up ? avg * (1 + _bd) : avg * (1 - _bd)

f_buildGrid(_lb, _gw, _gq) =>
    gridArr = array.new_float(0)
    for i=0 to _gq-1
        array.push(gridArr, _lb+(_gw*i))
    gridArr

f_getNearGridLines(_gridArr, _price) =>
    arr = array.new_int(3)
    for i = 0 to array.size(_gridArr)-1
        if array.get(_gridArr, i) > _price
            array.set(arr, 0, i == array.size(_gridArr)-1 ? i : i+1)
            array.set(arr, 1, i == 0 ? i : i-1)
            break
    arr

var upperBound      = i_autoBounds ? f_getGridBounds(i_boundSrc, i_boundLookback, i_boundDev, true) : i_upperBound  // upperbound of our grid
var lowerBound      = i_autoBounds ? f_getGridBounds(i_boundSrc, i_boundLookback, i_boundDev, false) : i_lowerBound // lowerbound of our grid
var gridWidth       = (upperBound - lowerBound)/(i_gridQty-1)                                                       // space between lines in our grid
var gridLineArr     = f_buildGrid(lowerBound, gridWidth, i_gridQty)                                                 // an array of prices that correspond to our grid lines
var orderArr        = array.new_bool(i_gridQty, false)                                                              // a boolean array that indicates if there is an open order corresponding to each grid line

var closeLineArr    = f_getNearGridLines(gridLineArr, close)                                                        // for plotting purposes - an array of 2 indices that correspond to grid lines near price
var nearTopGridLine = array.get(closeLineArr, 0)                                                                    // for plotting purposes - the index (in our grid line array) of the closest grid line above current price
var nearBotGridLine = array.get(closeLineArr, 1)                                                                    // for plotting purposes - the index (in our grid line array) of the closest grid line below current price
if isAfterStartDate
    for i = 0 to (array.size(gridLineArr) - 1)
        if close < array.get(gridLineArr, i) and not array.get(orderArr, i) and i < (array.size(gridLineArr) - 1)
            buyId = i
            array.set(orderArr, buyId, true)
            strategy.entry(id=tostring(buyId), long=true, qty=(initial_balance/(i_gridQty-1))/close, comment="#"+tostring(buyId))
        if close > array.get(gridLineArr, i) and i != 0
            if array.get(orderArr, i-1)
                sellId = i-1
                array.set(orderArr, sellId, false)
                strategy.close(id=tostring(sellId), comment="#"+tostring(sellId))

    if i_autoBounds
        upperBound  := f_getGridBounds(i_boundSrc, i_boundLookback, i_boundDev, true)
        lowerBound  := f_getGridBounds(i_boundSrc, i_boundLookback, i_boundDev, false)
        gridWidth   := (upperBound - lowerBound)/(i_gridQty-1)
        gridLineArr := f_buildGrid(lowerBound, gridWidth, i_gridQty)

    closeLineArr    := f_getNearGridLines(gridLineArr, close)
    nearTopGridLine := array.get(closeLineArr, 0)
    nearBotGridLine := array.get(closeLineArr, 1)


var table table = table.new(position.top_right,6,8, frame_color = color.rgb(255, 255, 255),frame_width = 2,border_width = 2, border_color=color.rgb(255, 255, 255))


//제목
table.cell(table,0,0,"Upper limit price :", bgcolor=color.new(color.black,0),text_color =color.white)
table.cell(table,0,1,"Lower limit price :",bgcolor=color.new(color.black,0),text_color =color.white)
table.cell(table,0,2,"Grids quantity :",bgcolor=color.new(color.black,0),text_color =color.white)
table.cell(table,0,3,"Investment :",text_color =color.white,bgcolor=color.new(color.black,0))
table.cell(table,0,4,"USDT per grid :",text_color =color.white,bgcolor=color.new(color.black,0))
//수치
table.cell(table,1,0, tostring(upperBound, '###.#####')+ "  USDT", bgcolor=color.new(#5a637e, 0),text_color =color.white)
table.cell(table,1,1, tostring(lowerBound, '###.#####')+ "  USDT", bgcolor=color.new(#5a637e, 0),text_color =color.white)
table.cell(table,1,2, tostring(i_gridQty, '###'), bgcolor=color.new(#5a637e, 0),text_color =color.white)
table.cell(table,1,3, tostring(initial_balance,'###.##')+ "  USDT", bgcolor=color.new(#5a637e, 0),text_color =color.white)
table.cell(table,1,4, tostring(initial_balance/i_gridQty,'###.##')+ "  USDT", bgcolor=color.new(#5a637e, 0),text_color =color.white)

//제목
table.cell(table,2,0,"Current position :",text_color =color.white,bgcolor=color.new(color.black,0))
table.cell(table,2,1,"Position cost price :",text_color =color.white,bgcolor=color.new(color.black,0))
table.cell(table,2,2,"Unrealized profit :",bgcolor=color.new(color.black,0),text_color =color.white)
table.cell(table,2,3,"Unrealized profit % :",bgcolor=color.new(color.black,0),text_color =color.white)
table.cell(table,2,4,"Fee :",text_color =color.white,bgcolor=color.new(color.black,0))

//수치
table.cell(table,3,0, tostring(strategy.position_size) +   syminfo.basecurrency + "\n"  + tostring(strategy.position_size*strategy.position_avg_price/1, '###.##') + "USDT" ,text_color =color.white,bgcolor=color.new(#5a637e, 0))
table.cell(table,3,1, text=strategy.position_size>0 ? tostring(strategy.position_avg_price,'###.####')+ "  USDT" : "NOT TRADING",text_color =color.white,bgcolor=color.new(#5a637e, 0))
table.cell(table,3,2, tostring(strategy.openprofit, '###.##')+ "  USDT",text_color =color.white,bgcolor=strategy.openprofit > 0 ? color.teal : color.maroon)
table.cell(table,3,3, tostring(strategy.openprofit/initial_balance*100, '###.##')+ "%",text_color =color.white,bgcolor=strategy.openprofit > 0 ? color.teal : color.maroon)
table.cell(table,3,4, "-" + tostring(strategy.position_avg_price*strategy.position_size*0.025/100,'###.##')+ "  USDT",text_color =color.white,bgcolor=color.new(#5a637e, 0))

//제목
table.cell(table,4,0,"Grid profit :",text_color =color.white,bgcolor=color.new(color.black,0))
table.cell(table,4,1,"Grid profit % :",text_color =color.white,bgcolor=color.new(color.black,0))
table.cell(table,4,2,"Net profit :", bgcolor=color.new(color.black,0),text_color =color.white)
table.cell(table,4,3,"Net profit % :",bgcolor=color.new(color.black,0),text_color =color.white)
table.cell(table,4,4,"Balance USDT :",bgcolor=color.new(color.black,0),text_color =color.white)


//수치
table.cell(table,5,0, tostring(strategy.netprofit, '###.#####')+ "USDT", text_color =color.white,bgcolor=strategy.netprofit > 0 ? color.teal : color.maroon)
table.cell(table,5,1, tostring((strategy.netprofit)/initial_balance*100/tradingtime, '####.##') + "%",text_color =color.white,bgcolor=strategy.netprofit > 0 ? color.teal : color.maroon)
table.cell(table,5,2, tostring(strategy.netprofit+strategy.openprofit, '###.##') + "  USDT",text_color =color.white,bgcolor=strategy.netprofit+strategy.openprofit > 0 ? color.teal : color.maroon)
table.cell(table,5,3, tostring((strategy.netprofit+strategy.openprofit)/initial_balance*100, '####.##') + "%",text_color =color.white,bgcolor=strategy.netprofit+strategy.openprofit > 0 ? color.teal : color.maroon)
table.cell(table,5,4, tostring(initial_balance+strategy.netprofit+strategy.openprofit, '###.##')+ "  USDT", text_color =color.white,bgcolor=color.new(#3d4d7c, 0))


// plot(strategy.initial_capital+ strategy.netprofit+strategy.openprofit, "Current Balance",color=color.rgb(81, 137, 128))
// plot(initial_balance, "Investment",color=color.rgb(81, 137, 128))