Chiến lược theo dõi dao động băng tần miễn phí
Tổng quan
Ý tưởng chính của chiến lược này là tính toán điểm dừng cho các đường dài và đường ngắn dựa trên chỉ số ATR, tạo ra tín hiệu giao dịch khi giá vượt qua các đường dừng. Nó có chức năng theo dõi xu hướng và nắm bắt xung đột.
Nguyên tắc chiến lược
Chiến lược này sử dụng ATR của chỉ số ATR của chu kỳ N nhân với một hệ số để tính toán đường dừng dài và dài hai bên. Công thức tính toán cụ thể như sau:
长线止损 = 最高价 - ATR * 系数
短线止损 = 最低价 + ATR * 系数
Khi giá tăng vượt qua đường dừng dài, hãy làm nhiều, khi giá giảm vượt qua đường dừng ngắn. Sau khi làm nhiều, hãy theo dõi sự biến động của giá để di chuyển đường dừng.
Phương pháp này sử dụng dải sóng ATR như thiết lập điểm dừng để nắm bắt xu hướng giá đầy đủ với giả định đảm bảo rủi ro dừng. Sản xuất tín hiệu khi giá có đột phá lớn hơn, có thể loại bỏ hiệu quả các đột phá giả.
Phân tích lợi thế
Ưu điểm lớn nhất của chiến lược này là có thể tự động điều chỉnh vị trí dừng lỗ, nắm bắt xu hướng giá và kiểm soát rủi ro. Các ưu điểm cụ thể như sau:
Cài đặt dừng động dựa trên chỉ số ATR, có thể điều chỉnh mức dừng lỗ theo biến động của thị trường, kiểm soát hiệu quả tổn thất đơn lẻ.
Sử dụng một cách đột phá để tạo ra tín hiệu, bạn có thể loại bỏ một phần tiếng ồn, tránh cú cú và cú cú đáy.
Điều chỉnh đường dừng theo dõi biến động giá trong thời gian thực, ngăn chặn dừng quá nhẹ và khóa thêm lợi nhuận.
Phân tích rủi ro
Chiến lược này cũng có một số rủi ro, chủ yếu tập trung vào cài đặt điểm dừng và cách thức tạo tín hiệu. Các điểm rủi ro cụ thể như sau:
Chu kỳ ATR và hệ số không phù hợp có thể dẫn đến lỗ hổng quá rộng hoặc quá hẹp.
Các tín hiệu phá vỡ có thể bỏ lỡ cơ hội đầu tiên của xu hướng.
Theo dõi dừng lỗ cuối xu hướng có thể bị chậm trễ và không thể thoát hoàn hảo.
Phản ứng chủ yếu là điều chỉnh các tham số để làm cho dừng lỗ hợp lý hơn, hoặc hỗ trợ các chỉ số khác để đánh giá xu hướng và tín hiệu.
Hướng tối ưu hóa
Chiến lược này có thể được tiếp tục tối ưu hóa trong các khía cạnh sau:
Thiết lập lớp dừng lỗ thứ hai để kiểm soát rủi ro hơn nữa.
Kết hợp với các chỉ số khác để đánh giá xu hướng, cải thiện chất lượng tín hiệu.
Thêm chiến lược dừng di động để tăng lợi nhuận khi xu hướng tiếp tục.
Tối ưu hóa chu kỳ ATR và tham số hệ số để dừng lỗ gần hơn với biến động giá thực tế.
Tóm tắt
Chiến lược này rất thực tế về tổng thể, có thể tự động điều chỉnh mức dừng để kiểm soát rủi ro hiệu quả, đồng thời có thể thu được lợi nhuận tốt thông qua theo dõi xu hướng. Chúng ta có thể tiếp tục tích hợp các phương pháp phân tích khác để tối ưu hóa và cải thiện chiến lược trên cơ sở ban đầu, làm cho nó ổn định hơn và thông minh hơn.
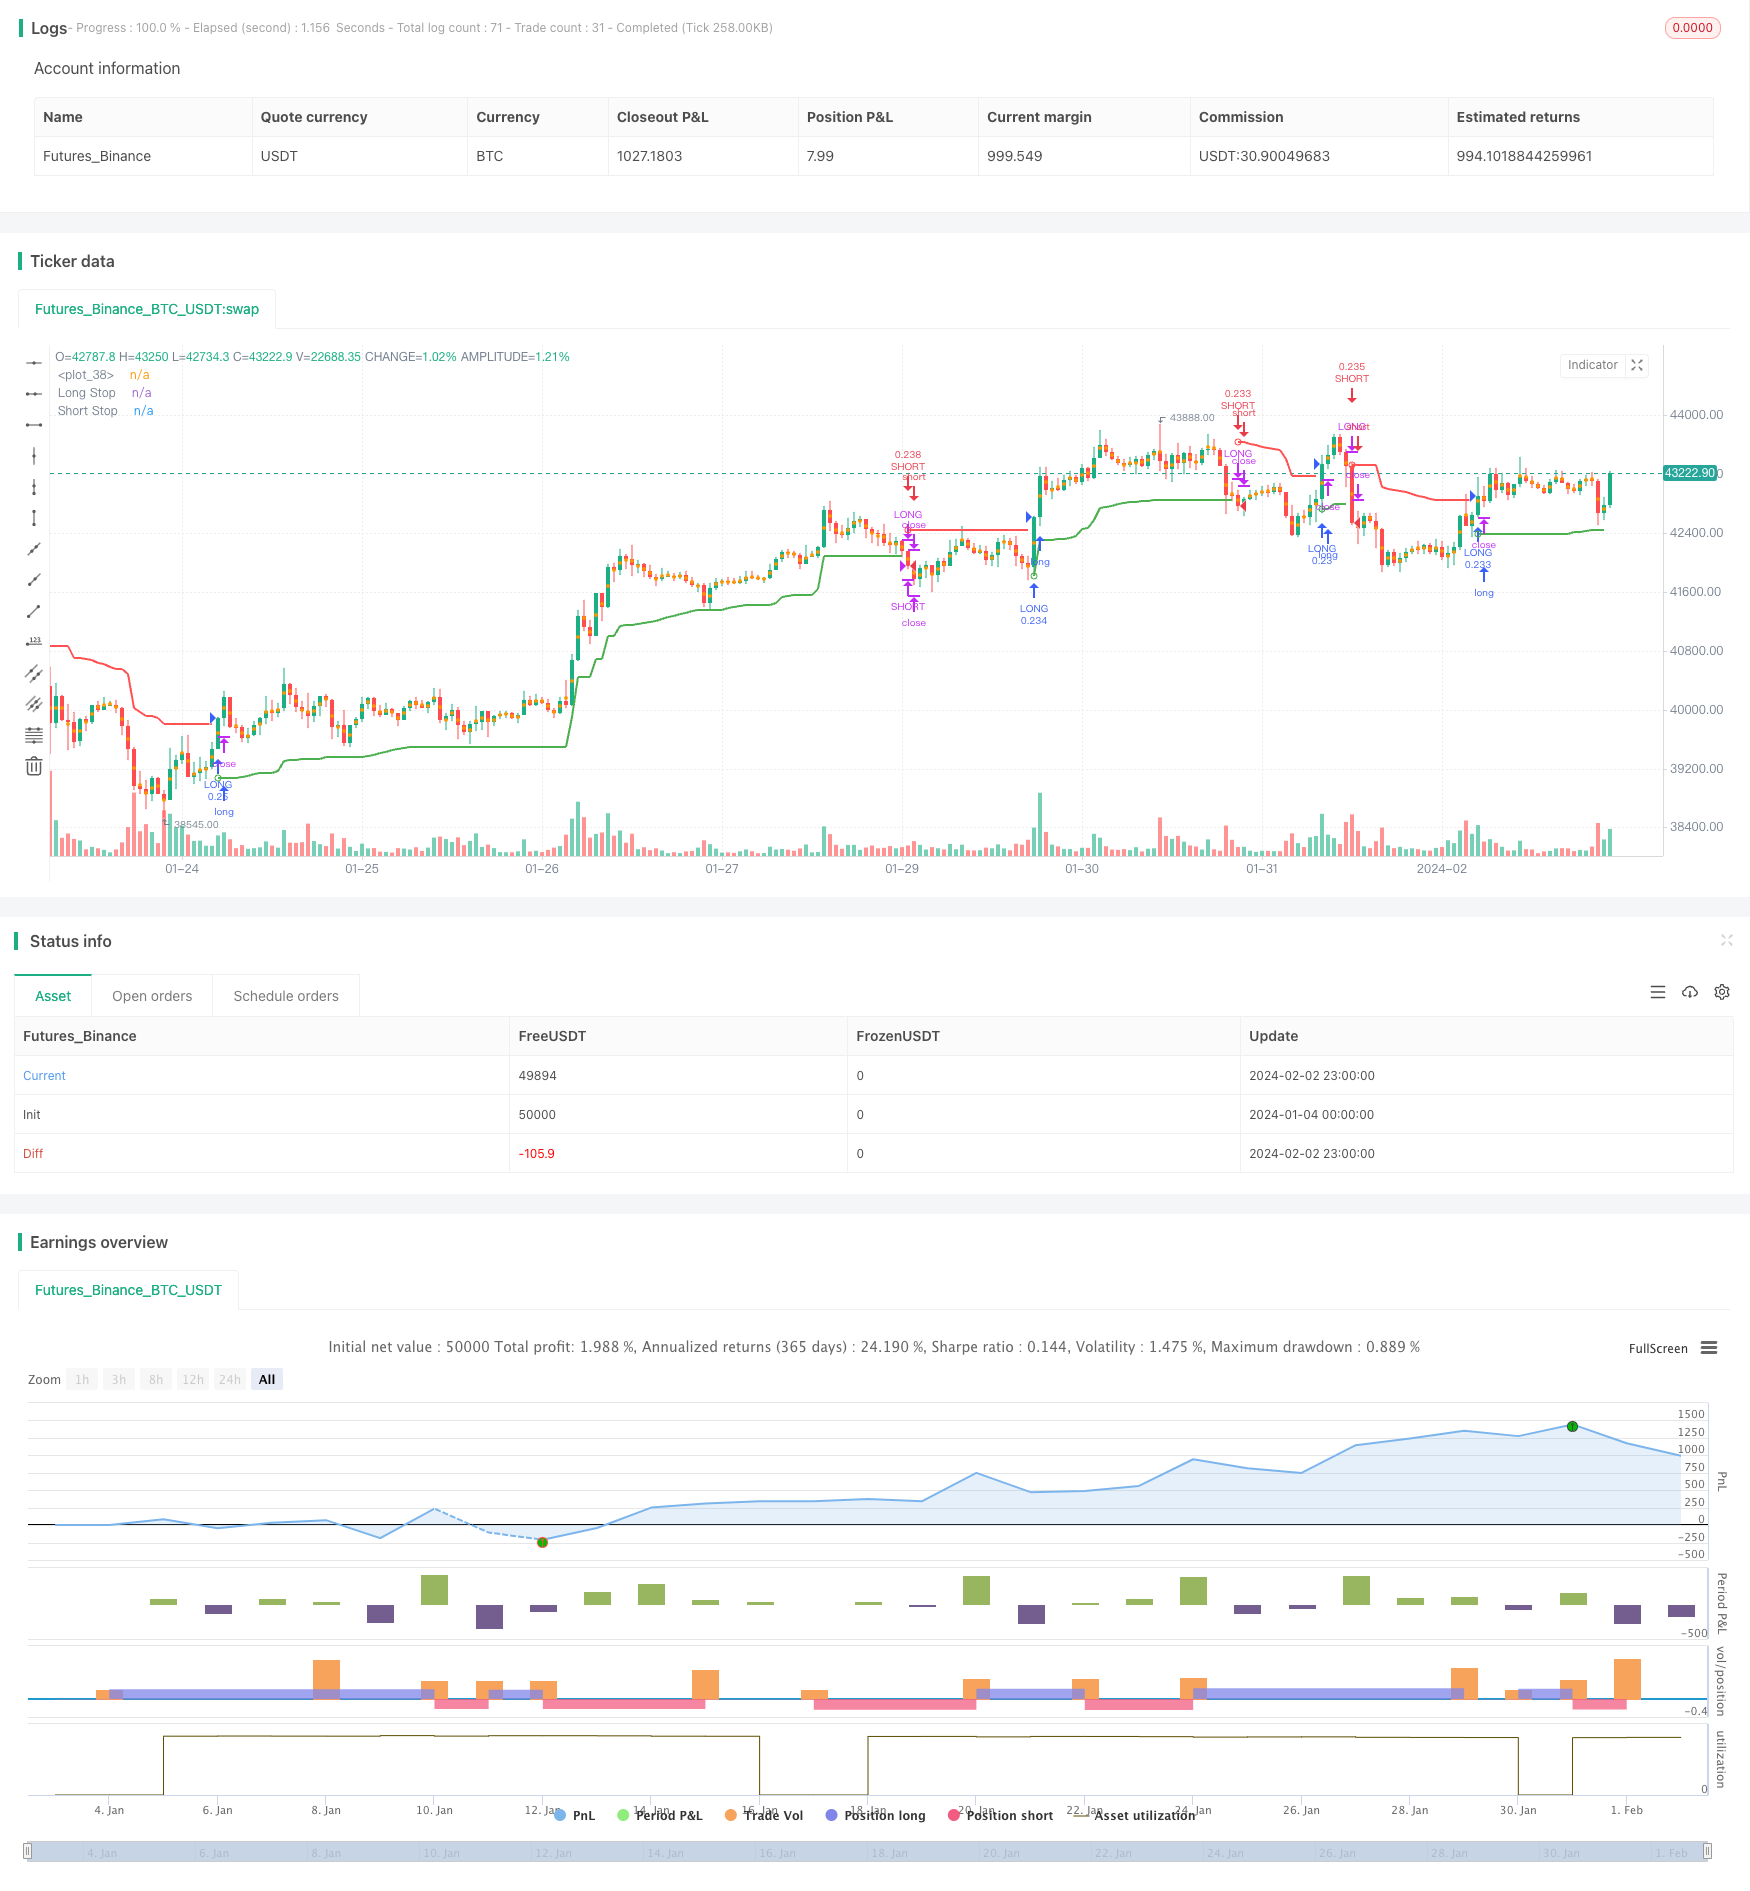
/*backtest
start: 2024-01-04 00:00:00
end: 2024-02-03 00:00:00
period: 1h
basePeriod: 15m
exchanges: [{"eid":"Futures_Binance","currency":"BTC_USDT"}]
*/

// This source code is subject to the terms of the Mozilla Public License 2.0 at https://mozilla.org/MPL/2.0/
// © melihtuna
//@version=4
strategy("Chandelier Exit - Strategy",shorttitle="CE-STG" , overlay=true, default_qty_type=strategy.cash, default_qty_value=10000, initial_capital=10000, currency=currency.USD, commission_value=0.03, commission_type=strategy.commission.percent)

length = input(title="ATR Period", type=input.integer, defval=22)
mult = input(title="ATR Multiplier", type=input.float, step=0.1, defval=3.0)
showLabels = input(title="Show Buy/Sell Labels ?", type=input.bool, defval=false)
useClose = input(title="Use Close Price for Extremums ?", type=input.bool, defval=true)
highlightState = input(title="Highlight State ?", type=input.bool, defval=true)

atr = mult * atr(length)

longStop = (useClose ? highest(close, length) : highest(length)) - atr
longStopPrev = nz(longStop[1], longStop)
longStop := close[1] > longStopPrev ? max(longStop, longStopPrev) : longStop

shortStop = (useClose ? lowest(close, length) : lowest(length)) + atr
shortStopPrev = nz(shortStop[1], shortStop)
shortStop := close[1] < shortStopPrev ? min(shortStop, shortStopPrev) : shortStop

var int dir = 1
dir := close > shortStopPrev ? 1 : close < longStopPrev ? -1 : dir

var color longColor = color.green
var color shortColor = color.red

longStopPlot = plot(dir == 1 ? longStop : na, title="Long Stop", style=plot.style_linebr, linewidth=2, color=longColor)
buySignal = dir == 1 and dir[1] == -1
plotshape(buySignal ? longStop : na, title="Long Stop Start", location=location.absolute, style=shape.circle, size=size.tiny, color=longColor, transp=0)
plotshape(buySignal and showLabels ? longStop : na, title="Buy Label", text="Buy", location=location.absolute, style=shape.labelup, size=size.tiny, color=longColor, textcolor=color.white, transp=0)

shortStopPlot = plot(dir == 1 ? na : shortStop, title="Short Stop", style=plot.style_linebr, linewidth=2, color=shortColor)
sellSignal = dir == -1 and dir[1] == 1
plotshape(sellSignal ? shortStop : na, title="Short Stop Start", location=location.absolute, style=shape.circle, size=size.tiny, color=shortColor, transp=0)
plotshape(sellSignal and showLabels ? shortStop : na, title="Sell Label", text="Sell", location=location.absolute, style=shape.labeldown, size=size.tiny, color=shortColor, textcolor=color.white, transp=0)

midPricePlot = plot(ohlc4, title="", style=plot.style_circles, linewidth=0, display=display.none, editable=false)

longFillColor = highlightState ? (dir == 1 ? longColor : na) : na
shortFillColor = highlightState ? (dir == -1 ? shortColor : na) : na
fill(midPricePlot, longStopPlot, title="Long State Filling", color=longFillColor)
fill(midPricePlot, shortStopPlot, title="Short State Filling", color=shortFillColor)


long_short = input(true, "Long-Short",type=input.bool, group="Strategy Settings")

start     = input(timestamp("2019-01-01"), "Date", type=input.time, group="Strategy Settings")
finish    = input(timestamp("2025-01-01"), "Date", type=input.time, group="Strategy Settings")
window()  => true

slRatio=input(5, "Manuel Stop Loss Ratio", type=input.float, minval=0, group="Strategy Settings")
tpRatio=input(20, "Take Profit Ratio", type=input.float, minval=0, group="Strategy Settings")
tsStartRatio=input(10, "Trailing Stop Start Ratio", type=input.float, minval=0, group="Strategy Settings")
tsRatio=input(5, "Trailing Stop Ratio", type=input.float, minval=1, group="Strategy Settings")

lastBuyPrice = strategy.position_avg_price

diffHiPriceRatio = (high-lastBuyPrice)/lastBuyPrice*100
diffLoPriceRatio = (close-lastBuyPrice)/lastBuyPrice*100
posHiRatio=0.0
posHiRatio:= strategy.position_size > 0 ? diffHiPriceRatio > posHiRatio[1] ? diffHiPriceRatio : posHiRatio[1] : 0

s_diffHiPriceRatio = (low-lastBuyPrice)/lastBuyPrice*100
s_diffLoPriceRatio = (close-lastBuyPrice)/lastBuyPrice*100
s_posHiRatio=0.0
s_posHiRatio:= strategy.position_size < 0 ? s_diffLoPriceRatio < s_posHiRatio[1] ? s_diffLoPriceRatio : s_posHiRatio[1] : 0

strategy.entry("LONG", strategy.long, when = window() and buySignal)
strategy.close("LONG", when = window() and sellSignal)
strategy.close("LONG", when = diffLoPriceRatio<(slRatio*(-1)), comment="STOP-LONG")
strategy.close("LONG", when = diffHiPriceRatio>tpRatio, comment="TAKE-PROFIT-LONG")
strategy.close("LONG", when = ((posHiRatio[1]>tsStartRatio) and (posHiRatio[1]-diffHiPriceRatio)>tsRatio), comment="TRAILING-STOP-LONG")

if long_short
    strategy.entry("SHORT", strategy.short, when = window() and sellSignal)
    strategy.close("SHORT", when = window() and buySignal)
    strategy.close("SHORT", when = s_diffLoPriceRatio>(slRatio), comment="STOP-SHORT")
    strategy.close("SHORT", when = s_diffHiPriceRatio<(tpRatio*(-1)), comment="TAKE-PROFIT-SHORT")
    strategy.close("SHORT", when = ((s_posHiRatio[1]*(-1)>tsStartRatio) and ((s_posHiRatio[1]-s_diffLoPriceRatio))*(-1)>tsRatio), comment="TRAILING-STOP-SHORT")