Chiến lược Ripple dựa trên khoảng thời gian kiểm tra ngược của chỉ báo Coral Trend
Tổng quan
Chiến lược này sử dụng chỉ số Coral Trend của LazyBear để xác định hướng xu hướng giá, xác định điểm vào tiềm năng bằng cách nhận ra sự đảo ngược hướng của chỉ số Coral Trend. Để lọc các đột phá giả, chiến lược này sử dụng chỉ số ADX hoặc nhóm chỉ số Absolute Strength Histogram và HawkEye Volume để xác nhận các chỉ số hợp tác, để thực hiện một sự nhập cảnh đáng tin cậy hơn.
Cơ chế Exit sử dụng giá cao nhất / giá thấp nhất của đường N gốc K gần đây nhân tỷ lệ lợi nhuận rủi ro có thể cấu hình để thiết lập mức dừng lỗ và mức dừng.
Nguyên tắc chiến lược
Sau khi đánh giá hướng của xu hướng lớn dựa trên chỉ số Coral Trend, khi màu chỉ số không thay đổi, giá sẽ có một sự hồi phục nhỏ theo hướng ngược lại. Nếu sự hồi phục kết thúc và giá quay trở lại hướng xu hướng chính của chỉ dẫn Coral Trend, thì đây có thể được coi là một thời gian nhập cảnh tốt hơn.
Điều kiện nhập học bao gồm:
Đường chỉ số Coral Trend phù hợp với hướng giao dịch ((các đầu nhiều = màu xanh lá cây, đầu trống = đỏ)
Kể từ khi giá trước đó phá vỡ hoàn toàn chỉ số Coral Trend ((trên cao của thanh cuối cùng vượt qua đường Coral Trend), đã có ít nhất 1 đường K với các điểm thấp hoàn toàn trên chỉ số Coral Trend ((multihead) hoặc các điểm cao hoàn toàn dưới chỉ số Coral Trend ((vô đầu)
Một sự hồi phục nhỏ xảy ra theo hướng ngược lại ((thay lại), trong quá trình hồi phục nhỏ, giá đóng cửa luôn ở phía ngược của Coral Trend
Sau khi kết thúc một đợt điều chỉnh nhỏ, giá đóng cửa trở lại hướng chính của chỉ dẫn Coral Trend
Điều kiện chính là những điều trên. Trong khi đó, chiến lược sử dụng chỉ số ADX hoặc Absolute Strength Histogram và chỉ số HawkEye Volume như là điều kiện xác nhận nhập học.
Chỉ số ADX yêu cầu giá trị của nó là > 20 và gần đây đã tăng 1 đường K. Và thứ tự của đường xanh và đường đỏ của DI phù hợp với hướng giao dịch.
Hình phân tử Absolute Strength yêu cầu màu sắc của nó phù hợp với hướng giao dịch ((multiple = blue, blank = red)). HawkEye Volume yêu cầu màu sắc của nó phù hợp với hướng giao dịch ((multiple = green, blank = red)).
Cơ chế Exit là sử dụng giá cao nhất hoặc giá thấp nhất của dòng N gốc K gần nhất nhân với tỷ lệ lợi nhuận rủi ro để thiết lập điểm dừng lỗ và điểm dừng. Các giá trị N và tỷ lệ lợi nhuận rủi ro đều có thể được cấu hình thông qua tham số.
Phân tích lợi thế
Ưu điểm lớn nhất của chiến lược này là sử dụng chỉ số Coral Trend để xác định hướng của xu hướng chính, tìm kiếm cơ hội nhập bằng cách xác định sự đảo ngược của nó, tránh đi theo làn sóng trong thị trường không có xu hướng. Đồng thời, việc sử dụng chỉ số Confirm có thể lọc nhiều đột phá giả, do đó tăng tỷ lệ thành công của nhập cảnh.
Ngoài ra, chiến lược này cung cấp một cơ chế kiểm soát rủi ro hoàn chỉnh, bao gồm thiết lập mức dừng lỗ và kiểm soát tỷ lệ phần trăm lỗ hổng rủi ro, do đó, ngay cả khi mất mát giao dịch cá nhân cũng không gây ra tác động lớn đến tổng số tiền.
Phân tích rủi ro
Rủi ro lớn nhất của chiến lược này là sử dụng các chỉ số để đưa ra phán đoán đầu vào, dễ gây ra ảo tưởng rằng việc hoàn toàn phụ thuộc vào cấu hình tham số có thể tự động kiếm lợi nhuận. Trên thực tế, tối ưu hóa tham số và cấu hình quy tắc đều cần kết hợp các định luật về thay đổi giá cơ bản, trực quan về hiệu quả của các chỉ số liên kết với giá, để thiết lập cấu hình phù hợp hơn với phong cách giao dịch và loại của bạn.
Ngoài ra, các thiết lập của điểm dừng và điểm dừng cũng phải phù hợp, quá nhiều lần dừng có thể dẫn đến không thể dừng và rời khỏi sân, và điểm dừng quá nhỏ có nguy cơ quá lớn. Điều này cần được thiết lập theo mức độ biến động của các giống khác nhau và khả năng chịu rủi ro cá nhân.
Hướng tối ưu hóa
Các hướng tối ưu hóa của chiến lược bao gồm:
Điều chỉnh các tham số của chỉ số Coral Trend để đáp ứng nhanh hơn với sự thay đổi giá của các giống khác nhau
Thử các chỉ số xác nhận khác nhau hoặc kết hợp các chỉ số như KDJ, MACD, v.v. để tín hiệu nhập cảnh chính xác hơn
Điều chỉnh cách tính toán điểm dừng và điểm dừng tùy theo biến động của các giống khác nhau để kiểm soát rủi ro tốt hơn
Thêm mô-đun quản lý tiền, có thể điều chỉnh số lượng đơn đặt hàng theo số lượng vị trí, kiểm soát hiệu quả tổn thất tổng thể
Thêm mô-đun kiểm soát thời gian giao dịch để chiến lược chỉ hoạt động trong một khoảng thời gian nhất định, tránh thua lỗ trong thời gian biến động mạnh
Tóm tắt
Chiến lược này sử dụng Coral Trend để xác định xu hướng đường dài trung bình, sau đó bằng cách xác định sự đảo ngược của nó, kết hợp với tín hiệu Confirm để lọc các đợt phá vỡ giả, xây dựng một chiến lược theo dõi xu hướng đáng tin cậy hơn. Đồng thời, cài đặt kiểm soát gió hoàn hảo cũng làm cho chiến lược này có thể hoạt động trong thời gian dài và ổn định tài chính.
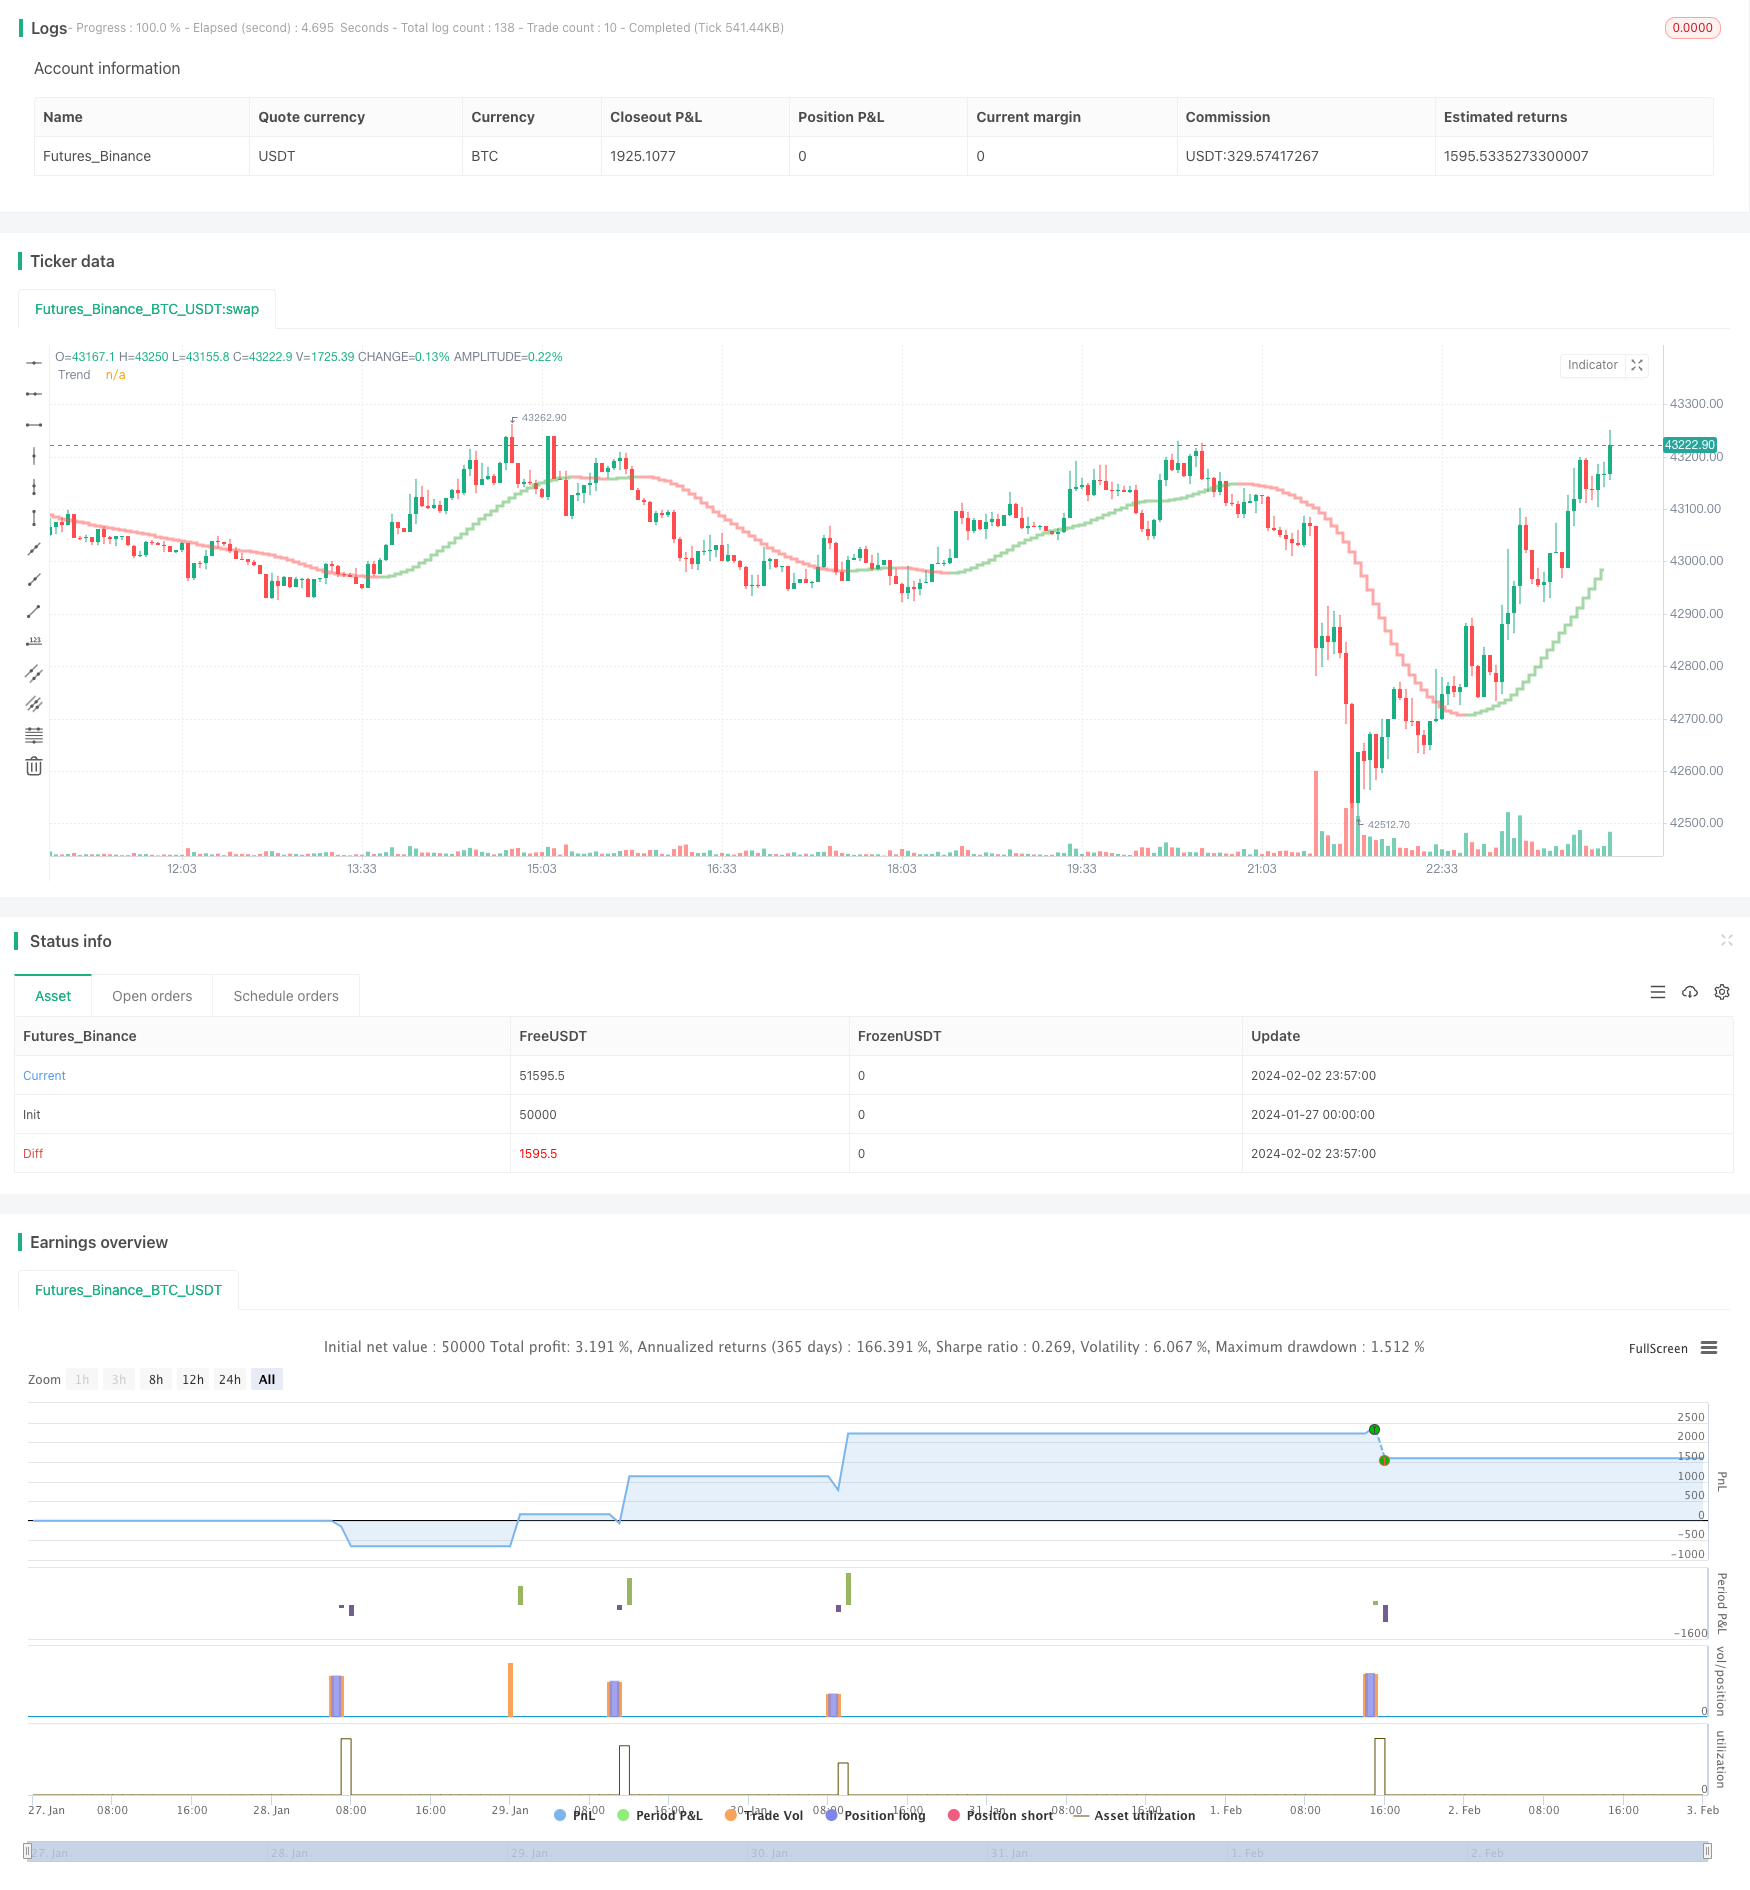
/*backtest
start: 2024-01-27 00:00:00
end: 2024-02-03 00:00:00
period: 3m
basePeriod: 1m
exchanges: [{"eid":"Futures_Binance","currency":"BTC_USDT"}]
*/

// This source code is subject to the terms of the Mozilla Public License 2.0 at https://mozilla.org/MPL/2.0/
// © kevinmck100

// @description
//
// Strategy is taken from the TradeIQ YouTube video called "I Finally Found 80% Win Rate Trading Strategy For Crypto"
// Check out the full video for further details/clarification on strategy entry/exit conditions.
//
// It incorporates the following features:
//
//      - Risk management:  Configurable X% loss per stop loss
//                          Configurable R:R ratio
//
//      - Trade entry:      Conditions outlines below
//
//      - Trade exit:       Conditions outlined below
//
//      - Backtesting:      Configurable backtesting range by date
//
//      - Trade drawings:   TP/SL boxes drawn for all trades (can be turned on and off)
//                          Trade exit information labels (can be turned on and off)
//                          NOTE: Trade drawings will only be applicable when using overlay strategies
//
//      - Debugging:        Includes section with useful debugging techniques
//
// Strategy conditions:
//
//      - Trade entry:      LONG:   C1: Coral Trend is bullish
//                                  C2: At least 1 candle where low is above Coral Trend since last cross above Coral Trend
//                                  C3: Pullback happens and price closes below Coral Trend
//                                  C4: Coral Trend colour remains bullish for duration of pullback
//                                  C5: After valid pullback, price then closes above Coral Trend
//                                  C6: Optional confirmation indicators (choose either C6.1 or C6.2 or NONE):
//                                      C6.1: ADX and DI (Single indicator)
//                                          C6.1.1: Green line is above red line
//                                          C6.1.2: Blue line > 20
//                                          C6.1.3: Blue trending up over last 1 candle
//                                      C6.2: Absolute Strengeh Histogram + HawkEye Volume Indicator (Two indicators combined)
//                                          C6.2.1: Absolute Strengeh Histogram colour is blue
//                                          C6.2.2: HawkEye Volume Indicator colour is green
//                          SHORT:  C1: Coral Trend is bearish
//                                  C2: At least 1 candle where high is below Coral Trend since last cross below Coral Trend
//                                  C3: Pullback happens and price closes above Coral Trend
//                                  C4: Coral Trend colour remains bearish for duration of pullback
//                                  C5: After valid pullback, price then closes below Coral Trend
//                                  C6: Optional confirmation indicators (choose either C6.1 or C6.2 or NONE):
//                                      C6.1: ADX and DI (Single indicator)
//                                          C6.1.1: Red line is above green line
//                                          C6.1.2: Blue line > 20
//                                          C6.1.3: Blue trending up over last 1 candle
//                                      C6.2: Absolute Strengeh Histogram + HawkEye Volume Indicator (Two indicators combined)
//                                          C6.2.1: Absolute Strengeh Histogram colour is red
//                                          C6.2.2: HawkEye Volume Indicator colour is red
//                          NOTE: All the optional confirmation indicators cannot be overlayed with Coral Trend so feel free to add each separately to the chart for visual purposes
//
//
//      - Trade exit:       Stop Loss:      Calculated by recent swing low over previous X candles (configurable with "Local High/Low Lookback")
//                          Take Profit:    Calculated from R:R multiplier * Stop Loss size
//
// @credits
//
// Coral Trend Indicator [LazyBear]     by @LazyBear
// Absolute Strength Histogram | jh     by @jiehonglim
// Indicator: HawkEye Volume Indicator  by @LazyBear
// ADX and DI                           by @BeikabuOyaji

//@version=5
INITIAL_CAPITAL = 1000
DEFAULT_COMMISSION = 0.02
MAX_DRAWINGS = 500
IS_OVERLAY = true

strategy("Coral Trend Pullback Strategy (TradeIQ)", "Coral Trend Pullback", overlay = IS_OVERLAY, initial_capital = INITIAL_CAPITAL, currency = currency.NONE, max_labels_count = MAX_DRAWINGS, max_boxes_count = MAX_DRAWINGS, max_lines_count = MAX_DRAWINGS, default_qty_type = strategy.cash, commission_type = strategy.commission.percent, commission_value = DEFAULT_COMMISSION)

// =============================================================================
// INPUTS
// =============================================================================

// ---------------
// Risk Management
// ---------------
riskReward          = input.float(1.5,  "Risk : Reward        1 :",     group = "Strategy: Risk Management",    inline = "RM1", minval = 0, step = 0.1, tooltip = "Previous high or low (long/short dependant) is used to determine TP level. 'Risk : Reward' ratio is then used to calculate SL based of previous high/low level.\n\nIn short, the higher the R:R ratio, the smaller the SL since TP target is fixed by previous high/low price data.")
accountRiskPercent  = input.float(1,    "Portfolio Risk %        ",     group = "Strategy: Risk Management",    inline = "RM2", minval = 0, step = 0.1, tooltip = "Percentage of portfolio you lose if trade hits SL.\n\nYou then stand to gain\n  Portfolio Risk % * Risk : Reward\nif trade hits TP.")

localHlLookback     = input.int (5,     "Local High/Low Lookback     ", group = "Strategy: Stop Loss Settings", inline = "SL1", minval = 1,             tooltip = "This strategy calculates the Stop Loss value from the recent local high/low. This lookback period determines the number of candles to include for the local high/low.")

// ----------
// Date Range
// ----------
startYear           = input.int (2010,  "Start Date  ",                 group = "Strategy: Date Range",         inline = "DR1", minval    = 1900, maxval = 2100)
startMonth          = input.int (1,     "",                             group = "Strategy: Date Range",         inline = "DR1", options   = [1, 2, 3, 4, 5, 6, 7, 8, 9, 10, 11, 12])
startDate           = input.int (1,     "",                             group = "Strategy: Date Range",         inline = "DR1", options   = [1, 2, 3, 4, 5, 6, 7, 8, 9, 10, 11, 12, 13, 14, 15, 16, 17, 18, 19, 20, 21, 22, 23, 24, 25, 26, 27, 28, 29, 30, 31])
endYear             = input.int (2100,  "End Date    ",                 group = "Strategy: Date Range",         inline = "DR2", minval    = 1900, maxval = 2100)
endMonth            = input.int (1,     "",                             group = "Strategy: Date Range",         inline = "DR2", options   = [1, 2, 3, 4, 5, 6, 7, 8, 9, 10, 11, 12])
endDate             = input.int (1,     "",                             group = "Strategy: Date Range",         inline = "DR2", options   = [1, 2, 3, 4, 5, 6, 7, 8, 9, 10, 11, 12, 13, 14, 15, 16, 17, 18, 19, 20, 21, 22, 23, 24, 25, 26, 27, 28, 29, 30, 31])

// ----------------
// Drawing Settings
// ----------------
showTpSlBoxes       = input.bool(true,  "Show TP / SL Boxes",           group = "Strategy: Drawings",           inline = "D1",  tooltip = "Show or hide TP and SL position boxes.\n\nNote: TradingView limits the maximum number of boxes that can be displayed to 500 so they may not appear for all price data under test.")
showLabels          = input.bool(false, "Show Trade Exit Labels",       group = "Strategy: Drawings",           inline = "D2",  tooltip = "Useful labels to identify Profit/Loss and cumulative portfolio capital after each trade closes.\n\nAlso note that TradingView limits the max number of 'boxes' that can be displayed on a chart (max 500). This means when you lookback far enough on the chart you will not see the TP/SL boxes. However you can check this option to identify where trades exited.")

// ------------------
// Indicator Settings
// ------------------

// Coral Trend
ctSm                = input.int  (25,       "Smoothing Period       ",              group = "Leading Indicator: Coral Trand Settings",                      inline = "CT1")
ctCd                = input.float(0.4,      "Constant D          ",                 group = "Leading Indicator: Coral Trand Settings",                      inline = "CT2", step = 0.1)

// Confirmation indicator inputs
confirmationInd     = input.string("ADX and DI", "Entry Confirmation Method    ",   group = "Confirmation Indicator: Indicator Selection",                  inline = "IS1", options=["None", "ADX and DI", "Absolute Strength Histogram + HawkEye Volume"], tooltip = "Select one of the possible confirmation indicator(s) which can be used to confirm entry signals from the main Coral Trend indicator conditions. See strategy conditions to understand the logic behind each confirmation indicator")
// ADX and DI
adxLen              = input.int(14, "ADX Length           ",                        group = "Confirmation Indicator: ADX and DI Settings",                  inline = "AD1")
midLine             = input.int(20, "Mid Line            ",                         group = "Confirmation Indicator: ADX and DI Settings",                  inline = "AD2", tooltip = "Mid line on standard ADX and DI indicator. In this strategy the DI must be above this line for entry confirmation.")
// Absolute Strength Histogram
ashLength           = input.int(9, "Period of Evaluation       ",                   group = "Confirmation Indicator: Absolute Strength Histogram Settings", inline = "ASH1")
ashSmooth           = input.int(6, "Period of Smoothing      ",                     group = "Confirmation Indicator: Absolute Strength Histogram Settings", inline = "ASH2")
ashSrc              = input.source(close, "Source             ",                    group = "Confirmation Indicator: Absolute Strength Histogram Settings", inline = "ASH3")
ashMode             = input.string("RSI", "Indicator Method       ",                group = "Confirmation Indicator: Absolute Strength Histogram Settings", inline = "ASH4", options=["RSI", "STOCHASTIC", "ADX"])
sahMaType           = input.string("SMA", "MA              ",                       group = "Confirmation Indicator: Absolute Strength Histogram Settings", inline = "ASH5", options=["ALMA", "EMA", "WMA", "SMA", "SMMA", "HMA"])
ashAlmaOffset       = input.float(0.85, "* Arnaud Legoux (ALMA) Offset",            group = "Confirmation Indicator: Absolute Strength Histogram Settings", inline = "ASH6", minval=0, step=0.01)
ashAlmaSigma        = input.int(6, "* Arnaud Legoux (ALMA) Sigma",                  group = "Confirmation Indicator: Absolute Strength Histogram Settings", inline = "ASH7", minval=0)
// HawkEye Volume Indicator
hevLength           = input.int(200, "Length             ",                         group = "Confirmation Indicator: HawkEye Volume Settings",              inline = "HV1")
hevDivisor          = input.float(1.6, "Divisor             ",                      group = "Confirmation Indicator: HawkEye Volume Settings",              inline = "HV2", step=0.1)

// =============================================================================
// INDICATORS
// =============================================================================

// -----------
// Coral Trend
// -----------
src             = close
di              = (ctSm - 1.0) / 2.0 + 1.0
c1              = 2 / (di + 1.0)
c2              = 1 - c1
c3              = 3.0 * (ctCd * ctCd + ctCd * ctCd * ctCd)
c4              = -3.0 * (2.0 * ctCd * ctCd + ctCd + ctCd * ctCd * ctCd)
c5              = 3.0 * ctCd + 1.0 + ctCd * ctCd * ctCd + 3.0 * ctCd * ctCd
var float i1    = na
var float i2    = na
var float i3    = na
var float i4    = na
var float i5    = na
var float i6    = na
i1             := c1 * src + c2 * nz(i1[1])
i2             := c1 * i1  + c2 * nz(i2[1])
i3             := c1 * i2  + c2 * nz(i3[1])
i4             := c1 * i3  + c2 * nz(i4[1])
i5             := c1 * i4  + c2 * nz(i5[1])
i6             := c1 * i5  + c2 * nz(i6[1])

bfr             = -ctCd * ctCd * ctCd * i6 + c3 * i5 + c4 * i4 + c5 * i3
bfrC            = bfr > nz(bfr[1]) ? color.new(color.green, 50) : bfr < nz(bfr[1]) ? color.new(color.red, 50) : color.new(color.blue, 50)
plot(bfr, "Trend", linewidth = 3, style = plot.style_stepline, color = bfrC)

// ----------
// ADX and DI
// ----------
TrueRange                           = math.max(math.max(high - low, math.abs(high - nz(close[1]))), math.abs(low - nz(close[1])))
DirectionalMovementPlus             = high - nz(high[1]) > nz(low[1]) - low ? math.max(high - nz(high[1]), 0) : 0
DirectionalMovementMinus            = nz(low[1]) - low > high - nz(high[1]) ? math.max(nz(low[1]) - low, 0) : 0

SmoothedTrueRange                   = 0.0
SmoothedTrueRange                  := nz(SmoothedTrueRange[1]) - nz(SmoothedTrueRange[1]) / adxLen + TrueRange

SmoothedDirectionalMovementPlus     = 0.0
SmoothedDirectionalMovementPlus    := nz(SmoothedDirectionalMovementPlus[1]) - nz(SmoothedDirectionalMovementPlus[1]) / adxLen + DirectionalMovementPlus

SmoothedDirectionalMovementMinus    = 0.0
SmoothedDirectionalMovementMinus   := nz(SmoothedDirectionalMovementMinus[1]) - nz(SmoothedDirectionalMovementMinus[1]) / adxLen + DirectionalMovementMinus

DIPlus                              = SmoothedDirectionalMovementPlus / SmoothedTrueRange * 100
DIMinus                             = SmoothedDirectionalMovementMinus / SmoothedTrueRange * 100
DX                                  = math.abs(DIPlus - DIMinus) / (DIPlus + DIMinus) * 100
ADX                                 = ta.sma(DX, adxLen)

// ---------------------------
// Absolute Strength Histogram
// ---------------------------
ashMa(ashType, ashSrc, ashLen) =>
    float result = 0
    if ashType == 'SMA'  // Simple
        result := ta.sma(ashSrc, ashLen)
        result
    if ashType == 'EMA'  // Exponential
        result := ta.ema(ashSrc, ashLen)
        result
    if ashType == 'WMA'  // Weighted
        result := ta.wma(ashSrc, ashLen)
        result
    if ashType == 'SMMA'  // Smoothed
        ashWma = ta.wma(ashSrc, ashLen)
        ashSma = ta.sma(ashSrc, ashLen)
        result := na(ashWma[1]) ? ashSma : (ashWma[1] * (ashLen - 1) + ashSrc) / ashLen
        result
    if ashType == 'HMA'  // Hull
        result := ta.wma(2 * ta.wma(ashSrc, ashLen / 2) - ta.wma(ashSrc, ashLen), math.round(math.sqrt(ashLen)))
        result
    if ashType == 'ALMA'  // Arnaud Legoux
        result := ta.alma(ashSrc, ashLen, ashAlmaOffset, ashAlmaSigma)
        result
    result

Price           = ashSrc
Price1          = ashMa('SMA', Price, 1)
Price2          = ashMa('SMA', Price[1], 1)

//RSI
Bulls0          = 0.5 * (math.abs(Price1 - Price2) + Price1 - Price2)
Bears0          = 0.5 * (math.abs(Price1 - Price2) - (Price1 - Price2))

//STOCHASTIC
Bulls1          = Price1 - ta.lowest(Price1, ashLength)
Bears1          = ta.highest(Price1, ashLength) - Price1

//ADX
Bulls2          = 0.5 * (math.abs(high - high[1]) + high - high[1])
Bears2          = 0.5 * (math.abs(low[1] - low) + low[1] - low)

Bulls           = ashMode == 'RSI' ? Bulls0 : ashMode == 'STOCHASTIC' ? Bulls1 : Bulls2
Bears           = ashMode == 'RSI' ? Bears0 : ashMode == 'STOCHASTIC' ? Bears1 : Bears2
AvgBulls        = ashMa(sahMaType, Bulls, ashLength)
AvgBears        = ashMa(sahMaType, Bears, ashLength)

SmthBulls       = ashMa(sahMaType, AvgBulls, ashSmooth)
SmthBears       = ashMa(sahMaType, AvgBears, ashSmooth)

isTrendBullish  = SmthBulls > SmthBears ? true : false

// ------------------------
// HawkEye Volume Indicator
// ------------------------
hevRange1   = high - low
hevRangeAvg = ta.sma(hevRange1, hevLength)
hevVolumeA  = ta.sma(volume, hevLength)

hevHigh1    = high[1]
hevLow1     = low[1]
hevMid1     = hl2[1]

hevU1       = hevMid1 + (hevHigh1 - hevLow1) / hevDivisor
hevD1       = hevMid1 - (hevHigh1 - hevLow1) / hevDivisor

rEnabled1   = hevRange1 > hevRangeAvg and close < hevD1 and volume > hevVolumeA
rEnabled2   = close < hevMid1
rEnabled    = rEnabled1 or rEnabled2

gEnabled1   = close > hevMid1
gEnabled2   = hevRange1 > hevRangeAvg and close > hevU1 and volume > hevVolumeA
gEnabled3   = high > hevHigh1 and hevRange1 < hevRangeAvg / 1.5 and volume < hevVolumeA
gEnabled4   = low < hevLow1 and hevRange1 < hevRangeAvg / 1.5 and volume > hevVolumeA
gEnabled    = gEnabled1 or gEnabled2 or gEnabled3 or gEnabled4

grEnabled1  = hevRange1 > hevRangeAvg and close > hevD1 and close < hevU1 and volume > hevVolumeA and volume < hevVolumeA * 1.5 and volume > volume[1]
grEnabled2  = hevRange1 < hevRangeAvg / 1.5 and volume < hevVolumeA / 1.5
grEnabled3  = close > hevD1 and close < hevU1
grEnabled   = grEnabled1 or grEnabled2 or grEnabled3

// =============================================================================
// STRATEGY LOGIC
// =============================================================================

// ---------
// FUNCTIONS
// ---------

percentAsPoints(pcnt) =>
    math.round(pcnt / 100 * close / syminfo.mintick)

calcStopLossPrice(pointsOffset, isLong) =>
    priceOffset = pointsOffset * syminfo.mintick
    if isLong
        close - priceOffset
    else
        close + priceOffset

calcProfitTrgtPrice(pointsOffset, isLong) =>
    calcStopLossPrice(-pointsOffset, isLong)


printLabel(barIndex, msg) => label.new(barIndex, close, msg)

printTpSlHitBox(left, right, slHit, tpHit, entryPrice, slPrice, tpPrice) =>
    if showTpSlBoxes
        box.new (left = left,   top = entryPrice,   right = right,  bottom = slPrice,   bgcolor = slHit ? color.new(color.red, 60)   : color.new(color.gray, 90), border_width = 0)
        box.new (left = left,   top = entryPrice,   right = right,  bottom = tpPrice,   bgcolor = tpHit ? color.new(color.green, 60) : color.new(color.gray, 90), border_width = 0)
        line.new(x1 = left,     y1 = entryPrice,    x2 = right,     y2 = entryPrice,    color = color.new(color.yellow, 20))
        line.new(x1 = left,     y1 = slPrice,       x2 = right,     y2 = slPrice,       color = color.new(color.red, 20))
        line.new(x1 = left,     y1 = tpPrice,       x2 = right,     y2 = tpPrice,       color = color.new(color.green, 20))

printTpSlNotHitBox(left, right, entryPrice, slPrice, tpPrice) =>
    if showTpSlBoxes
        box.new (left = left,   top = entryPrice,   right = right,  bottom = slPrice,   bgcolor = color.new(color.gray, 90), border_width = 0)
        box.new (left = left,   top = entryPrice,   right = right,  bottom = tpPrice,   bgcolor = color.new(color.gray, 90), border_width = 0)
        line.new(x1 = left,     y1 = entryPrice,    x2 = right,     y2 = entryPrice,    color = color.new(color.yellow, 20))
        line.new(x1 = left,     y1 = slPrice,       x2 = right,     y2 = slPrice,       color = color.new(color.red, 20))
        line.new(x1 = left,     y1 = tpPrice,       x2 = right,     y2 = tpPrice,       color = color.new(color.green, 20))

printTradeExitLabel(x, y, posSize, entryPrice, pnl) =>
    if showLabels
        labelStr = "Position Size: " + str.tostring(math.abs(posSize), "#.##") + "\nPNL: " + str.tostring(pnl, "#.##") + "\nCapital: " + str.tostring(strategy.equity, "#.##") + "\nEntry Price: " + str.tostring(entryPrice, "#.##")
        label.new(x = x, y = y, text = labelStr, color = pnl > 0 ? color.new(color.green, 60) : color.new(color.red, 60), textcolor = color.white, style = label.style_label_down)

printVerticalLine(col) => line.new(bar_index, close, bar_index, close * 1.01, extend = extend.both, color = col)

// ----------
// CONDITIONS
// ----------

inDateRange                 = true

// Condition 1: Coral Trend color matches trend direction (long=green, short=red)
isCoralBullish              = bfr > nz(bfr[1])
isCoralBearish              = bfr < nz(bfr[1])

// Condition 2: At least 1 candle completely above/below (long/short) Coral Trend since last cross above/below (long/short) Coral Trend (could potentially try also with only close above)
sincePrePullbackBullBreakout= ta.barssince(ta.crossover(close, bfr))
sincePrePullbackBearBreakout= ta.barssince(ta.crossunder(close, bfr))
prePullbackBullBreakout     = ta.barssince(low > bfr and high > bfr) < sincePrePullbackBullBreakout[1]
prePullbackBearBreakout     = ta.barssince(low < bfr and high < bfr) < sincePrePullbackBearBreakout[1]

// Condition 3: Pullback closes below/above (long/short) Coral Trend
barssinceBullPullbackStart  = ta.barssince(ta.crossunder(close, bfr))
barssinceBearPullbackStart  = ta.barssince(ta.crossover(close, bfr))
barssincePullbackStart      = isCoralBullish ? barssinceBullPullbackStart : isCoralBearish ? barssinceBearPullbackStart : na

// Condition 4: Coral Trend colour matched trend direction for duration of pullback
sinceBullish                = ta.barssince(ta.crossover(bfr, nz(bfr[1])))
sinceBearish                = ta.barssince(ta.crossunder(bfr, nz(bfr[1])))
barssinceCoralflip          = isCoralBullish ? sinceBullish : isCoralBearish ? sinceBearish : na
isPullbackValid             = barssincePullbackStart < barssinceCoralflip

// Condition 5: After valid pullback, price then closes above/below (long/short) Coral Trend
entryBreakout               = (isCoralBullish and ta.crossover(close, bfr)) or (isCoralBearish and ta.crossunder(close, bfr))

// Condition 6: Confirmation indicators (6.1 or 6.2, optional depending on settings) confirms trade entry
// 6.1:         ADX and DI
//      6.1.1:  Green and red match trend (long=(green > red), short=(red > green))
//      6.1.2:  Blue > 20
//      6.1.3:  Blue trending up over last 1 candle
// 6.2:         Absolute Strengeh Histogram + HawkEye Volume Indicator
//      6.2.1:  Absolute Strengeh Histogram colour matches trend (long=blue, short=red)
//      6.2.2:  HawkEye Volume Indicator colour matches trend (long=green, short=red)
var longTradeConfirmed  = false
var shortTradeConfirmed = false
if confirmationInd      == "ADX and DI"
    isAdxUp             = ADX       > ADX [1]
    isAdxValid          = ADX       > midLine   and isAdxUp
    longTradeConfirmed := DIPlus    > DIMinus   and isAdxValid
    shortTradeConfirmed:= DIMinus   > DIPlus    and isAdxValid
else if confirmationInd == "Absolute Strength Histogram + HawkEye Volume"
    isAshBullish        = SmthBulls > SmthBears ? true : false
    isHevBullish        = not grEnabled     and gEnabled ? true : false
    isHevBearish        = not grEnabled     and rEnabled ? true : false
    longTradeConfirmed := isAshBullish      and isHevBullish
    shortTradeConfirmed:= not isAshBullish  and isHevBearish
else if confirmationInd == "None"
    longTradeConfirmed := true
    shortTradeConfirmed:= true

// Combine all entry conditions
goLong              = inDateRange and isCoralBullish and prePullbackBullBreakout and isPullbackValid and entryBreakout and longTradeConfirmed
goShort             = inDateRange and isCoralBearish and prePullbackBearBreakout and isPullbackValid and entryBreakout and shortTradeConfirmed

// Trade entry and exit variables
var tradeEntryBar   = bar_index
var profitPoints    = 0.
var lossPoints      = 0.
var slPrice         = 0.
var tpPrice         = 0.
var inLong          = false
var inShort         = false
var entryPrice      = 0.

// Entry decisions
openLong            = (goLong and not inLong)
openShort           = (goShort and not inShort)
flippingSides       = (goLong and inShort) or (goShort and inLong)
enteringTrade       = openLong or openShort
inTrade             = inLong or inShort

// Exit calculations
entryPrice         := close
longSlPrice         = ta.lowest(localHlLookback)
shortSlPrice        = ta.highest(localHlLookback)
slAmount            = isCoralBullish ? entryPrice - longSlPrice : shortSlPrice - entryPrice
slPercent           = math.abs((1 - (entryPrice - slAmount) / entryPrice) * 100)
tpPercent           = slPercent * riskReward

// Risk calculations
riskAmt             = strategy.equity * accountRiskPercent / 100
entryQty            = math.abs(riskAmt / slPercent * 100)  / close

if openLong
    if strategy.position_size < 0
        printTpSlNotHitBox(tradeEntryBar + 1, bar_index + 1, strategy.position_avg_price, slPrice, tpPrice)
        printTradeExitLabel(bar_index + 1, math.max(tpPrice, slPrice), strategy.position_size, strategy.position_avg_price, strategy.openprofit)
    strategy.entry("Long", strategy.long, qty = entryQty, alert_message = "Long Entry")
    enteringTrade   := true
    inLong          := true
    inShort         := false

if openShort
    if strategy.position_size > 0
        printTpSlNotHitBox(tradeEntryBar + 1, bar_index + 1, strategy.position_avg_price, slPrice, tpPrice)
        printTradeExitLabel(bar_index + 1, math.max(tpPrice, slPrice), strategy.position_size, strategy.position_avg_price, strategy.openprofit)
    strategy.entry("Short", strategy.short, qty = entryQty, alert_message = "Short Entry")
    enteringTrade   := true
    inShort         := true
    inLong          := false

if enteringTrade
    profitPoints    := percentAsPoints(tpPercent)
    lossPoints      := percentAsPoints(slPercent)
    slPrice         := calcStopLossPrice(lossPoints, openLong)
    tpPrice         := calcProfitTrgtPrice(profitPoints, openLong)
    tradeEntryBar   := bar_index

strategy.exit("TP/SL", profit = profitPoints, loss = lossPoints, comment_profit = "TP Hit", comment_loss = "SL Hit", alert_profit = "TP Hit Alert", alert_loss = "SL Hit Alert")

// =============================================================================
// DRAWINGS
// =============================================================================

// -----------
// TP/SL Boxes
// -----------

slHit           = (inShort and high >= slPrice) or (inLong  and low <= slPrice)
tpHit           = (inLong  and high >= tpPrice) or (inShort and low <= tpPrice)

exitTriggered   = slHit or tpHit
ctEntryPrice    = strategy.closedtrades.entry_price (strategy.closedtrades - 1)
pnl             = strategy.closedtrades.profit      (strategy.closedtrades - 1)
posSize         = strategy.closedtrades.size        (strategy.closedtrades - 1)

// Print boxes for trades closed at profit or loss
if (inTrade and exitTriggered)
    inShort    := false
    inLong     := false
    // printTpSlHitBox(tradeEntryBar, bar_index, slHit, tpHit, ctEntryPrice, slPrice, tpPrice)
    // printTradeExitLabel(bar_index, math.max(tpPrice, slPrice), posSize, ctEntryPrice, pnl)

// Print TP/SL box for current open trade
// if barstate.islastconfirmedhistory and strategy.position_size != 0
//     printTpSlNotHitBox(tradeEntryBar + 1, bar_index + 1, strategy.position_avg_price, slPrice, tpPrice)

// // =============================================================================
// // DEBUGGING
// // =============================================================================

// Data window plots
plotchar(prePullbackBullBreakout,   "prePullbackBullBreakout",  "")
plotchar(prePullbackBearBreakout,   "prePullbackBearBreakout",  "")
plotchar(barssincePullbackStart,    "barssincePullbackStart",   "")
plotchar(isCoralBullish,            "isCoralBullish",           "")
plotchar(isCoralBearish,            "isCoralBearish",           "")
plotchar(barssinceCoralflip,        "barssinceCoralflip",       "")
plotchar(isPullbackValid,           "isPullbackValid",          "")
plotchar(entryBreakout,             "entryBreakout",            "")
plotchar(slHit,                     "slHit",                    "")
plotchar(tpHit,                     "tpHit",                    "")
plotchar(slPrice,                   "slPrice",                  "")

// Label plots
// plotDebugLabels = false
// if plotDebugLabels
//     if bar_index == tradeEntryBar
//         printLabel(bar_index, "Position size: " + str.tostring(entryQty * close, "#.##"))