Chiến lược phá vỡ đám mây Ichimoku dựa trên lực lượng thị trường dài và ngắn


Ngày tạo: 2024-02-04 14:46:22 sửa đổi lần cuối: 2024-02-04 14:46:22
sao chép: 0 Số nhấp chuột: 685
1
tập trung vào
1617
Người theo dõi

Chiến lược phá vỡ đám mây Ichimoku dựa trên lực lượng thị trường dài và ngắn

Tổng quan

Chiến lược này là một chiến lược theo dõi xu hướng và kết hợp với cấu hình của chỉ số đám mây Ichimoku để đánh giá sức mạnh đa chiều của thị trường để phát hiện các cơ hội đột phá tiềm năng. Các thành phần quan trọng bao gồm khung đánh giá dựa trên đám mây Ichimoku, ATR Stop Loss, Stop Loss Percentage và cơ chế dừng tùy chọn.

Nguyên tắc chiến lược

Quyết định cốt lõi của chiến lược bao gồm hai phần, một là tín hiệu xu hướng dựa trên chỉ số đám mây Ichimoku để đánh giá sức mạnh của thị trường, và một là tín hiệu mạnh dựa trên khả năng đột phá tiềm năng.

Để đánh giá xu hướng, hãy đồng thời đáp ứng các điều kiện như: Chuyển đổi trên đường đi qua đường cơ sở cho thấy xu hướng đa đầu được thiết lập, Lagging Span cao hơn thực thể đường K cho thấy sức mạnh đa đầu hiện tại mạnh mẽ, giá cao hơn giá cao nhất trong đám mây cho thấy phá vỡ đường ray.

Đối với tín hiệu mạnh, phải đồng thời đáp ứng các điều kiện như hiển thị sức mạnh siêu mạnh với giá cao hơn giá thấp nhất trong đám mây, đường chuyển đổi và đường cơ sở đồng thời là nhiều đầu biểu thị sức mạnh đầy đủ.

Khi bất kỳ bộ điều kiện nào của hai loại điều kiện được kích hoạt, chỉ cần mở một vị trí với giá thị trường; Sau đó, theo quy tắc ATR, tỷ lệ phần trăm hoặc chỉ số đám mây Ichimoku, thiết lập theo dõi dừng lỗ để khóa lợi nhuận hơn nữa.

Phân tích lợi thế

Lợi thế lớn nhất của chiến lược này là sử dụng cả tính năng đánh giá xu hướng và đánh giá sức mạnh đa chiều của đám mây Ichimoku. So với các chỉ số như trung bình di chuyển đơn lẻ, đám mây Ichimoku có thể phản ánh sự tương phản sức mạnh của tình hình hiện tại, do đó cải thiện độ chính xác của tín hiệu.

Ngoài ra, kết hợp ATR và Stop Loss Percentage để quản lý rủi ro, bạn có thể kiểm soát tốt tổn thất đơn lẻ. Ngoài ra, cơ chế Stop Stop tùy chọn cũng làm cho lợi nhuận chiến lược ổn định hơn.

Phân tích rủi ro

Rủi ro chính của chiến lược là đám mây Ichimoku tự nó có một sự chậm trễ. Ngoài ra, tín hiệu mạnh mẽ là tính chất của việc theo dõi, có thể làm tăng khả năng chiến lược được đặt.

Để giảm nguy cơ gây ra sự chậm trễ, bạn có thể rút ngắn chu kỳ tham số của đám mây Ichimoku một cách thích hợp; đối với nguy cơ do tín hiệu mạnh gây ra, bạn cần tăng cường cài đặt theo dõi dừng thiệt hại để đối phó.

Hướng tối ưu hóa

Chiến lược này có thể được tối ưu hóa theo một số hướng sau:

  1. Kiểm tra dữ liệu từ các thị trường khác nhau để đánh giá sức mạnh và khả năng thích ứng của chiến lược

  2. Tối ưu hóa các thông số của đám mây Ichimoku để phù hợp hơn với thị trường cụ thể

  3. Thử các thuật toán học sâu như LSTM để giúp xác định cường độ tín hiệu đột phá

  4. Thêm chỉ số năng lượng, tránh khả năng bị chết đuối

Tóm tắt

Chiến lược này tích hợp các yếu tố phân tích thị trường có nhiều không gian, nắm bắt các xu hướng tiềm năng và quản lý rủi ro. Chiến lược này cân bằng hiệu quả lợi nhuận và khả năng kiểm soát. Mặc dù vẫn còn một số không gian tối ưu hóa, nhưng nói chung là một chiến lược theo dõi xu hướng rất thực tế.
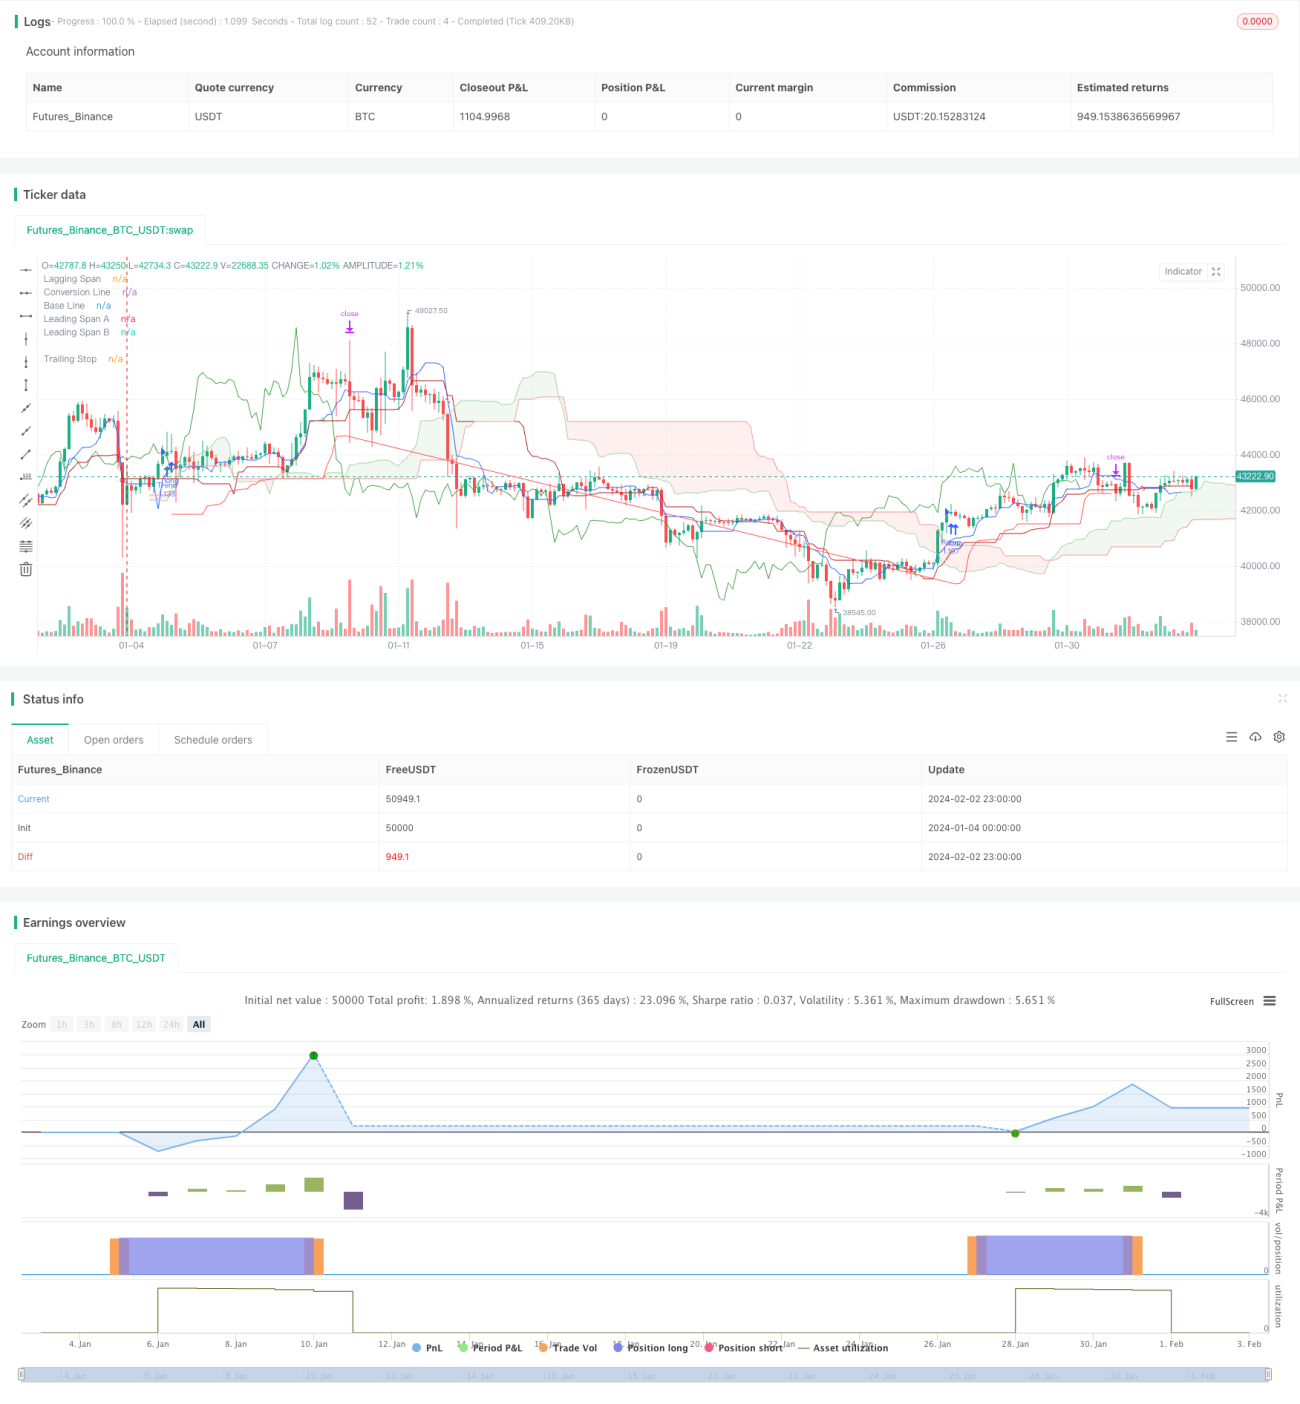
Mã nguồn chiến lược
/*backtest
start: 2024-01-04 00:00:00
end: 2024-02-03 00:00:00
period: 3h
basePeriod: 15m
exchanges: [{"eid":"Futures_Binance","currency":"BTC_USDT"}]
*/

// This source code is subject to the terms of the Mozilla Public License 2.0 at https://mozilla.org/MPL/2.0/
// © mikul_se
//@version=5
strategy("mikul's Ichimoku Cloud Strategy v 2.0", shorttitle="mikul's Ichi strat", overlay=true, margin_long=100, margin_short=100, default_qty_type = strategy.percent_of_equity, default_qty_value = 100)

// Strategy settings
strategySettingsGroup = "Strategy settings"
trailSource         = input.string(title="Trail Source", defval="Lows/Highs", options=["Lows/Highs", "Close", "Open"], confirm=true, group=strategySettingsGroup)
trailMethod         = input.string(title="Trail Method", defval="ATR", options=["ATR", "Percent", "Ichi exit"], confirm=true, tooltip="Ichi rules means it follows the rules of the Ichimoku cloud for exiting the trade.", group=strategySettingsGroup)
trailPercent        = input.float(title="Trail Percent", defval=10, minval=0.1, confirm=true, group=strategySettingsGroup)
swingLookback       = input.int(title="Lookback", defval=7, confirm=true, group=strategySettingsGroup)
atrPeriod           = input.int(title="ATR Period", defval=14, confirm=true, group=strategySettingsGroup)
atrMultiplier       = input.float(title="ATR Multiplier", defval=1.0, confirm=true, group=strategySettingsGroup)
addIchiExit         = input.bool(false, "Add Ichimoku exit", "You can use this to add Ichimoku cloud exit signals on top of Percent or ATR", group=strategySettingsGroup)
useTakeProfit       = input.bool(false, "Use Take Profit", confirm=true, group=strategySettingsGroup)
takeProfitPercent   = input.float(title="Take Profit Percentage", defval=5, minval=0.1, confirm=true, group=strategySettingsGroup)

// Ichimoku settings
ichimokuSettingsGroup = "Ichimoku settings"
conversionPeriods       = input.int(9, minval=1, title="Conversion Line Length", group=ichimokuSettingsGroup)
basePeriods             = input.int(26, minval=1, title="Base Line Length", group=ichimokuSettingsGroup)
laggingSpan2Periods     = input.int(52, minval=1, title="Leading Span B Length", group=ichimokuSettingsGroup)
displacement            = input.int(26, minval=1, title="Lagging Span", group=ichimokuSettingsGroup)
delta                   = input.int(26, minval=1, title="Delta", group=ichimokuSettingsGroup)

donchian(len) => math.avg(ta.lowest(len), ta.highest(len))
conversionLine = donchian(conversionPeriods)
baseLine       = donchian(basePeriods)
leadLine1      = math.avg(conversionLine, baseLine)
leadLine2      = donchian(laggingSpan2Periods)

uppercloud     = leadLine1[displacement-1]
bottomcloud    = leadLine2[displacement-1]

// Ichi exit variables and calculations 
delta2 = delta-3
average(len) => math.avg(ta.lowest(len), ta.highest(len))

conversion_line = average(conversionPeriods)
base_line       = average(basePeriods)
lead_line_a     = math.avg(conversion_line, base_line)
lead_line_b     = average(laggingSpan2Periods)
lagging_span    = close
lead_line_a_delta = lead_line_a[delta]
lead_line_b_delta = lead_line_b[delta]
lagging_span_delta = lagging_span[delta]
prisgris = hlc3[delta]
prisgris2 = hlc3[delta2]

// Declare trailing price variable (stores our trail stop value)
var float trailPrice    = na
float next_trailPrice   = na

// Get required trailing stop variables
atrValue       = ta.atr(atrPeriod) * atrMultiplier
swingLow       = ta.lowest(low, swingLookback)
swingHigh      = ta.highest(high, swingLookback)

// Ichi plotting
plot(conversionLine, color=#2962FF, title="Conversion Line")
plot(baseLine, color=#B71C1C, title="Base Line")
plot(close, offset=-displacement + 1, color=#43A047, title="Lagging Span")
p1 = plot(leadLine1, offset=displacement - 1, color=#A5D6A7, title="Leading Span A")
p2 = plot(leadLine2, offset=displacement - 1, color=#EF9A9A, title="Leading Span B")
fill(p1, p2, color=leadLine1 > leadLine2 ? color.rgb(67, 160, 71, 90) : color.rgb(244, 67, 54, 90))

// Plotting ichi crossover signals
ichiup = ta.crossover(conversionLine, baseLine)
ichidown = ta.crossover(baseLine, conversionLine)

plotshape(ichiup ? conversionLine : na, 'Ichi long 1', style=shape.circle, location=location.absolute, offset=0, color=#00ff00b0, size=size.tiny)
plotshape(ichidown ? conversionLine : na, 'Ichi short 1', style=shape.circle, location=location.absolute, offset=0, color=#ff1100c7, size=size.tiny)

// Pamp signal
signal5 = close > bottomcloud[displacement] and close > uppercloud[displacement] and close > high[displacement]
signal5b = close[1] <= bottomcloud[displacement+1] or close[1] <= uppercloud[displacement+1] or close <= high[displacement+1]
signal6 = close > bottomcloud and close > uppercloud and close > open
signal6b = close[1] <= bottomcloud[1] or close[1] <= uppercloud[1]
signal7 = leadLine1 > leadLine2
signal7b = leadLine1[1] <= leadLine2[1]
signal8 = conversionLine > baseLine

pamp = signal5 and signal6 and signal7 and signal8 and strategy.position_size == 0 and (signal5b or signal6b or signal7b)

// Trend signal
nsignal5 = close > close[displacement]
nsignal6 = close > bottomcloud and close > uppercloud and close > open
nsignal8 = ta.crossover(conversionLine, baseLine) and conversionLine > bottomcloud and conversionLine > uppercloud and baseLine > bottomcloud and baseLine > uppercloud

trend = nsignal5 and nsignal6 and nsignal8 and strategy.position_size == 0

plotshape(trend, style=shape.triangleup, location=location.belowbar, color=color.green)

if (trend or pamp)
    trailPrice := na
    strategy.entry(trend ? "Trend" : "Pamp", direction = strategy.long)

// Get trailing stop price
if trailMethod == "ATR"
    next_trailPrice := switch trailSource
        "Close" => strategy.position_size > 0 ? close - atrValue : close + atrValue
        "Open" => strategy.position_size > 0 ? open - atrValue : open + atrValue
        => strategy.position_size > 0 ? swingLow - atrValue : swingHigh + atrValue
else if trailMethod == "Percent"
    float percentMulti = strategy.position_size > 0 ? (100 - trailPercent) / 100 : (100 + trailPercent) / 100
    next_trailPrice := switch trailSource
        "Close" => close * percentMulti
        "Open" => open * percentMulti
        => strategy.position_size > 0 ? swingLow * percentMulti : swingHigh * percentMulti
else
    short_signal = (ta.crossunder(lagging_span, prisgris)) or ta.crossover(base_line, conversion_line) and ((close)) < ((lead_line_a)) or ta.crossunder(lagging_span, prisgris) or (ta.crossover(base_line, conversion_line) and ((lagging_span) < (lead_line_a)) and ((lagging_span) < (lead_line_b)))

    if short_signal
        strategy.close("Trend", "Ichi trend over")
        strategy.close("Pamp", "Ichi pamp over")
        alert("Sell")

if (addIchiExit)
    short_signal = (ta.crossunder(lagging_span, prisgris)) or ta.crossover(base_line, conversion_line) and ((close)) < ((lead_line_a)) or ta.crossunder(lagging_span, prisgris) or (ta.crossover(base_line, conversion_line) and ((lagging_span) < (lead_line_a)) and ((lagging_span) < (lead_line_b)))

    if short_signal
        strategy.close("Trend", "Ichi trend over")
        strategy.close("Pamp", "Ichi pamp over")
        alert("Sell")

// Check for trailing stop update
if strategy.position_size != 0 and barstate.isconfirmed
    if (next_trailPrice > trailPrice or na(trailPrice)) and strategy.position_size > 0
        trailPrice := next_trailPrice
        alert(message="Trailing Stop updated for " + syminfo.tickerid + ": " + str.tostring(trailPrice, "#.#####"), freq=alert.freq_once_per_bar_close)

    if (next_trailPrice < trailPrice or na(trailPrice)) and strategy.position_size < 0
        trailPrice := next_trailPrice
        alert(message="Trailing Stop updated for " + syminfo.tickerid + ": " + str.tostring(trailPrice, "#.#####"), freq=alert.freq_once_per_bar_close)

// Draw data to chart
plot(strategy.position_size != 0 ? trailPrice : na, color=color.red, title="Trailing Stop")

// Take Profit
float profitTarget = strategy.position_avg_price * (1 + takeProfitPercent / 100)

// Exit trade if stop is hit
strategy.exit(id="trend Exit", from_entry="Trend", stop=trailPrice, limit=useTakeProfit ? profitTarget : na)
strategy.exit(id="pamp Exit", from_entry="Pamp", stop=trailPrice, limit=useTakeProfit ? profitTarget : na)

if strategy.position_size == 0
    trailPrice = 0