Chiến lược theo dõi xu hướng dải Bollinger thích ứng hai chiều
Ngày tạo:
2024-02-04 15:30:46
sửa đổi lần cuối:
2024-02-04 15:30:46
sao chép:
4
Số nhấp chuột:
718
1
tập trung vào
1750
Người theo dõi
Tổng quan
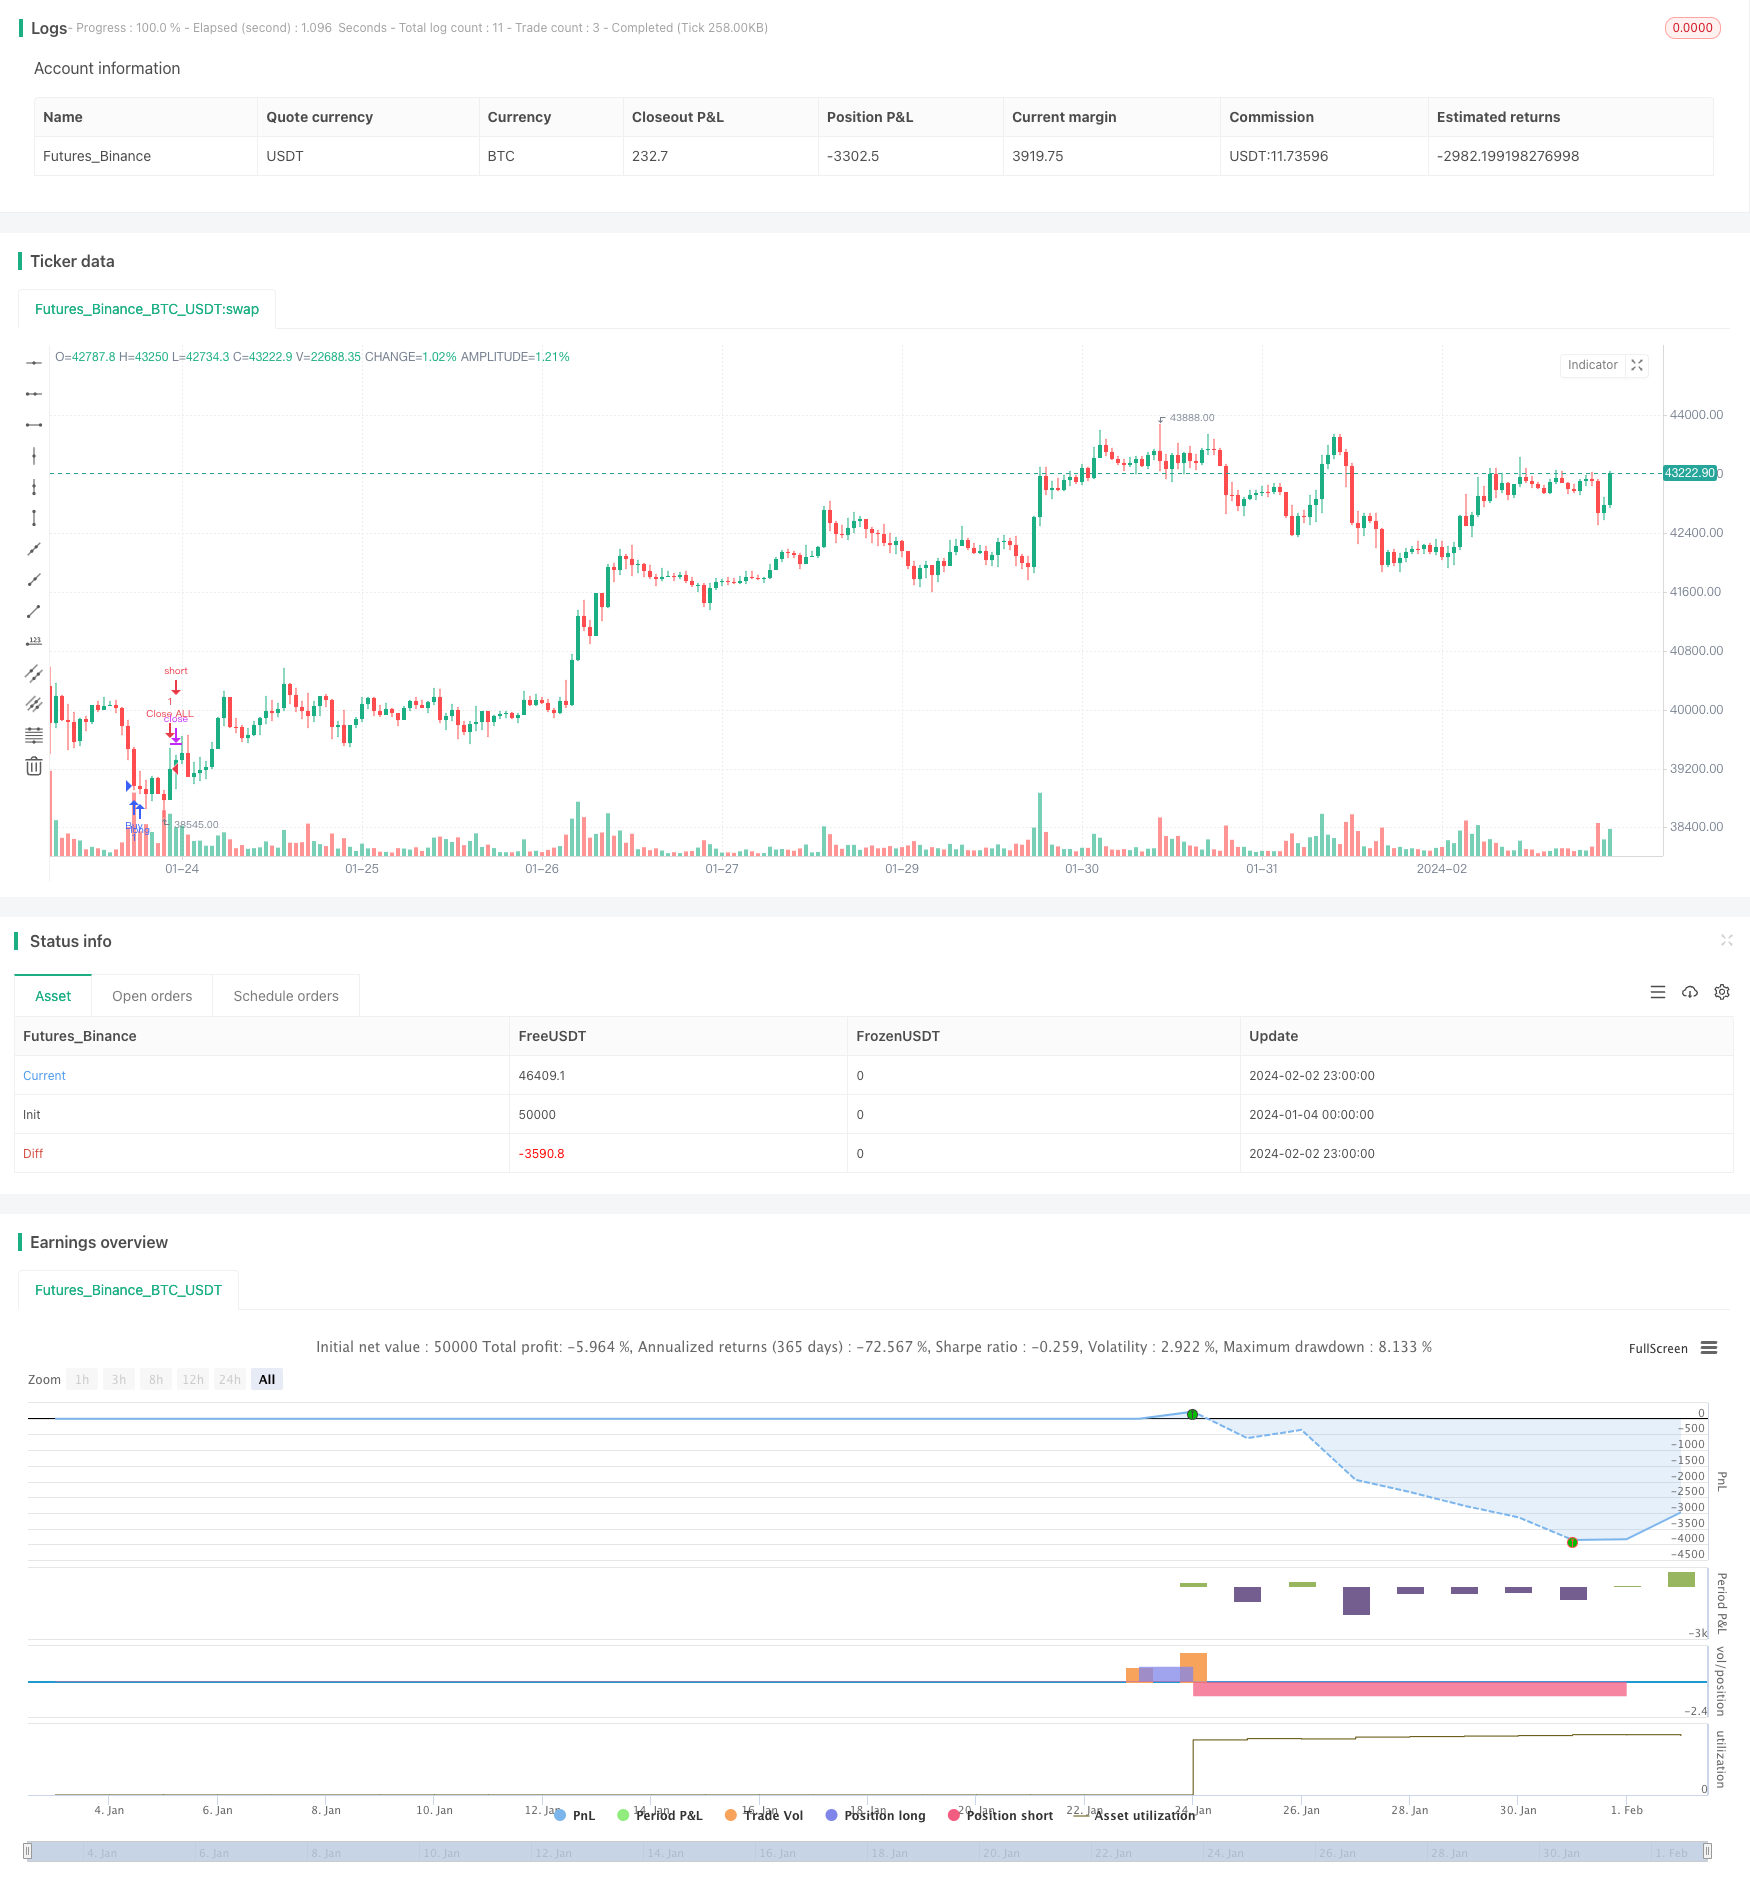
Chiến lược này sử dụng chỉ số Binance tự điều chỉnh hai chiều để xác định hướng xu hướng và kết hợp với đơn giá thị trường để theo dõi dừng lỗ, để đạt được hiệu quả cao trong giao dịch theo dõi xu hướng.
Nguyên tắc chiến lược
- Brin trong đường ray, đường ray trên và đường ray dưới theo một chu kỳ nhất định
- Xác định giá phá vỡ đường ray lên theo dõi nhiều, phá vỡ đường ray xuống theo dõi trống
- Nhập khẩu nhanh bằng đơn giá thị trường
- Thiết lập vị trí dừng lỗ, vị trí dừng để quản lý vị trí
Phân tích lợi thế
- Tạo ra các chỉ số BRI, nhạy cảm với sự biến động của thị trường, có thể nhanh chóng đánh giá xu hướng chuyển hướng
- Sử dụng đơn giá thị trường để nhanh chóng vào sân, giảm nguy cơ trượt
- Tự động dừng lỗ, kiểm soát rủi ro, khóa lợi nhuận
Phân tích rủi ro
- Blinking là một sự chậm trễ, không thể hoàn toàn tránh được sự đột phá giả.
- Không thể kiểm soát giá giao dịch bằng bảng giá thị trường
- Cần thiết lập các điểm dừng và dừng hợp lý
Hướng tối ưu hóa
- Điều chỉnh các tham số của dải Brin để tối ưu hóa sự nhạy cảm của xu hướng phán đoán
- Thêm các chỉ số như khối lượng giao dịch hoặc MACD để lọc đột phá giả
- Tối ưu hóa các thiết lập dừng lỗ và dừng chân
Tóm tắt
Chiến lược này tận dụng tối đa lợi thế của Bollinger Bands để xác định xu hướng và thay đổi, kết hợp với đơn giá thị trường ra thị trường nhanh chóng để theo dõi hai chiều, thu được lợi nhuận vượt trội trong khi kiểm soát rủi ro. Bằng cách tối ưu hóa các tham số Bollinger Bands hơn nữa, thêm các chỉ số lọc hỗ trợ, điều chỉnh logic dừng lỗ, các phương tiện khác, có thể đạt được hiệu suất chiến lược tốt hơn.
Mã nguồn chiến lược
/*backtest
start: 2024-01-04 00:00:00
end: 2024-02-03 00:00:00
period: 1h
basePeriod: 15m
exchanges: [{"eid":"Futures_Binance","currency":"BTC_USDT"}]
*/

// This source code is subject to the terms of the Mozilla Public License 2.0 at https://mozilla.org/MPL/2.0/
// © CryptoRox

//@version=4
//Paste the line below in your alerts to run the built-in commands.
//{{strategy.order.alert_message}}
strategy("Automated - Fibs with Market orders", "Strategy", true)

//Settings
testing = input(false, "Live")
//Use epochconverter or something similar to get the current timestamp.
starttime = input(1600976975, "Start Timestamp") * 1000
//Wait XX seconds from that timestamp before the strategy starts looking for an entry.
seconds = input(60, "Start Delay") * 1000
testPeriod = true


leverage = input(1, "Leverage")
tp = input(1.0, "Take Profit %") / leverage
dca = input(-1.0, "DCA when < %") / leverage *-1
fibEntry = input("1", "Entry Level", options=["1", "2", "3", "4", "5", "6", "7", "8", "9", "10"])

//Strategy Calls
equity = strategy.equity
avg = strategy.position_avg_price
symbol = syminfo.tickerid
openTrades = strategy.opentrades
closedTrades = strategy.closedtrades
size = strategy.position_size

//Fibs
lentt = input(60, "Pivot Length")
h = highest(lentt)
h1 = dev(h, lentt) ? na : h
hpivot = fixnan(h1)
l = lowest(lentt)
l1 = dev(l, lentt) ? na : l
lpivot = fixnan(l1)
z = 400
p_offset= 2
transp = 60
a=(lowest(z)+highest(z))/2
b=lowest(z)
c=highest(z)

fib0 = (((hpivot - lpivot)) + lpivot)
fib1 = (((hpivot - lpivot)*.21) + lpivot)
fib2 = (((hpivot - lpivot)*.3) + lpivot)
fib3 = (((hpivot - lpivot)*.5) + lpivot)
fib4 = (((hpivot - lpivot)*.62) + lpivot)
fib5 = (((hpivot - lpivot)*.7) + lpivot)
fib6 = (((hpivot - lpivot)* 1.00) + lpivot)
fib7 = (((hpivot - lpivot)* 1.27) + lpivot)
fib8 = (((hpivot - lpivot)* 2) + lpivot)
fib9 = (((hpivot - lpivot)* -.27) + lpivot)
fib10 = (((hpivot - lpivot)* -1) + lpivot)

notna = nz(fib10[60])
entry = 0.0
if fibEntry == "1"
    entry := fib10
if fibEntry == "2"
    entry := fib9
if fibEntry == "3"
    entry := fib0
if fibEntry == "4"
    entry := fib1
if fibEntry == "5"
    entry := fib2
if fibEntry == "6"
    entry := fib3
if fibEntry == "7"
    entry := fib4
if fibEntry == "8"
    entry := fib5
if fibEntry == "9"
    entry := fib6
if fibEntry == "10"
    entry := fib7
profit = avg+avg*(tp/100)
pause = 0
pause := nz(pause[1])
paused = time < pause

fill = 0.0
fill := nz(fill[1])
count = 0.0
count := nz(fill[1])

filled = count > 0 ? entry > fill-fill/100*dca : 0
signal = testPeriod and notna and not paused and not filled ? 1 : 0

neworder = crossover(signal, signal[1])
moveorder = entry != entry[1] and signal and not neworder ? true : false
cancelorder = crossunder(signal, signal[1]) and not paused
filledorder = crossunder(low[1], entry[1]) and signal[1]

last_profit = 0.0
last_profit := nz(last_profit[1])

// if neworder and signal
//     strategy.order("New", 1, 0.0001, alert_message='New Order|e=binancefuturestestnet s=btcusdt b=long q=0.0011 fp=' + tostring(entry))
// if moveorder
//     strategy.order("Move", 1, 0.0001, alert_message='Move Order|e=binancefuturestestnet s=btcusdt b=long c=order|e=binancefuturestestnet s=btcusdt b=long q=0.0011 fp=' + tostring(entry))
if filledorder and size < 1
    fill := entry
    count := count+1
    pause := time + 60000
    p = close+close*(tp/100)
    strategy.entry("Buy", 1, 1,  alert_message='Long|e=binancefuturestestnet s=btcusdt b=long q=0.0011 t=market')
if filledorder and size >= 1
    fill := entry
    count := count+1
    pause := time + 60000
    strategy.entry("Buy", 1, 1,  alert_message='Long|e=binancefuturestestnet s=btcusdt b=long q=0.0011 t=market')

// if cancelorder and not filledorder
//     pause := time + 60000
//     strategy.order("Cancel", 1, 0.0001,  alert_message='Cancel Order|e=binancefuturestestnet s=btcusdt b=long c=order')

if filledorder
    last_profit := profit

closeit = crossover(high, profit) and size >= 1
if closeit
    strategy.entry("Close ALL", 0, 0, alert_message='Close Long|e=binancefuturestestnet s=btcusdt b=long c=position t=market')
    count := 0
    fill := 0.0
    last_profit := 0.0

//Plots
// bottom = signal ? color.green : filled ? color.red : color.white
// plot(entry, "Entry", bottom)