Chiến lược giao dịch đường xu hướng dốc động
Tổng quan
Ý tưởng cốt lõi của chiến lược này là sử dụng độ lệch động để xác định hướng xu hướng của giá, kết hợp với phán đoán phá vỡ để tạo tín hiệu giao dịch. Cụ thể, nó sẽ theo dõi giá cao và thấp mới trong thời gian thực, tính toán độ lệch động dựa trên biến đổi giá trong các khoảng thời gian khác nhau, sau đó kết hợp với giá phá vỡ đường xu hướng để xác định tín hiệu không gian.
Nguyên tắc chiến lược
Chiến lược này bao gồm một số bước:
Xác định giá cao nhất và giá thấp nhất: theo dõi giá cao nhất và giá thấp nhất trong một chu kỳ nhất định (ví dụ như 20 đường K) để xác định xem có cao hay thấp mới không
Tính độ dốc động (Dynamic slope): Đếm số K-đường để ghi lại mức cao hoặc thấp mới, tính độ dốc động của các điểm cao và thấp sau một chu kỳ nhất định (ví dụ: 9 đường K)
Vẽ đường xu hướng: vẽ đường xu hướng tăng và giảm theo độ dốc động
Mở rộng và cập nhật đường xu hướng: Mở rộng và cập nhật đường xu hướng khi giá vượt qua đường xu hướng
Tín hiệu giao dịch: kết hợp với giá phá vỡ đường xu hướng, đánh giá các tín hiệu tháo và tháo
Lợi thế chiến lược
Chiến lược này có những ưu điểm sau:
Động lực để đánh giá xu hướng, linh hoạt để đối phó với sự thay đổi của thị trường
Có thể kiểm soát hợp lý dừng lỗ, thu hồi nhỏ
Các tín hiệu giao dịch đột phá rõ ràng và dễ thực hiện
Các tham số có thể tùy chỉnh, có khả năng thích ứng
Có cấu trúc mã rõ ràng, dễ hiểu và tái phát triển
Rủi ro và giải pháp
Chiến lược này cũng có một số rủi ro:
Các nhà phân tích cho rằng xu hướng có thể thay đổi theo thời gian, và các nhà phân tích cho rằng điều kiện lọc có thể được thêm vào.
Có thể có nhiều tín hiệu giả phá vỡ, điều chỉnh tham số thích hợp hoặc thêm điều kiện lọc
Rủi ro dừng lỗ có thể tăng mức độ dừng lỗ khi tình hình thay đổi mạnh
Không gian tối ưu hóa hạn chế, lợi nhuận hạn chế, phù hợp với giao dịch ngắn hạn
Hướng tối ưu hóa
Những nơi mà chúng tôi có thể cải thiện chính sách bao gồm:
Thêm nhiều chỉ số kỹ thuật để đánh giá các tín hiệu lọc
Tối ưu hóa các tham số, tìm các tham số tốt nhất
Cố gắng cải thiện chiến lược dừng lỗ để giảm rủi ro
Thêm chức năng tự động điều chỉnh độ dẻo
Thử kết hợp với các chiến lược khác để khám phá nhiều cơ hội hơn
Tóm tắt
Chiến lược này nói chung là một chiến lược ngắn hiệu quả dựa trên xu hướng phán đoán động và phá vỡ giao dịch. Nó đánh giá chính xác, rủi ro có thể kiểm soát được, phù hợp để nắm bắt cơ hội ngắn trong thị trường. Bằng cách tối ưu hóa các tham số hơn nữa và thêm các điều kiện lọc, tỷ lệ thắng và lợi nhuận của chiến lược có thể được nâng cao.
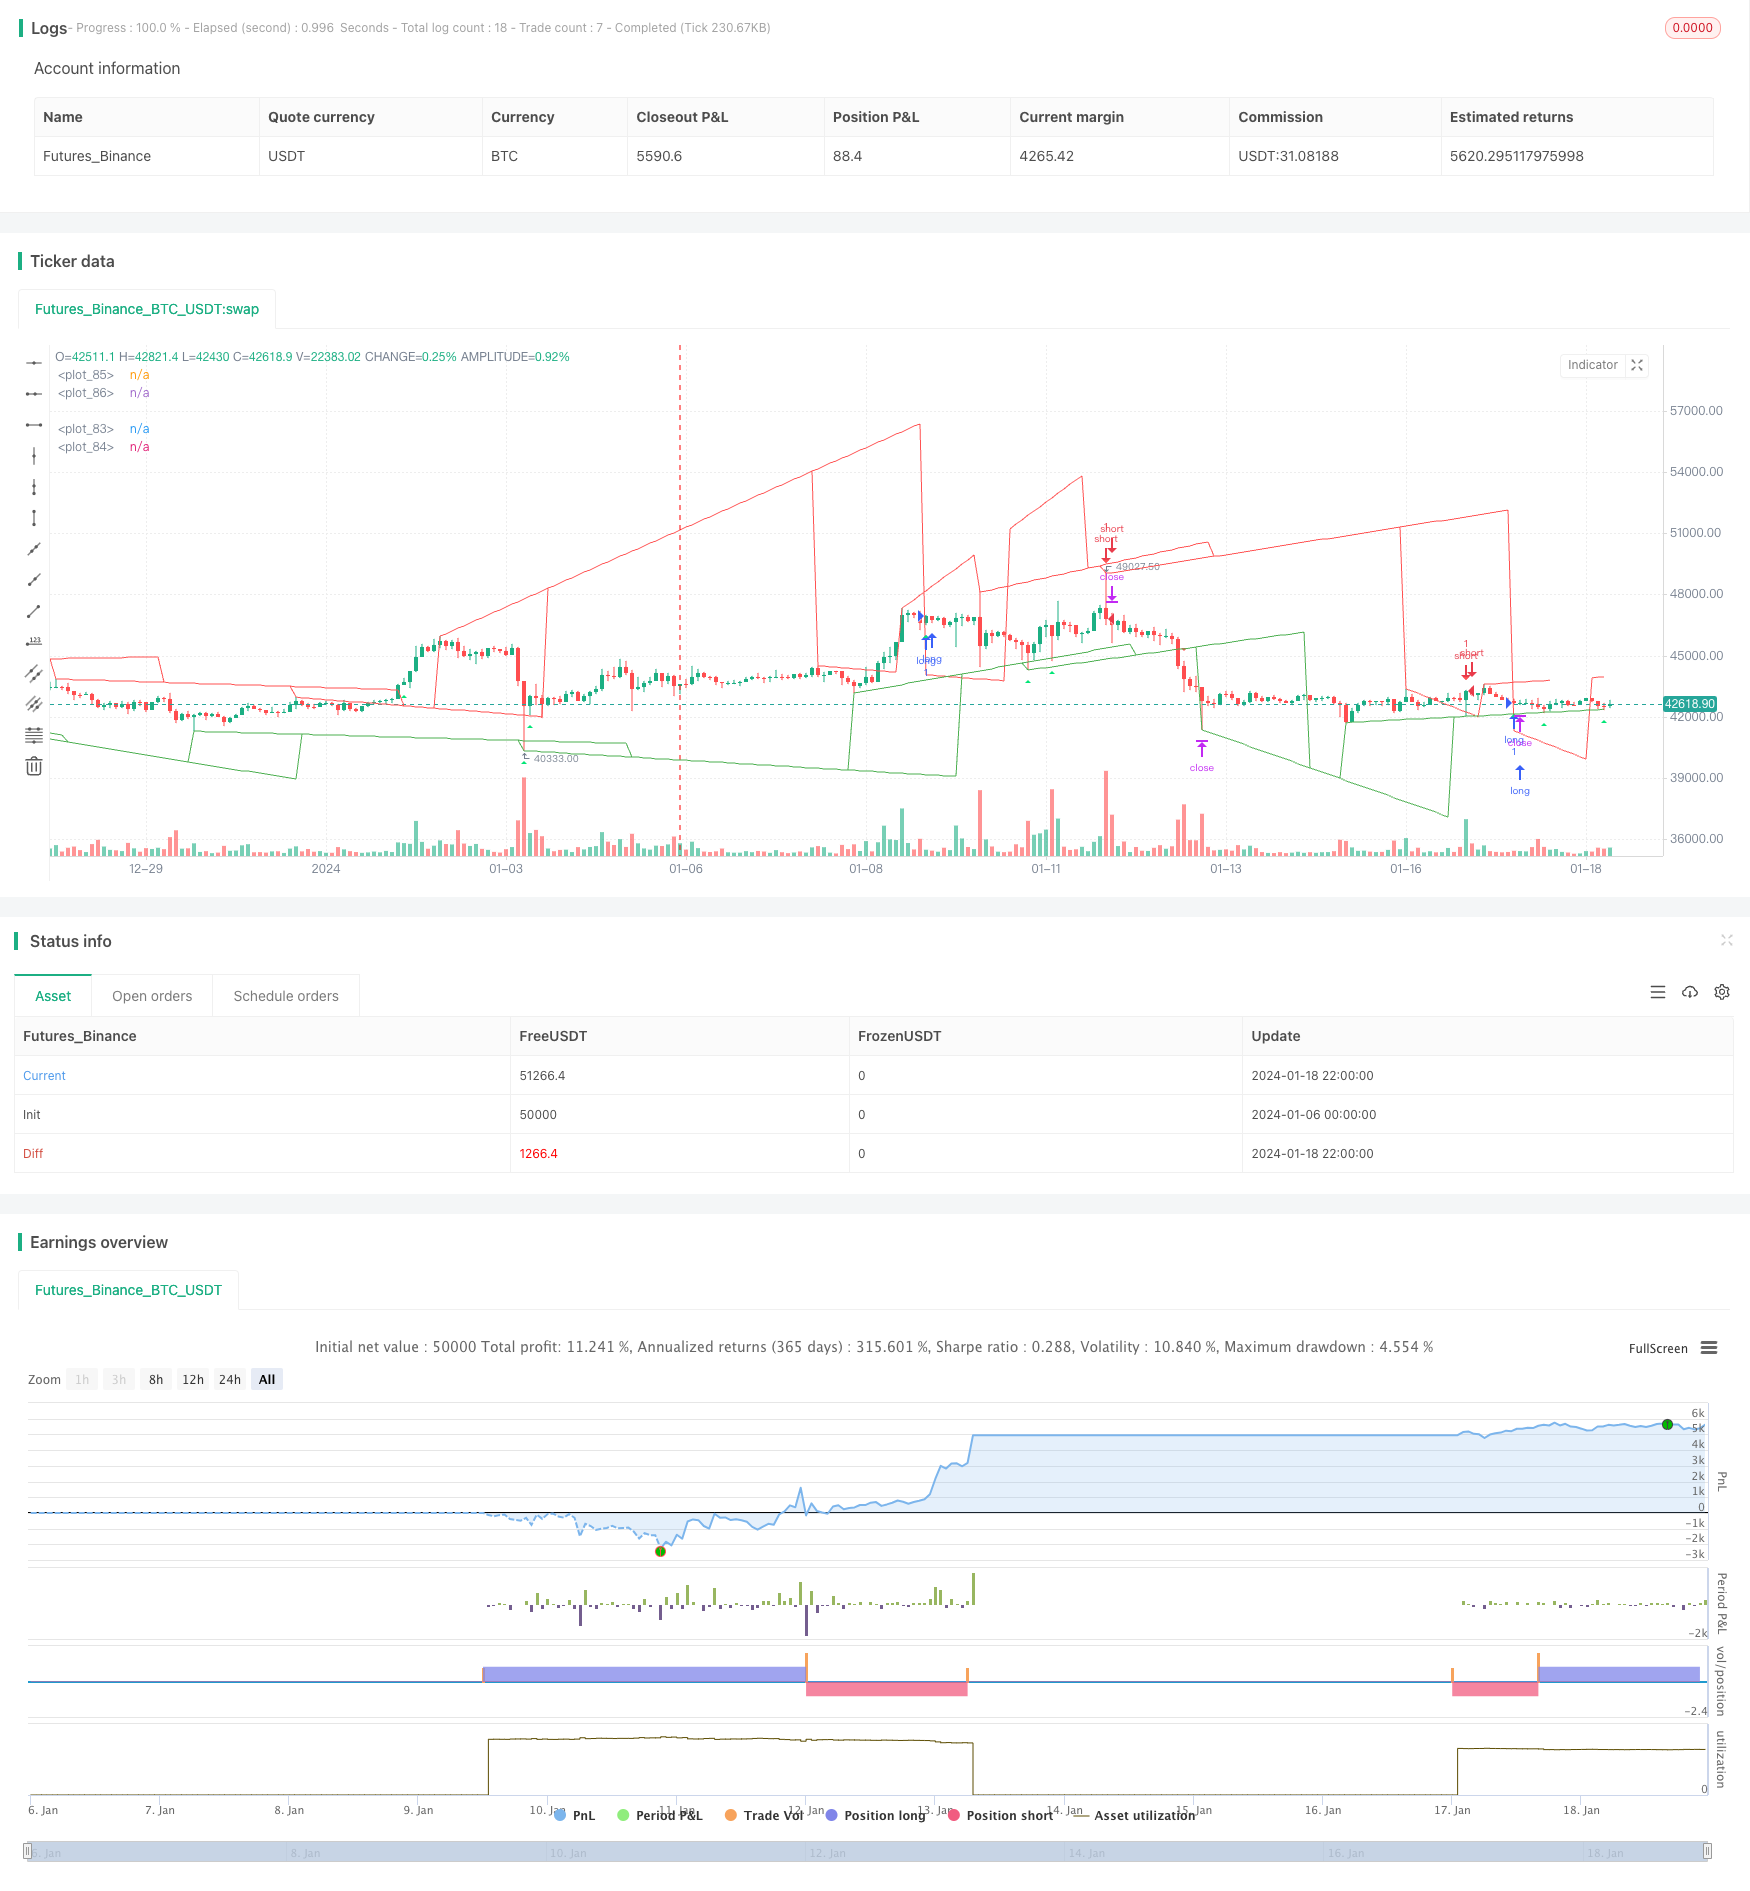
/*backtest
start: 2024-01-06 00:00:00
end: 2024-01-19 00:00:00
period: 2h
basePeriod: 15m
exchanges: [{"eid":"Futures_Binance","currency":"BTC_USDT"}]
*/

// This source code is subject to the terms of the Mozilla Public License 2.0 at https://mozilla.org/MPL/2.0/
// © pune3tghai

//Originally posted by matsu_bitmex

//tried adding alerts on plots and cleared the chart for a cleaner view.
//Publishing the script in hope of getting it improved by someone else.

//Added strategy code for easier calculations

//Needs work on TP and SL part.

//P.S - THE ORIGINAL CODE IS MUCH BETTER BUT I have tried to be more usable and understandable.

//@version=4
strategy("TrendLines with Alerts", overlay=true)     //study("TrendLines with Alerts", overlay=true)
//update

length1 = input(20)
check = input(9)
//length2 = input(200)


u=0.0
u := u[1]

l=0.0
l := l[1]

y=0.0
y := y[1]

yl=0.0
yl := yl[1]

angle = 0.0
angle := angle[1]

anglel = 0.0
anglel := anglel[1]

if (highest(length1) == high[check] and highest(length1) == highest(length1)[check] and barssince(barstate.isfirst) > check)
    u := high[check]


if (lowest(length1) == low[check] and lowest(length1) == lowest(length1)[check] and barssince(barstate.isfirst) > check)
    l := low[check]


p = round(barssince(u == high[check]))

pl = round(barssince(l == low[check]))

if p == 0 and barssince(barstate.isfirst) > check
    y := high[abs(p[1]+1+check)]

if pl == 0 and barssince(barstate.isfirst) > check
    yl := low[abs(pl[1]+1+check)]


if p == 0
    angle := (u-y)/p[1]

if pl == 0
    anglel := (l-yl)/pl[1]

uppertrend = u+ (p * angle)

lowertrend = l+ (pl * anglel)

extendup = if barssince(barstate.isfirst) > check
    uppertrend[check] + angle[check] * check*2

extenddown = if barssince(barstate.isfirst) > check
    lowertrend[check] + anglel[check] * check*2


//plot(l[offset]-u,color=red)
//plot(u[offset]-l,color = green )
plot(lowertrend, color = color.green, transp=30,offset = -check)
plot(extenddown, color = color.green, transp=100)
plot(uppertrend, color = color.red, transp=30, offset = -check)
plot(extendup, color = color.red, transp=100)
//plot(l[offset], color = red)

l1 = lowertrend
l2 = extenddown
u1 = uppertrend
u2 = extendup


l2sell = crossunder(high, l2)
u2buy = crossover(low, u2)
buy1 = (low<=lowertrend) and open>lowertrend and high>lowertrend and close>lowertrend
buy2 = (low<=extenddown) and open>extenddown and high>extenddown and close>extenddown
buy = buy1 or buy2 or u2buy
plotshape(series=buy, title="Buy", style=shape.triangleup, size=size.tiny, color=color.lime, location=location.belowbar)
sell1 = (high>=uppertrend) and open<uppertrend and low<uppertrend and close<uppertrend
sell2 = (high>=extendup) and open<extendup and low<extendup and close<extendup
sell = sell1 or sell2 or l2sell
plotshape(series=sell, title="Sell", style=shape.triangledown, size=size.tiny, color=color.red, location=location.abovebar)

longCond = buy
shortCond = sell

tp = input(0.2, title="Take Profit")

tpbuyval = valuewhen(buy, close, 1) + (tp/100)*(valuewhen(buy, close, 1))
tpsellval = valuewhen(sell, close, 1) - (tp/100)*(valuewhen(sell, close, 1))


sl = input(0.2, title="Stop Loss")
slbuyval = valuewhen(buy, close, 0) - (sl/100)*(valuewhen(buy, close, 0))
slsellval = valuewhen(sell, close, 0) + (sl/100)*(valuewhen(sell, close, 0))
// === STRATEGY ===
tradeType = input("BOTH", title="What trades should be taken : ", options=["LONG", "SHORT", "BOTH", "NONE"])

// stop loss
slPoints = input(defval=0, title="Initial Stop Loss Points (zero to disable)", minval=0)
tpPoints = input(defval=0, title="Initial Target Profit Points (zero for disable)", minval=0)

//>>>>>>>>>>>>>>>>>>>>>>>>>>>>>>>>>>>>>>>>>>>>>>>>>>>>>>>>>>>>>>>>>>>>>>>>>>>>>//

testStartYear = input(2019, "Backtest Start Year", minval=1980)
testStartMonth = input(1, "Backtest Start Month", minval=1, maxval=12)
testStartDay = input(1, "Backtest Start Day", minval=1, maxval=31)
testPeriodStart = timestamp(testStartYear, testStartMonth, testStartDay, 0, 0)

testStopYear = input(9999, "Backtest Stop Year", minval=1980)
testStopMonth = input(12, "Backtest Stop Month", minval=1, maxval=12)
testStopDay = input(31, "Backtest Stop Day", minval=1, maxval=31)
testPeriodStop = timestamp(testStopYear, testStopMonth, testStopDay, 0, 0)

testPeriod() =>
    time >= testPeriodStart and time <= testPeriodStop ? true : false

//<<<<<<<<<<<<<<<<<<<<<<<<<<<<<<<<<<<<<<<<<<<<<<<<<<<<<<<<<<<<<<<<<<<<<<<<<<<<<//

//
//set up exit parameters
TP = tpPoints > 0 ? tpPoints : na
SL = slPoints > 0 ? slPoints : na

// Make sure we are within the bar range, Set up entries and exit conditions
if testPeriod() and tradeType != "NONE"
    strategy.entry("long", strategy.long, when=longCond == true and tradeType != "SHORT")
    strategy.entry("short", strategy.short, when=shortCond == true and tradeType != "LONG")
    strategy.close("long", when=shortCond == true and tradeType == "LONG")
    strategy.close("short", when=longCond == true and tradeType == "SHORT")
    strategy.exit("XL", from_entry="long", profit=tpbuyval, loss=slbuyval)
    strategy.exit("XS", from_entry="short", profit=tpsellval, loss=slsellval)

// === /STRATEGY ===
//EOF


////ALERT SYNTEX
//alertcondition(longCond, title="Long", message="Killer Market")
//alertcondition(shortCond, title="Short", message="Poopy Market")