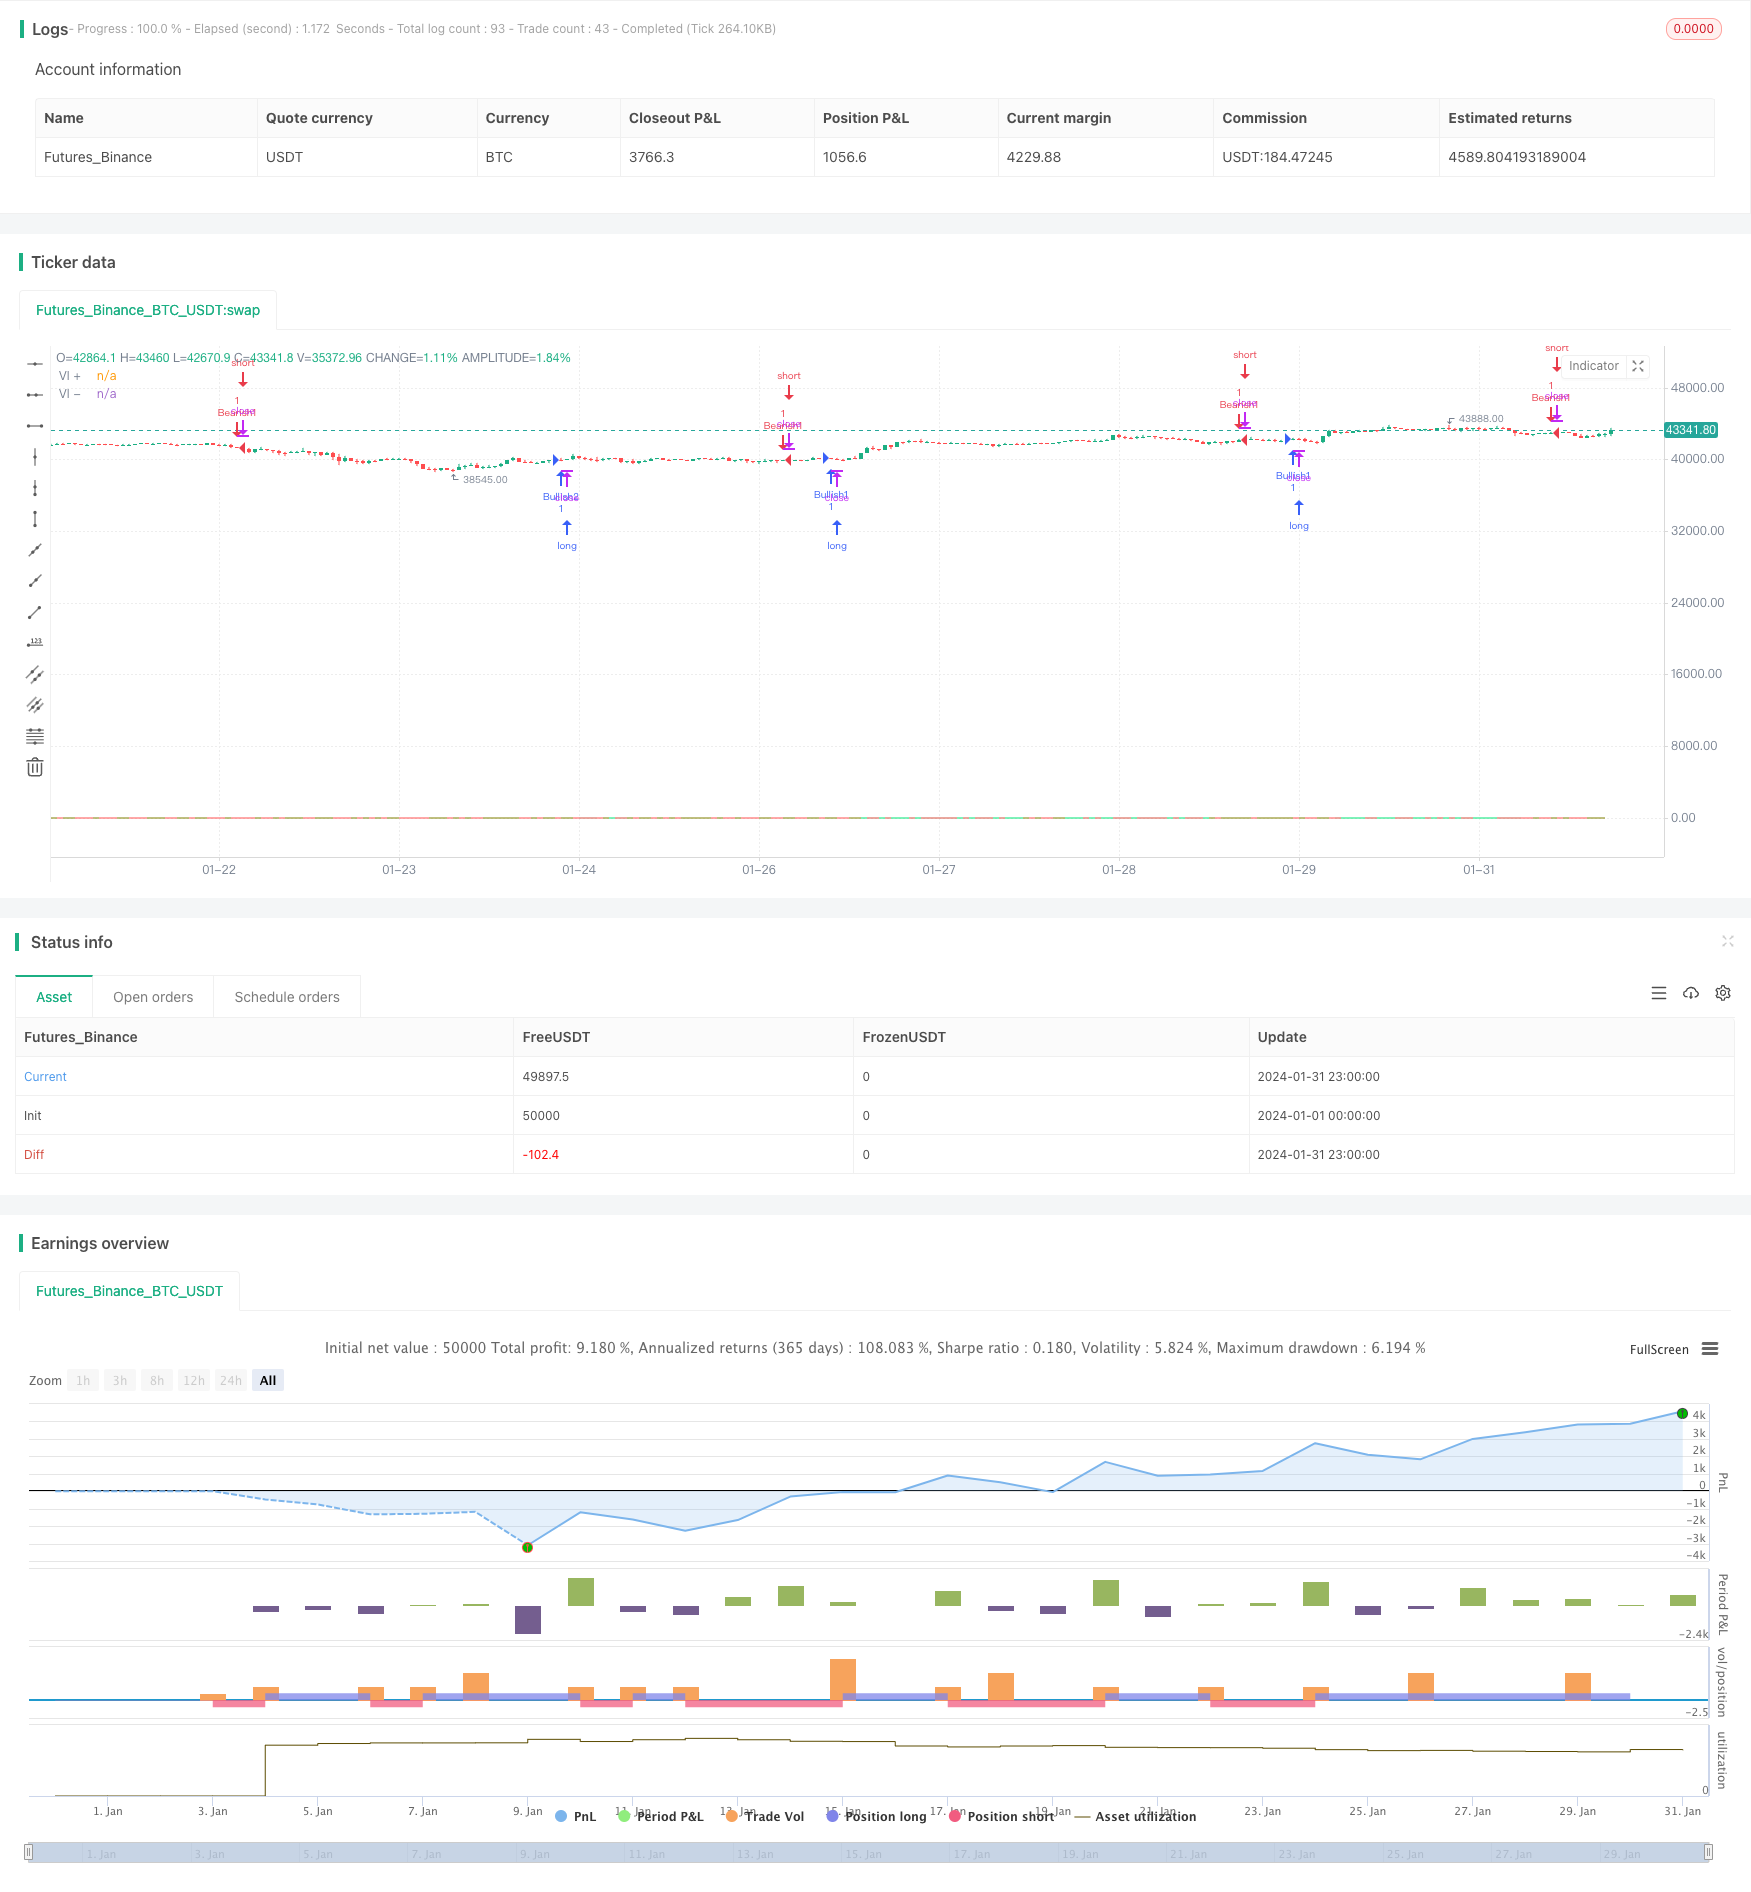
Chiến lược SMA dựa trên chỉ báo đảo chiều hình chữ V

Tổng quan
Chiến lược SMA dựa trên chỉ số đảo ngược kiểu V được tạo ra bằng cách tính toán chênh lệch tuyệt đối giữa giá cao nhất 14 ngày với giá thấp nhất ngày trước và giá thấp nhất 14 ngày với giá cao nhất ngày trước, sau đó tính toán trung bình di chuyển đơn giản 14 ngày của nó, tạo thành đường cong VI+ và VI- .
Nguyên tắc chiến lược
Các chỉ số cốt lõi của chiến lược này là VI+ và VI- . Trong đó, VI+ phản ánh sức mạnh đa đầu và VI- phản ánh sức mạnh không đầu. Công thức tính toán cụ thể như sau:
VMP = SUM(ABS(HIGH - LOW[1]),14)
VMM = SUM(ABS(LOW - HIGH[1]),14)
STR = SUM(ATR(1),14)
VI+ = VMP/STR
VI- = VMM/STR
Để loại bỏ sự dao động của đường cong, tính trung bình di chuyển đơn giản 14 ngày cho VI+ và VI- tương ứng, để có được SMA ((VI+) và SMA ((VI-)) tạo ra tín hiệu đa đầu khi đi qua SMA ((VI-)) trên SMA ((VI+); tạo ra tín hiệu đầu trống khi đi qua SMA ((VI+) dưới SMA ((VI-)).
Ngoài ra, chiến lược cũng kết hợp các trạng thái lên xuống của VI + và VI - để đánh giá xu hướng, do đó, lọc, chỉ làm nhiều khi xu hướng đi xuống và làm trống khi xu hướng đi lên.
Phân tích lợi thế
Chiến lược này kết hợp với tình trạng xu hướng và các dấu hiệu của VI, có thể lọc hiệu quả các tín hiệu giả mạo và tăng khả năng kiếm lợi nhuận.
Phân tích rủi ro
Chiến lược này có hai rủi ro chính:
Chỉ số VI có thể tạo ra tín hiệu sai lệch trong một số chu kỳ. Trong trường hợp này, cần kết hợp lọc xu hướng và dừng lỗ để kiểm soát rủi ro.
Thị trường có phí giao dịch cao và chi phí trượt không phù hợp với chiến lược này, sẽ làm giảm đáng kể không gian lợi nhuận.
Hướng tối ưu hóa
Chiến lược này có thể được tối ưu hóa theo các khía cạnh sau:
Tối ưu hóa các tham số chu kỳ của chỉ số VI, tìm kiếm sự kết hợp tham số tốt nhất.
Sử dụng phương pháp học máy để tự động nhận diện tín hiệu sai lệch, nâng cao chất lượng tín hiệu.
Kết hợp với các cơ chế dừng lỗ và quản lý tài chính để tối ưu hóa các cơ chế rút lui, kiểm soát tổn thất giao dịch đơn lẻ.
Tối ưu hóa lựa chọn giao dịch, chọn thị trường có chi phí giao dịch thấp hơn.
Tóm tắt
Chiến lược SMA dựa trên chỉ số đảo ngược kiểu V, tính toán thời gian mua và bán bằng cách tính toán các chỉ số VI + và VI - kết hợp với trạng thái xu hướng, là một chiến lược theo dõi xu hướng đáng tin cậy hơn. Ưu điểm của chiến lược này là chất lượng tín hiệu tốt, có thể lọc tiếng ồn hiệu quả.
/*backtest
start: 2024-01-01 00:00:00
end: 2024-01-31 23:59:59
period: 1h
basePeriod: 15m
exchanges: [{"eid":"Futures_Binance","currency":"BTC_USDT"}]
*/

//@version=4
//@author=SIDD
//Sidd-Vortex strategy is using Vortex formula  to generate 4 signals Bullish1 Bullish2 and Bearish1 Bearish2.

//Bullish1 signal is getting generated when smooth ma of VIP is crossing over smooth ma of VIM and smooth VIM is falling from previous bar smooth VIM

//Bullish2 signal is getting generated when smooth ma of VIP is crossing over smooth ma of VIM and smooth VIP is rising from previous bar smooth VIP

//Bearish1 signal is getting generated when smooth ma of VIM is crossing over smooth ma of VIP and smooth VIP is falling from previous bar smooth VIP

//Bearish2 signal is getting generated when smooth ma of VIM is crossing over smooth ma of VIP and smooth VIM is rising from previous bar smooth VIM

//This strategy can be converted into study un-commenting the plotshape and 15th line strategy replace with study and overlay=false

strategy(title = "SIDD-Vortex", shorttitle="SIDD-VORTEX", format=format.price, precision=4,overlay=true)
period_ = input(14, title="Period", minval=2)
len = input(14, minval=1, title="WMA Length")

VMP = sum( abs( high - low[1]), period_ ) // sum of absolute current high and previous low with 14 period default
VMM = sum( abs( low - high[1]), period_ ) // sum of absolute current low and previous high with 14 period default
STR = sum( atr(1), period_ )  //sum of daily atr for 14 days
VIP = VMP / STR
VIM = VMM / STR

simpleMAVIP=wma(VIP, len)
smmaVIP = 0.0
smmaVIP := na(smmaVIP[1]) ? simpleMAVIP : (smmaVIP[1] * (len - 1) + VIP) / len // finding the Smoothing average

simpleMAVIM=wma(VIM, len)
smmaVIM = 0.0
smmaVIM := na(smmaVIM[1]) ? simpleMAVIM : (smmaVIM[1] * (len - 1) + VIM) / len // finding the Smoothing average


risingVIP = rising(smmaVIP, 1)
fallingVIP = falling(smmaVIP, 1)

lineColorVIP = smmaVIP > 0.95 and risingVIP  ? color.lime : smmaVIP > 0.95 ? #d65240 : smmaVIP < 0.95 and fallingVIP ? color.red : color.olive

risingVIM = rising(VIM, 1)
fallingVIM = falling(VIM, 1)

lineColorVIM = smmaVIM > 0.95 and risingVIM  ? color.red : smmaVIM > 0.95 ? color.olive : smmaVIM < 0.95 and fallingVIM ? color.lime : #d65240

plot(VIP, title="VI +", color=lineColorVIP)
plot(VIM, title="VI -", color=lineColorVIM)

longCondition = crossover(smmaVIP,smmaVIM)
shortCondition = crossover(smmaVIM,smmaVIP)


if (longCondition and fallingVIM)
    strategy.entry("Bullish1", strategy.long)
if (shortCondition and fallingVIP)
    strategy.entry("Bearish1", strategy.short)

if (longCondition and risingVIP)
    strategy.entry("Bullish2", strategy.long)
if (shortCondition and risingVIM)
    strategy.entry("Bearish2", strategy.short)

//plotshape(longCondition and fallingVIM, color=color.lime, location=location.belowbar, style=shape.triangleup,size= size.large,text="Bullish",offset=0,textcolor=color.white)
//plotshape(longCondition and risingVIP, color=color.lime, location=location.belowbar, style=shape.labelup,size= size.large,text="Bullish",offset=0,textcolor=color.white)
//plotshape(Diff > 0 and direction>0, color=color.lime, location=location.belowbar, style=shape.arrowup,size= size.normal,offset=0)

//plotshape(shortCondition and fallingVIP  , color=color.red, location=location.abovebar, style=shape.triangledown, size= size.large,text="Bearish",offset=0,textcolor=color.white)
//plotshape( shortCondition and risingVIM  , color=color.red, location=location.abovebar, style=shape.labeldown, size= size.large,text="Bearish",offset=0,textcolor=color.white)


//band1 = hline(1.0  , title="Upper Line", linestyle=hline.style_dashed, linewidth=3, color=color.red)
//band0 = hline(0.5, title="Lower Line", linestyle=hline.style_dashed, linewidth=3, color=color.lime)
//fill(band1, band0, color=color.purple, transp=70)