Chiến lược giao dịch định lượng kỹ thuật đa chỉ số
Tổng quan
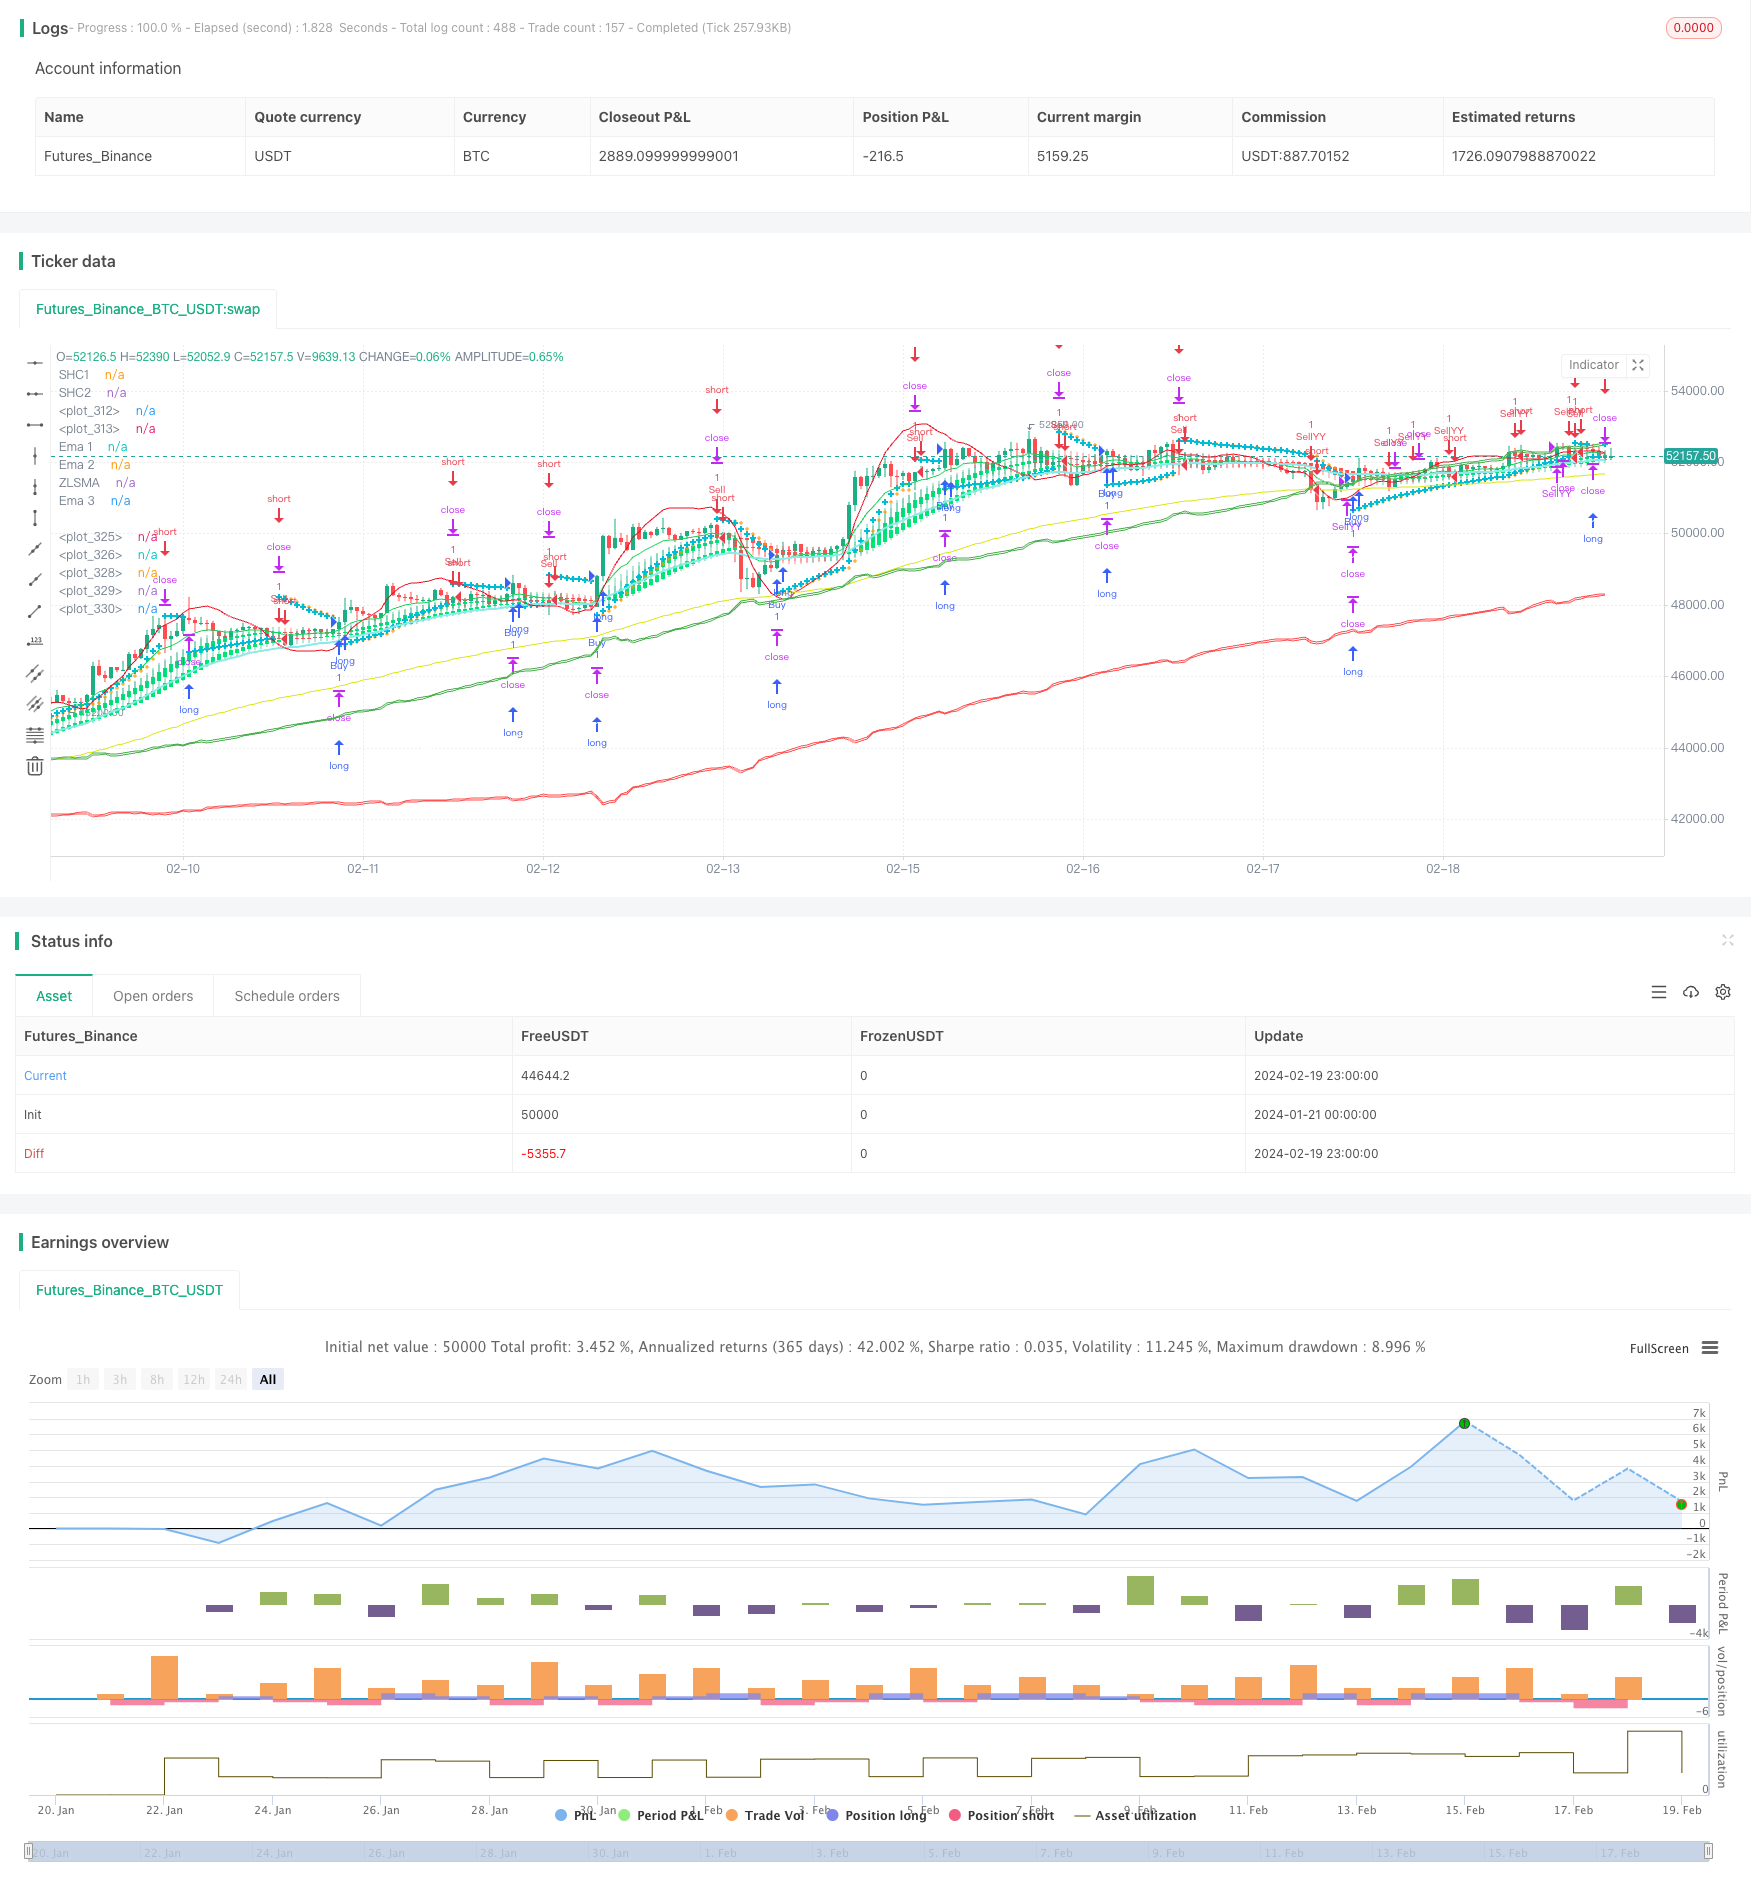
Chiến lược này sử dụng một loạt các chỉ số kỹ thuật, bao gồm hệ thống chuyển hướng đường parabola, xuất khẩu dư luận, trung bình di chuyển đơn giản, trung bình di chuyển chỉ số, đường cân bằng, v.v., để xác định các điểm mua và bán tiềm năng trên biểu đồ.
Nguyên tắc chiến lược
Chỉ số chính
- Hệ thống chuyển hướng parallax: được sử dụng để xác định điểm dừng và điểm vào tiềm năng
- Chiến lược xuất khẩu: dùng để xác định xu hướng
- Đường trung bình di chuyển đơn giản với độ trễ bằng không: cung cấp đường trung bình di chuyển có độ trễ thấp
- Chỉ số di chuyển trung bình: theo dõi xu hướng và biến động giá
- Đường trung bình mịn: tạo ra một đường trung bình mịn hơn
Tín hiệu giao dịch
- Khi hệ thống chuyển hướng đường phân cực hiển thị xu hướng tăng và giá vượt quá đường trung bình di chuyển của chỉ số 99, làm nhiều; khi hiển thị xu hướng giảm và giá thấp hơn đường trung bình di chuyển của chỉ số 99, làm rỗng
- Các tín hiệu liên quan đến chiến lược xuất khẩu của dư luận xác nhận xu hướng hơn nữa
- Đường trơn và đồng đều kết hợp với tín hiệu đường parabola để tránh phá vỡ giả
Quản lý rủi ro
- Thiết lập dừng và dừng
- Xem xét điều kiện mua lại, điều chỉnh vị trí linh hoạt
Phân tích lợi thế
Ưu điểm lớn nhất của chiến lược này nằm ở việc các chỉ số được tổng hợp đầy đủ, có thể xác định hướng xu hướng một cách hiệu quả. Hệ thống parallax xác định điểm đảo ngược tiềm năng; Chiến lược xuất khẩu ý kiến đánh giá xu hướng chính; Điểm trung bình di chuyển lọc tín hiệu giả. Nhiều chỉ số xác minh lẫn nhau, cải thiện đáng kể độ chính xác của tín hiệu.
Ngoài ra, chiến lược cũng có các cơ chế dừng và dừng để kiểm soát rủi ro. Đường trơn đều cũng được sử dụng để tránh nhiễu nhiễu ngắn hạn. Điều này làm cho chiến lược ổn định.
Phân tích rủi ro
Do phụ thuộc nhiều vào các chỉ số đánh giá, chiến lược này sẽ gặp khó khăn khi các chỉ số này phát ra tín hiệu xung đột. Ngoài ra, cài đặt tham số không đúng cũng có thể ảnh hưởng xấu đến giao dịch.
Ngoài ra, giao dịch kỹ thuật có một số rủi ro, không thể hoàn toàn tránh thua lỗ.
Hướng tối ưu hóa
- Kiểm tra và tối ưu hóa các tham số chỉ số để tìm sự kết hợp tốt nhất
- Tham gia thuật toán học máy, sử dụng mô hình đào tạo dữ liệu lớn để nâng cao hơn nữa độ chính xác của tín hiệu
- Xác định tình hình thị trường, động thái điều chỉnh vị trí và đường dừng lỗ kết hợp với các chỉ số cảm xúc, thông tin tin tức
- Tối ưu hóa logic điều kiện mua đặt lại để phát hiện tín hiệu linh hoạt hơn và liên tục
Tóm tắt
Chiến lược này tích hợp nhiều chỉ số kỹ thuật, nhận dạng tín hiệu giao dịch thông qua các chỉ số. Ưu điểm là tín hiệu có độ chính xác cao, ổn định. Đồng thời, các biện pháp kiểm soát rủi ro được đưa ra. Nhìn chung, đây là một chương trình giao dịch đáng xem xét.
/*backtest
start: 2024-01-21 00:00:00
end: 2024-02-20 00:00:00
period: 1h
basePeriod: 15m
exchanges: [{"eid":"Futures_Binance","currency":"BTC_USDT"}]
*/


//@version=5
strategy("CE-ZLSMA-EMA-SAR-SHC", overlay=true)

// Parabolic SAR Strategy
start = input(0.02)
increment = input(0.02)
maximum = input(0.2)

var bool uptrend = na
var float EP = na
var float SAR = na
var float AF = start
var float nextBarSAR = na
var bool longSar = false
var bool shortSar = false
//input smoothed HAC 1
len=input.int(title="Length SHC1", defval = 10)
o=ta.ema(open,len)
c=ta.ema(close,len)
h=ta.ema(high,len)
l=ta.ema(low,len)

haclose = (o+h+l+c)/4
var haopen = 0.0
if na(haopen[1])
    haopen := (o + c) / 2
else
    haopen := (haopen[1] + haclose[1]) / 2


hahigh = math.max (h, math.max(haopen,haclose))
halow = math.min (l, math.min(haopen,haclose))

len2=input(10)
o2=ta.ema(haopen, len2)
c2=ta.ema(haclose, len2)
h2=ta.ema(hahigh, len2)
l2=ta.ema(halow, len2)

col=o2>c2 ? color.red : color.lime
bool shc1Green = o2 > c2
bool shc1Lime = o2 < c2
//input smoothed HAC 1
lenSHC2=input.int(title="Length SHC2 ", defval = 20)
oShc2=ta.ema(open,lenSHC2)
cShc2=ta.ema(close,lenSHC2)
hShc2=ta.ema(high,lenSHC2)
lShc2=ta.ema(low,lenSHC2)

hacloseShc2 = (oShc2+hShc2+lShc2+cShc2)/4
var haopenShc2 = 0.0
if na(haopenShc2[1])
    haopenShc2 := (oShc2 + cShc2) / 2
else
    haopenShc2 := (haopenShc2[1] + hacloseShc2[1]) / 2


hahighShc2 = math.max (hShc2, math.max(haopenShc2,hacloseShc2))
halowShc2 = math.min (lShc2, math.min(haopenShc2,hacloseShc2))

len2Shc2=input(10)
o2Shc2=ta.ema(haopenShc2, len2Shc2)
c2Shc2=ta.ema(hacloseShc2, len2Shc2)
h2Shc2=ta.ema(hahighShc2, len2Shc2)
l2Shc2=ta.ema(halowShc2, len2Shc2)

colShc2=o2Shc2>c2Shc2 ? color.red : color.lime
bool shc2Green = o2Shc2 > c2Shc2
bool shc2Lime = o2Shc2 < c2Shc2
//end smooth

bool shcGree = shc1Green and shc2Green
bool shcLime = shc1Lime and shc2Lime

//zlsma
lengthZlsma = input.int(title="Length", defval=32)
offset = input.int(title="Offset", defval=0)
src = input(close, title="Source")
lsma = ta.linreg(src, lengthZlsma, offset)
lsma2 = ta.linreg(lsma, lengthZlsma, offset)
eq= lsma-lsma2
zlsma = lsma+eq
// ema 10
len4 = input.int(10, minval=1, title="Length")
src4 = input.source(close, title="Source")
out4 = ta.ema(src4, len4)
//End of format

// ema 34
len5 = input.int(34, minval=1, title="Length")
src5 = input.source(close, title="Source")
out5 = ta.ema(src5, len5)
//end ema 34

// ema 99
len6 = input.int(99, minval=1, title="Length")
src6 = input.source(close, title="Source")
out6 = ta.ema(src6, len6)
// end ema 99

//kiem tra dieu kien gia dong cua lon hon ema99 thi moi me lenh long
bool onEma99 = close > out6
bool downEma99 = open < out6

if bar_index > 0
    firstTrendBar = false
    SAR := nextBarSAR
    if bar_index == 1
        float prevSAR = na
        float prevEP = na
        lowPrev = low[1]
        highPrev = high[1]
        closeCur = close
        closePrev = close[1]
        if closeCur > closePrev
            uptrend := true
            EP := high
            prevSAR := lowPrev
            prevEP := high
        else
            uptrend := false
            EP := low
            prevSAR := highPrev
            prevEP := low
        firstTrendBar := true
        SAR := prevSAR + start * (prevEP - prevSAR)
    if uptrend
		if SAR > low
			firstTrendBar := true
			uptrend := false
			SAR := math.max(EP, high)
			EP := low
			AF := start
	else
		if SAR < high
			firstTrendBar := true
			uptrend := true
			SAR := math.min(EP, low)
			EP := high
			AF := start
	if not firstTrendBar
		if uptrend
			if high > EP
				EP := high
				AF := math.min(AF + increment, maximum)
		else
			if low < EP
				EP := low
				AF := math.min(AF + increment, maximum)
	if uptrend
		SAR := math.min(SAR, low[1])
		if bar_index > 1
			SAR := math.min(SAR, low[2])
	else
		SAR := math.max(SAR, high[1])
		if bar_index > 1
			SAR := math.max(SAR, high[2])
	nextBarSAR := SAR + AF * (EP - SAR)
	if barstate.isconfirmed
		if uptrend
			// log.info("true")
			strategy.entry("ParSE", strategy.short, stop=nextBarSAR, comment="ParSE")
			strategy.cancel("ParLE")
			shortSar := false
			longSar := true
		else
			// log.info("false")
			strategy.entry("ParLE", strategy.long, stop=nextBarSAR, comment="ParLE")
			strategy.cancel("ParSE")
			longSar := false
			shortSar := true

// Chandelier Exit Strategy
length = input.int(title="ATR Period",  defval=1)
mult = input.float(title="ATR Multiplier",  step=0.1, defval=1.1)
showLabels = input.bool(title="Show Buy/Sell Labels ?",  defval=true)
useClose = input.bool(title="Use Close Price for Extremums ?",  defval=true)
highlightState = input.bool(title="Highlight State ?",  defval=true)

atr = mult * ta.atr(length)

longStop = (useClose ? ta.highest(close, length) : ta.highest(length)) - atr
longStopPrev = nz(longStop[1], longStop)
longStop := close[1] > longStopPrev ? math.max(longStop, longStopPrev) : longStop

shortStop = (useClose ? ta.lowest(close, length) : ta.lowest(length)) + atr
shortStopPrev = nz(shortStop[1], shortStop)
shortStop := close[1] < shortStopPrev ? math.min(shortStop, shortStopPrev) : shortStop


var int dir = 1
dir := close > shortStopPrev ? 1 : close < longStopPrev ? -1 : dir

var bool longOpened = false
var bool shortOpended = false
// Entry and exit logic
if (dir == 1)
	if longSar
		if not longOpened
			strategy.close("Sell", disable_alert = true)
    		strategy.order("Buy", strategy.long)
			longOpened := true
			shortOpended := false

if (dir == -1)
	if shortSar
		if not shortOpended
			strategy.close("Buy", disable_alert = true)
			strategy.order("Sell", strategy.short)
			shortOpended := true
			longOpened := false


//strategy YY
// ~~~~~~~~~~~ INPUTS ~~~~~~~~~~~ //
lenYY = input.int(80, "Trend Length:", tooltip="How far back should we span this indicator?\nThis length effects all lengths of the indicator")
purchaseSrc = input.source(close, "Purchase Source (Long and Short):", tooltip="What source needs to exit the purchase zone for a purchase to happen?")
exitSrc = input.source(close, "Exit Source (Long and Short):", tooltip="What source needs to hit a exit condition to stop the trade (Take profit, Stop Loss or hitting the other sides Purchase Zone)?")
useTakeProfit = input.bool(true, "Use Take Profit", tooltip="Should we take profit IF we cross the basis line and then cross it AGAIN?")
useStopLoss = input.bool(true, "Use Stop Loss", tooltip="Stop loss will ensure you don't lose too much if its a bad call")
stopLossMult = input.float(0.1, "Stoploss Multiplier %:", tooltip="How far from the purchase lines should the stop loss be")
resetCondition = input.string("Entry", "Reset Purchase Availability After:", options=["Entry", "Stop Loss", "None"],
 tooltip="If we reset after a condition is hit, this means we can purchase again when the purchase condition is met. \n" +
 "Otherwise, we will only purchase after an opposite signal has appeared.\n" +
 "Entry: means when the close enters the purchase zone (buy or sell).\n" +
 "Stop Loss: means when the close hits the stop loss location (even when were out of a trade)\n" +
 "This allows us to get more trades and also if our stop loss initally was hit but it WAS a good time to purchase, we don't lose that chance.")

// ~~~~~~~~~~~ VARIABLES ~~~~~~~~~~~ //
var bool longStart = na
var bool longAvailable = na
var bool longTakeProfitAvailable = na
var bool longStopLoss = na
var bool shortStart = na
var bool shortAvailable = na
var bool shortTakeProfitAvailable = na
var bool shortStopLoss = na

resetAfterStopLoss = resetCondition == "Stop Loss"
resetAfterEntry = resetCondition == "Entry"

// ~~~~~~~~~~~ CALCULATIONS ~~~~~~~~~~~ //
// Mid Line
midHigh = ta.vwma(ta.highest(high, lenYY), lenYY)
midLow = ta.vwma(ta.lowest(low, lenYY), lenYY)
mid = math.avg(midHigh, midLow)
midSmoothed = ta.ema(mid, lenYY)

//Volume Filtered
avgVol = ta.vwma(volume, lenYY)
volDiff = volume / avgVol
midVolSmoothed = ta.vwma(midSmoothed * volDiff, 3)

//RSI Filtered
midDifference = ta.sma(midHigh - midLow, lenYY)
midRSI = ta.rsi(midVolSmoothed, lenYY) * 0.01
midAdd = midRSI * midDifference

//Calculate Zones
purchaseZoneHigh = midSmoothed + midAdd
purchaseZoneLow = midSmoothed - midAdd
purchaseZoneBasis = math.avg(purchaseZoneHigh, purchaseZoneLow)

//Create Stop Loss Locations
stopLossHigh = purchaseZoneHigh * (1 + (stopLossMult * 0.01))
stopLossLow = purchaseZoneLow * (1 - (stopLossMult * 0.01))

// ~~~~~~~~~~~ PURCHASE CALCULATIONS ~~~~~~~~~~~ //
//Long
longEntry = ta.crossunder(purchaseSrc, purchaseZoneLow)
longStart := ta.crossover(purchaseSrc, purchaseZoneLow) and longAvailable
longAvailable := ta.crossunder(purchaseSrc, purchaseZoneHigh) or (resetAfterStopLoss and longStopLoss) or (resetAfterEntry and longEntry) ? true : longStart ? false : longAvailable[1]
longEnd = ta.crossover(exitSrc, purchaseZoneHigh)
longStopLoss := ta.crossunder(exitSrc, stopLossLow)
longTakeProfitAvailable := ta.crossover(exitSrc, purchaseZoneBasis) ? true : longEnd ? false : longTakeProfitAvailable[1]
longTakeProfit = ta.crossunder(exitSrc, purchaseZoneBasis) and longTakeProfitAvailable

//Short
shortEntry = ta.crossover(purchaseSrc, purchaseZoneHigh)
shortStart := ta.crossunder(purchaseSrc, purchaseZoneHigh) and shortAvailable
shortAvailable := ta.crossover(purchaseSrc, purchaseZoneLow) or (resetAfterStopLoss and shortStopLoss) or (resetAfterEntry and shortEntry)? true : shortStart ? false : shortAvailable[1]
shortEnd = ta.crossunder(exitSrc, purchaseZoneLow)
shortStopLoss := ta.crossover(exitSrc, stopLossHigh)
shortTakeProfitAvailable := ta.crossunder(exitSrc, purchaseZoneBasis) ? true : shortEnd ? false : shortTakeProfitAvailable[1]
shortTakeProfit = ta.crossover(exitSrc, purchaseZoneBasis) and shortTakeProfitAvailable

// ~~~~~~~~~~~ STRATEGY ~~~~~~~~~~~ //
var bool openLongYY = false
var bool openShortYY = false
if (longStart)
    strategy.order("BuyYY", strategy.long)
	strategy.close("SellYY", disable_alert = true)
	openLongYY := true
	openShortYY := false
else if (longEnd or (useStopLoss and longStopLoss) or (useTakeProfit and longTakeProfit))
    strategy.close("BuyYY", disable_alert = true)

if (shortStart)
	strategy.close("BuyYY", disable_alert = true)
    strategy.order("SellYY", strategy.short)
	openShortYY := true
	openLongYY := false
else if (shortEnd or (useStopLoss and shortStopLoss) or (useTakeProfit and shortTakeProfit))
    strategy.close("SellYY", disable_alert = true)

// ~~~~~~~~~~~ ALERTS ~~~~~~~~~~~ //
// if longStart or (longEnd or (useStopLoss and longStopLoss) or (useTakeProfit and longTakeProfit)) or shortStart or (shortEnd or (useStopLoss and shortStopLoss) or (useTakeProfit and shortTakeProfit))
//     alert("{{strategy.order.action}} | {{ticker}} | {{close}}", alert.freq_once_per_bar)

// Plotting
plot(SAR, style=plot.style_cross, linewidth=1, color=color.orange)
plot(nextBarSAR, style=plot.style_cross, linewidth=3, color=color.aqua)
plot(zlsma, color=color.rgb(235, 15, 33), linewidth=1, title = "ZLSMA")

plot(out4, color=color.rgb(24, 209, 85), title="Ema 1")
plot(out5, color=color.rgb(139, 234, 231), linewidth = 2, title="Ema 2")
plot(out6, color=color.rgb(219, 230, 18), title="Ema 3")

plotcandle(o2, h2, l2, c2, title="SHC1", color=col)
plotcandle(o2Shc2, hShc2, l2Shc2, c2Shc2, title="SHC2", color=col)


// ~~~~~~~~~~~ PLOTS YY ~~~~~~~~~~~ //
shortLine = plot(purchaseZoneHigh, color=color.green)
shortStopLossLine = plot(stopLossHigh, color=color.green) //color=color.rgb(0, 97, 3)
fill(shortLine, shortStopLossLine, color = color.new(color.green, 90))
plot(purchaseZoneBasis, color=color.white)
longLine = plot(purchaseZoneLow, color=color.red)
longStopLossLine = plot(stopLossLow, color=color.red) //color=color.rgb(105, 0, 0)
fill(longLine, longStopLossLine, color=color.new(color.red, 90))