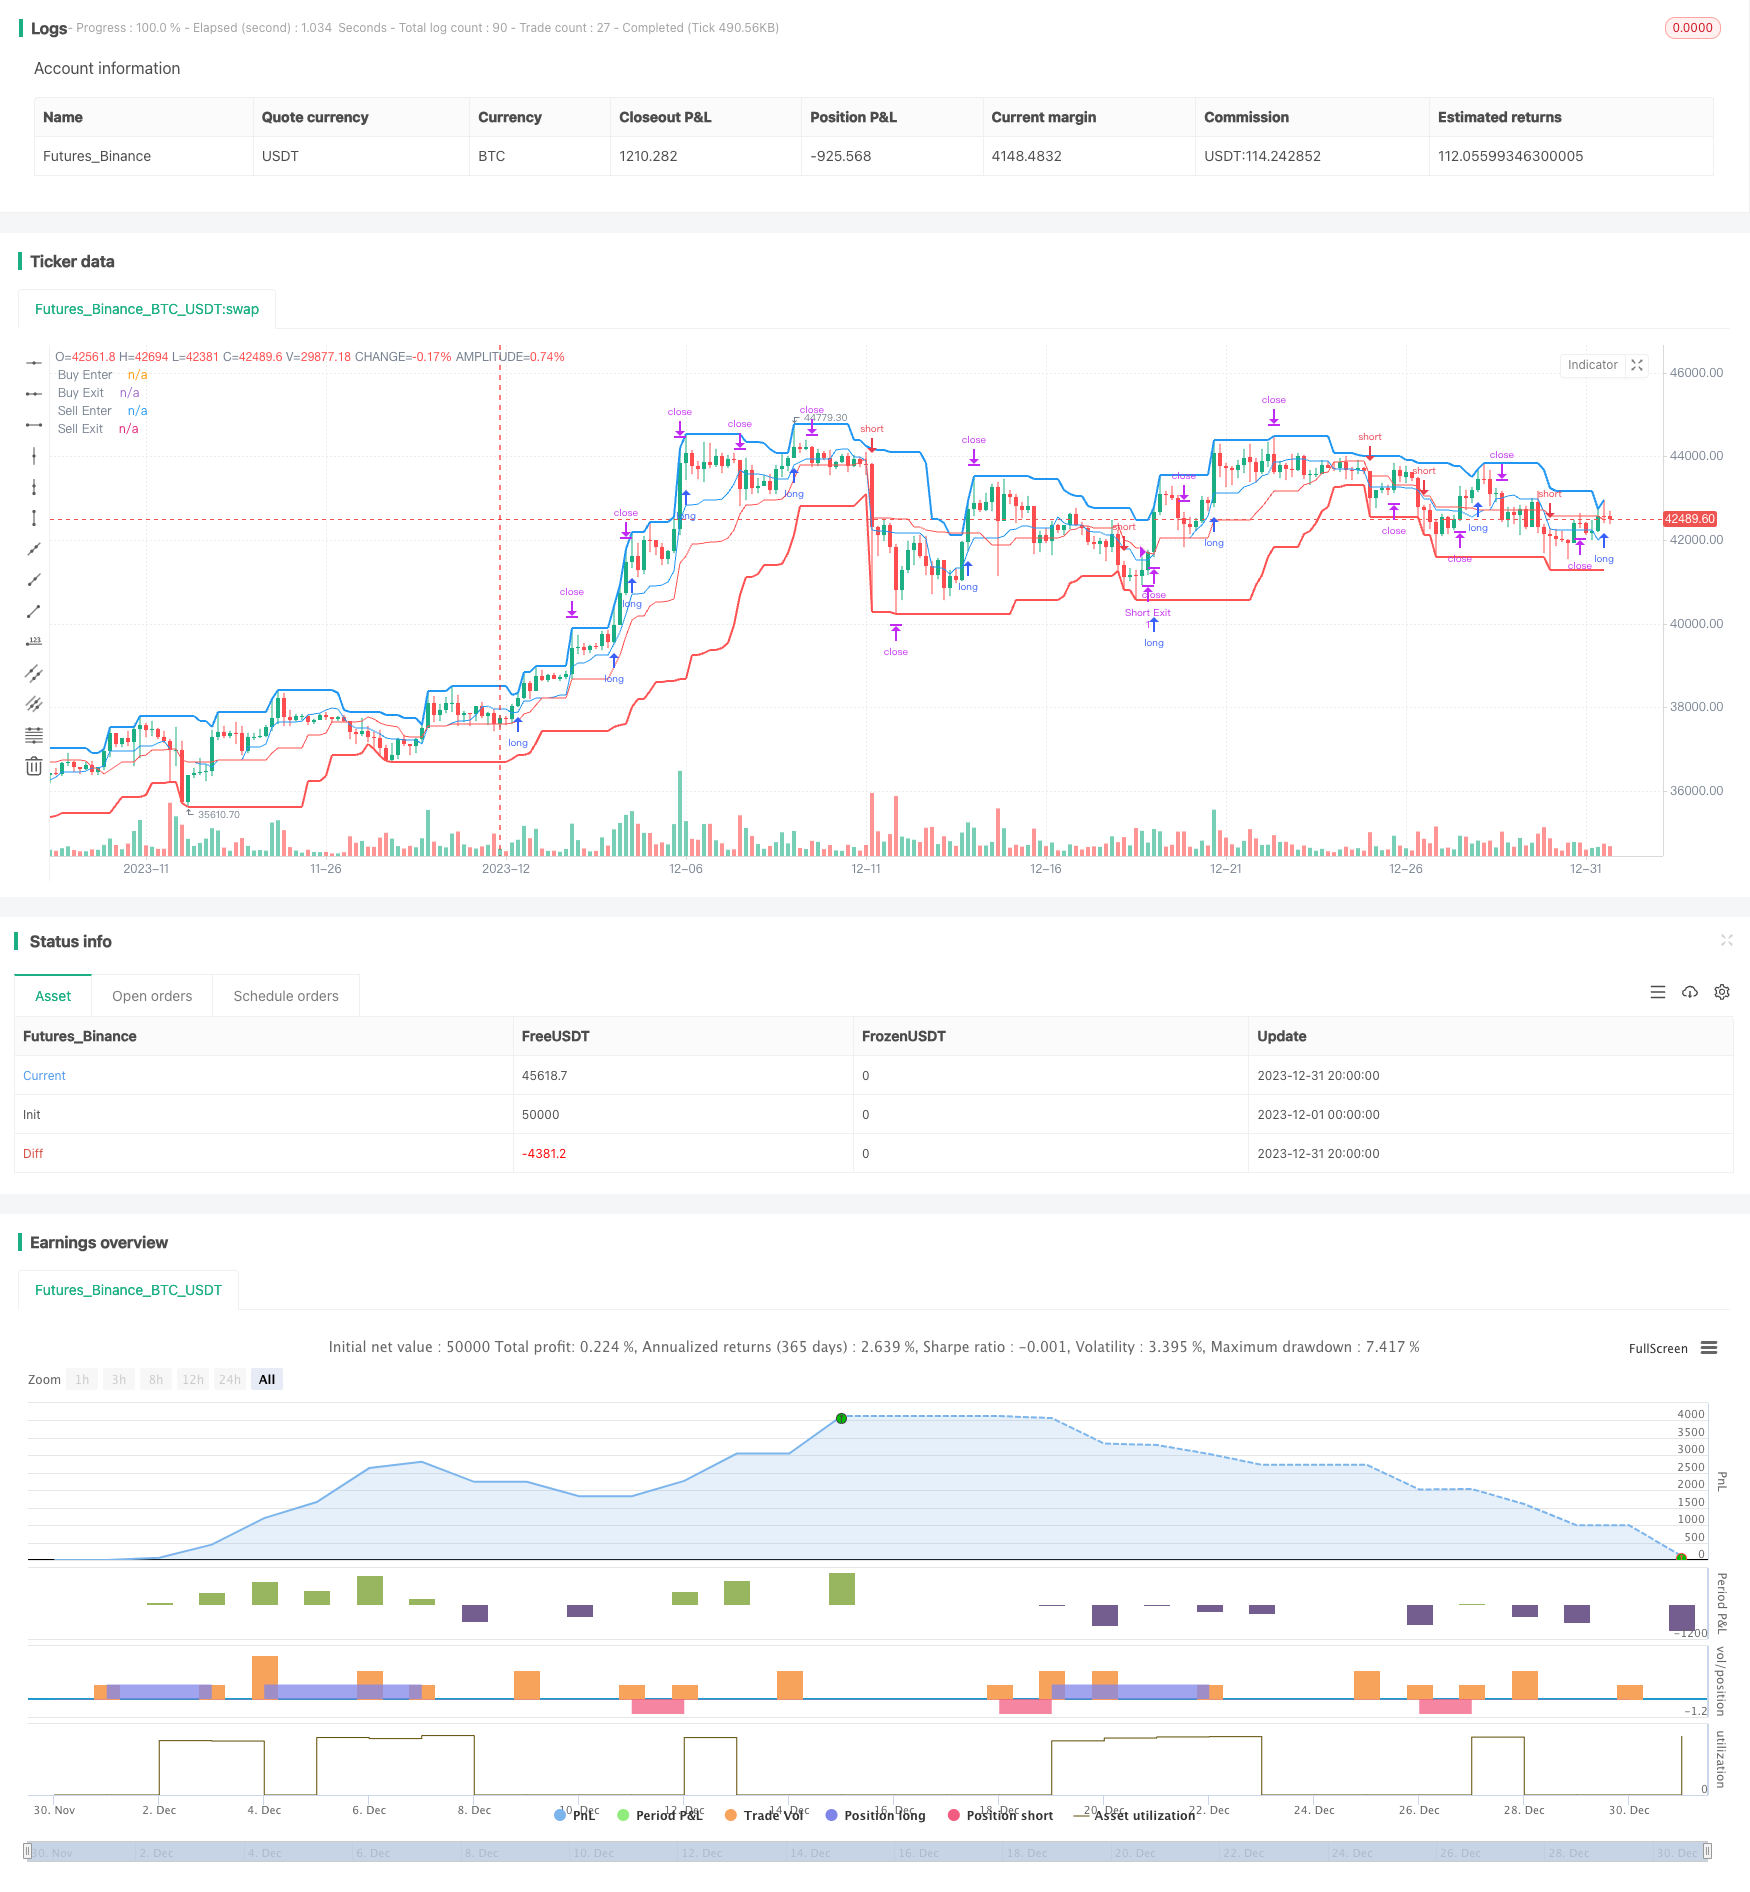
概述
唐奇安通道突破策略是一种趋势跟踪策略,它通过计算一定时间段内的最高价和最低价,形成价格通道,并以通道边界作为买入和卖出信号。当价格突破上轨时,做空;当价格突破下轨时,做多。该策略适用于高波动的数字货币交易。
策略原理
该策略使用唐奇安通道指标来判断价格趋势和计算入场退出点。唐奇安通道由上轨、下轨和中轨组成。上轨为一定周期内的最高价,下轨为最低价,中轨为平均价。
入场和退出周期长度可以独立配置。当价格向上突破下轨时,做多进入;当价格向下突破上轨时,做空进入。退出点则为价格再次触碰对应轨道。也可以选择以中轨作为止损线。
此外,策略中还设置了止盈点。做多仓位的止盈价为入场价的(1+止盈比例),做空仓位则相反。启用该功能可以锁定盈利,避免亏损扩大。
总体来说,该策略判断趋势的同时,确保有足够的空间来设置止损和止盈。这使其特别适合数字货币等波动率高的品种。
优势分析
该策略具有以下优势:
- 策略判断清晰,信号生成简单可靠。
- 唐奇安通道指标对价格震荡不敏感,有利于捕捉趋势。
- 可自定义通道参数,适应不同品种和时间周期。
- 内置止损止盈功能,可以有效控制风险。
- 适用于高波动品种如数字货币,收益潜力大。
风险分析
该策略也存在以下风险:
- 虽有止损功能,但无法完全规避巨幅行情的风险。
- 参数设置不当可能导致过于频繁交易,增加交易成本和滑点风险。
- 该策略对价格震荡不敏感,可能错过部分交易机会。
为控制上述风险,建议采取以下措施:
- 适当缩小单笔投入资金,分散投资品种,控制总体风险。
- 优化参数,寻找最佳参数组合。可尝试采用机器学习等方法自动优化。
- 结合额外指标判断突破信号的可靠性,避免误交易。
优化方向
该策略可从以下维度进一步优化:
- 测试并优化更多参数组合,寻找最佳参数。主要参数包括通道周期、止盈比例、是否允许做多做空等。
- 增加机器学习模型,自动识别最优参数。可采用强化学习等方法。
- 结合其他指标判断趋势和信号可靠性,如均线、成交量等。
- 开发止损策略,如跟踪止损、 Chandelier Exit 等,进一步控制风险。
- 扩展至更多品种,寻找最匹配该策略的交易品种。
总结
唐奇安通道突破策略整体来说是一种判断清晰、风险可控的趋势跟踪策略。它特别适合数字货币等高波动品种,收益潜力大。同时,该策略也存在一定的参数优化空间和结合其他指标的可能性,这些都是未来可扩展的方向。通过不断优化与创新,该策略有望成为数字货币算法交易的重要选择。
策略源码
/*backtest
start: 2023-12-01 00:00:00
end: 2023-12-31 23:59:59
period: 4h
basePeriod: 15m
exchanges: [{"eid":"Futures_Binance","currency":"BTC_USDT"}]
*/

// This source code is subject to the terms of the Mozilla Public License 2.0 at https://mozilla.org/MPL/2.0/
// © algotradingcc
// Strategy testing and optimisation for free trading bot

//@version=4
strategy("Donchian Channel Strategy [for free bot]", overlay=true )

//Long optopns
buyPeriodEnter = input(10, "Channel Period for Long enter position")
buyPeriodExit = input(10, "Channel Period for Long exit position")
isMiddleBuy = input(true, "Is exit on Base Line? If 'no' - exit on bottom line")
takeProfitBuy = input(2.5, "Take Profit (%) for Long position")
isBuy = input(true, "Allow Long?")

//Short Options
sellPeriodEnter = input(20, "Channel Period for Short enter position")
sellPeriodExit = input(20, "Channel Period for Short exit position")
isMiddleSell = input(true, "Is exit on Base Line? If 'no' - exit on upper line")
takeProfitSell = input(2.5, "Take Profit (%) for Short position")
isSell = input(true, "Allow Short?")

// Test Start
startYear = input(2005, "Test Start Year")
startMonth = input(1, "Test Start Month")
startDay = input(1, "Test Start Day")
startTest = timestamp(startYear,startMonth,startDay,0,0)

//Test End
endYear = input(2050, "Test End Year")
endMonth = input(12, "Test End Month")
endDay = input(30, "Test End Day")
endTest = timestamp(endYear,endMonth,endDay,23,59)

timeRange = time > startTest and time < endTest ? true : false

// Long&Short Levels
BuyEnter = highest(buyPeriodEnter)
BuyExit = isMiddleBuy ? ((highest(buyPeriodExit) + lowest(buyPeriodExit)) / 2): lowest(buyPeriodExit)

SellEnter = lowest(sellPeriodEnter)
SellExit = isMiddleSell ? ((highest(sellPeriodExit) + lowest(sellPeriodExit)) / 2): highest(sellPeriodExit)

// Plot Data
plot(BuyEnter, style=plot.style_line, linewidth=2, color=color.blue, title="Buy Enter")
plot(BuyExit, style=plot.style_line, linewidth=1, color=color.blue, title="Buy Exit", transp=50)
plot(SellEnter, style=plot.style_line, linewidth=2, color=color.red, title="Sell Enter")
plot(SellExit, style=plot.style_line, linewidth=1, color=color.red, title="Sell Exit", transp=50)

// Calc Take Profits
TakeProfitBuy = 0.0
TakeProfitSell = 0.0
if strategy.position_size > 0
    TakeProfitBuy := strategy.position_avg_price*(1 + takeProfitBuy/100)

if strategy.position_size < 0
    TakeProfitSell := strategy.position_avg_price*(1 - takeProfitSell/100)

// Long Position
if isBuy and timeRange
    strategy.entry("Long", strategy.long, stop = BuyEnter, when = strategy.position_size == 0)

strategy.exit("Long Exit", "Long", stop=BuyExit, limit = TakeProfitBuy, when = strategy.position_size > 0)

// Short Position
if isSell and timeRange
    strategy.entry("Short", strategy.short, stop = SellEnter, when = strategy.position_size == 0)

strategy.exit("Short Exit", "Short", stop=SellExit, limit = TakeProfitSell, when = strategy.position_size < 0)

// Close & Cancel when over End of the Test
if time > endTest
    strategy.close_all()
    strategy.cancel_all()