EMA-basierte Handelsstrategie
Überblick
Die Strategie nutzt die EMA-Gehälter aus 4 verschiedenen Perioden und bildet die Handelssignale entsprechend ihrer Reihenfolge mit roten, gelben und grünen Drei-Farben, ähnlich wie bei den Ampeln. Daher ist die Strategie als Ampel-Handelsstrategie bezeichnet. Sie beurteilt die Märkte aus beiden Perspektiven, Trends und Umkehrungen, um die Genauigkeit von Handelsentscheidungen zu verbessern.
Strategieprinzip
Setzen Sie 3 EMA Mittellinien für die Schnelllinie (8 Zyklen), die Mittellinie (14 Zyklen) und die Langlinie (16 Zyklen) und fügen Sie 1 EMA Mittellinie für die Langzeit (100 Zyklen) als Filter hinzu.
Beurteilen Sie die Reihenfolge der schnellen, mittleren und langsamen 3 Durchschnitt und die Kreuzung mit dem Filter, um die Zeit für Über- und Untertreibung zu bestimmen:
Beim Durchschreiten der mittleren oder der schnellen oder der mittleren Leitung wird als Mehrsignal beurteilt.
Wenn man unterhalb der mittleren Leitung die Schnellleitung durchbricht, wird das Signal als “Ping-Ping” beurteilt.
Beim Durchschreiten der Mittellinie unter der Schnelllinie oder der Mittellinie unter der Langleine wird als Fehlsignal beurteilt
Bei einer Überschneidung auf der Mittellinie wird das Signal als “flächig” eingestuft.
- Durch die Reihenfolge der schnellen und langsamen 3 Mittellinien, um die Richtung und Stärke des Trends zu bestimmen, kombiniert mit der Mittellinie und dem Kreuz des Filters, um die Wendepunkte zu bestimmen, um eine organische Kombination von Trendverfolgung und Wendefang zu erreichen.
Analyse der Stärken
Die Strategie kombiniert die Vorteile von Trend-Tracking und Reverse-Trading, um Marktchancen besser zu nutzen. Die wichtigsten Vorteile sind:
- Mehrfache EMA-Mittellinien, bessere Urteilsfähigkeit und geringere Falschmeldungen
- Flexible Einstellungen für mehr Leerlaufbedingungen, um keine verpassten Handelsmöglichkeiten zu vermeiden
- Die dreifache Verwendung von langen und kurzen Periodenmittellinien, umfassende Urteilsfähigkeit
- Benutzerdefinierte Stop-Loss-Bedingungen, Risikokontrolle vorhanden
Durch die Optimierung der Parameter kann die Strategie für mehr Sorten eingesetzt werden und zeigt eine hohe Profitabilität und Stabilität bei der Rückprüfung.
Risikoanalyse
Die Hauptrisiken dieser Strategie sind:
- Wenn die Reihenfolge der EMAs in mehreren Gruppen durcheinander gerät, erhöht dies die Schwierigkeit der Beurteilung und führt zu Handelszweifeln.
- Falsche Signale, die nicht in der Lage sind, außergewöhnliche Marktschwankungen zu filtern, um bei einem großen Schwung zu verlieren
- Die Parameter sind nicht rechtzeitig eingestellt und die Stop-Loss-Bedingungen können zu locker oder zu streng sein, was zu verpassten Gewinnen oder übermäßigen Verlusten führt
Es wird empfohlen, die strategische Stabilität weiter zu verbessern und die Risiken zu kontrollieren, indem die Parameter optimiert, die Stop-Loss-Ebene festgelegt und vorsichtig betrieben werden.
Optimierungsrichtung
Die wichtigsten Optimierungsbereiche der Strategie sind:
- Anpassung der Periodiparameter der EMA-Mittellinie an weitere Sorten
- Zusätzliche Filter für andere Indikatoren wie MACD, Brinks und andere, um die Genauigkeit zu verbessern
- Optimierung des Stop-Loss-Verhältnisses für eine optimale Balance zwischen Risiko und Ertrag
- Hinzufügung von adaptiven Stop-Loss-Mechanismen wie ATR-Stopp, um das Abwärtsrisiko weiter zu kontrollieren
Die Stabilität und Profitabilität der Strategie kann durch die Einführung von mehreren Parameteranpassungen und Risikokontrollen kontinuierlich verbessert werden.
Zusammenfassen
Die Verkehrslicht-Handelsstrategie integriert Trendverfolgung und Umkehrung, verwendet 4 Gruppen von EMAs, um Handelssignale zu bilden, die durch Parameteroptimierung für mehr Sorten geeignet sind und in der Rückmessung eine starke Rentabilität zeigen. Durch weitere Risikokontrolle und die Einführung von mehreren Indikatoren wird es als eine stabile und effiziente quantitative Handelsstrategie erwartet.
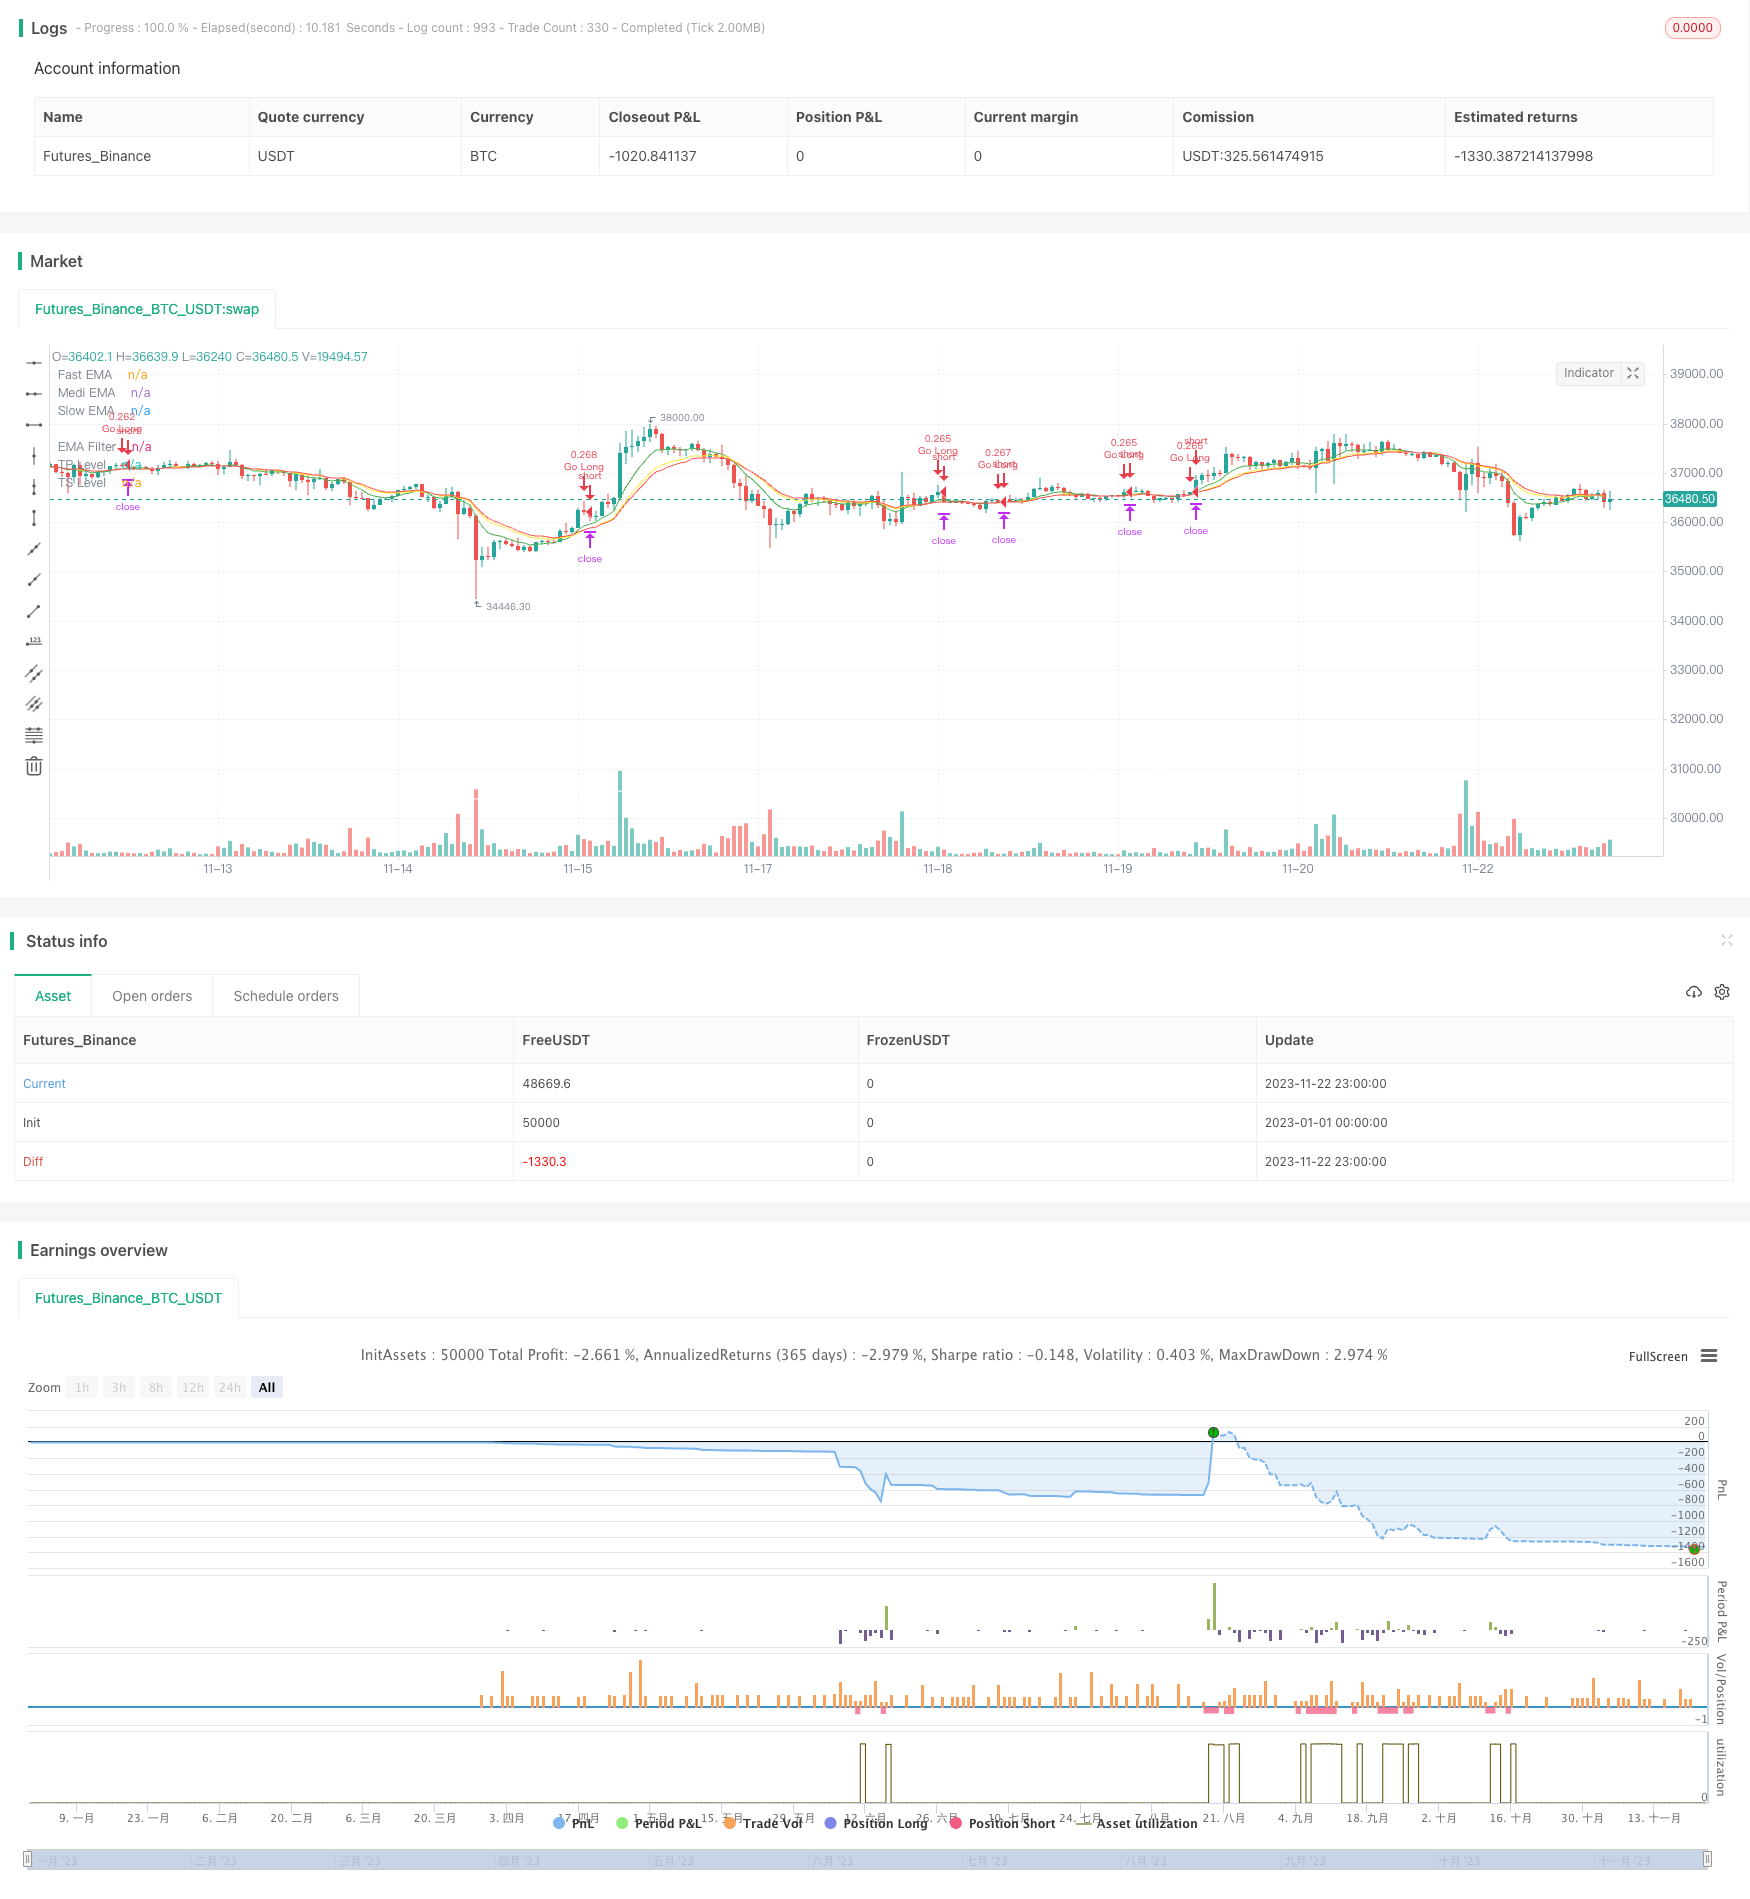
/*backtest
start: 2023-01-01 00:00:00
end: 2023-11-23 00:00:00
period: 1h
basePeriod: 15m
exchanges: [{"eid":"Futures_Binance","currency":"BTC_USDT"}]
*/

// This source code is subject to the terms of the Mozilla Public License 2.0 at https://mozilla.org/MPL/2.0/
// © maxits

// 4HS Crypto Market Strategy
// This strategy uses 4 ema to get Long or Short Signals
// Length are: 8, 14, 16, 100
// We take long positions when the order of the emas is the following:
// green > yellow > red (As the color of Traffic Lights) and they are above white ema (Used as a filter for long positions)

// We take short positions when the order of the emas is the following:
// green < yellow < red (As the color of inverse Traffic Lights) and they are below white ema (Used as a filter for short positions)

//@version=4
strategy(title="Trafic Lights Strategy",
         shorttitle="TLS",
         overlay=true,
         initial_capital=1000,
         default_qty_value=20,
         default_qty_type=strategy.percent_of_equity,
         commission_value=0.1,
         pyramiding=0
         )

// User Inputs
// i_time         = input(defval = timestamp("28 May 2017 13:30 +0000"), title = "Start Time", type = input.time) //Starting time for Backtesting

sep1           = input(title="============ System Conditions ============", type=input.bool, defval=false)

enable_Long    = input(true, title="Enable Long Positions")   // Enable long  Positions
enable_Short   = input(true, title="Enable Short Positions") // Enable short Positions

sep2           = input(title="============ Indicator Parameters ============", type=input.bool, defval=false)

f_length       = input(title="Fast EMA Length",   type=input.integer, defval=8,   minval=1)
m_length       = input(title="Medium EMA Length", type=input.integer, defval=14,   minval=1)
s_length       = input(title="Slow EMA Length",   type=input.integer, defval=16,  minval=1)
filter_L       = input(title="EMA Filter",        type=input.integer, defval=100, minval=1)
filterRes      = input(title="Filter Resolution", type=input.resolution, defval="D")        // ema Filter Time Frame

sep3           = input(title="============LONG Profit-Loss Parameters============", type=input.bool, defval=false)

e_Long_TP      = input(true, title="Enable a Profit Level?")
e_Long_SL      = input(false, title="Enable a S.Loss Level?")
e_Long_TS      = input(true, title="Enable a Trailing Stop?")
long_TP_Input  = input(40.0,   title='Take Profit %',   type=input.float,   minval=0)/100
long_SL_Input  = input(1.0,   title='Stop Loss %',     type=input.float,   minval=0)/100
atrLongMultip  = input(2.0,   title='ATR Multiplier',  type=input.float,   minval=0.1)   // Parameters to calculate Trailing Stop Loss
atrLongLength  = input(14,    title='ATR Length',      type=input.integer, minval=1)

sep4           = input(title="============SHORT Profit-Loss Parameters============", type=input.bool, defval=false)

e_Short_TP     = input(true, title="Enable a Profit Level?")
e_Short_SL     = input(false, title="Enable a S.Loss Level?")
e_Short_TS     = input(true, title="Enable a Trailing Stop?")
short_TP_Input = input(30.0,   title='Take Profit %',   type=input.float,   minval=0)/100
short_SL_Input = input(1.0,   title='Stop Loss %',     type=input.float,   minval=0)/100
atrShortMultip = input(2.0,   title='ATR Multiplier',  type=input.float,   minval=0.1)
atrShortLength = input(14,    title='ATR Length',      type=input.integer, minval=1)

// Indicators

fema   = ema(close, f_length)
mema   = ema(close, m_length)
sema   = ema(close, s_length)
filter = security(syminfo.tickerid, filterRes, ema(close, filter_L))

plot(fema,   title="Fast EMA",   color=color.new(color.green,  0))
plot(mema,   title="Medi EMA",   color=color.new(color.yellow, 0))
plot(sema,   title="Slow EMA",   color=color.new(color.red,    0))
plot(filter, title="EMA Filter", color=color.new(color.white,  0))

// Entry Conditions

longTrade  = strategy.position_size >  0
shortTrade = strategy.position_size <  0
notInTrade = strategy.position_size == 0
inTrade    = strategy.position_size != 0
priceEntry = strategy.position_avg_price

goLong  = fema > mema and mema > sema and fema > filter and  enable_Long  and (crossover (fema, mema) or crossover (mema, sema) or crossover (sema, filter))
goShort = fema < mema and mema < sema and fema < filter and  enable_Short and (crossunder (fema, mema) or crossunder (mema, sema) or crossunder (sema, filter))

close_L = crossunder(fema, mema)
close_S = crossover (fema, mema)

// Profit and Loss conditions

// Long

long_TP = priceEntry * (1 + long_TP_Input)  // Long Position Take Profit Calculation
long_SL = priceEntry * (1 - long_SL_Input)  // Long Position Stop Loss Calculation
atrLong = atr(atrLongLength)                // Long Position ATR Calculation
long_TS = low - atrLong * atrLongMultip

long_T_stop  = 0.0                          // Code for calculating Long Positions Trailing Stop Loss/
long_T_stop := if (longTrade)
    longStop = long_TS
    max(long_T_stop[1], longStop)
else
    0

//Short

short_TP = priceEntry * (1 - short_TP_Input) // Long  Position Take Profit Calculation
short_SL = priceEntry * (1 + short_SL_Input) // Short Position Stop Loss Calculation
atrShort = atr(atrShortLength)               // Short Position ATR Calculation
short_TS = high + atrShort * atrShortMultip

short_T_stop   = 0.0                // Code for calculating Short Positions Trailing Stop Loss/
short_T_stop  := if shortTrade
    shortStop  = short_TS
    min(short_T_stop[1], shortStop)
else
    9999999

// Strategy Long Entry

if goLong and notInTrade
    strategy.entry("Go Long", long=strategy.long, comment="Go Long", alert_message="Open Long Position")

if longTrade and close_L
    strategy.close("Go Long", when=close_L, comment="Close Long", alert_message="Close Long Position")

if e_Long_TP    // Algorithm for Enabled Long Position Profit Loss Parameters
    if (e_Long_TS and not e_Long_SL)
        strategy.exit("Long TP & TS", "Go Long", limit = long_TP, stop = long_T_stop)
    else
        if (e_Long_SL and not e_Long_TS)
            strategy.exit("Long TP & TS", "Go Long",limit = long_TP, stop = long_SL)
        else
            strategy.exit("Long TP & TS", "Go Long",limit = long_TP)
else
    if not e_Long_TP
        if (e_Long_TS and not e_Long_SL)
            strategy.exit("Long TP & TS", "Go Long", stop = long_T_stop)
        else
            if (e_Long_SL and not e_Long_TS)
                strategy.exit("Long TP & TS", "Go Long",stop = long_SL)


// Strategy Short Entry

if goShort and notInTrade
    strategy.entry("Go Short", long=strategy.short, comment="Go Short", alert_message="Open Short Position")

if shortTrade and close_S
    strategy.close("Go Short", comment="Close Short", alert_message="Close Short Position")

if e_Short_TP   // Algorithm for Enabled Short Position Profit Loss Parameters
    if (e_Short_TS and not e_Short_SL)
        strategy.exit("Short TP & TS", "Go Short", limit = short_TP, stop = short_T_stop)
    else
        if (e_Short_SL and not e_Short_TS)
            strategy.exit("Short TP & SL", "Go Short",limit = short_TP, stop = short_SL)
        else
            strategy.exit("Short TP & TS", "Go Short",limit = short_TP)
else
    if not e_Short_TP
        if (e_Short_TS and not e_Short_SL)
            strategy.exit("Short TS", "Go Short", stop = short_T_stop)
        else
            if (e_Short_SL and not e_Short_TS)
                strategy.exit("Short SL", "Go Short",stop = short_SL)

// Long  Position Profit and Loss Plotting

plot(longTrade and e_Long_TP  and long_TP                          ? long_TP      : na, title="TP Level", color=color.green, style=plot.style_linebr, linewidth=2)
plot(longTrade and e_Long_SL  and long_SL and not e_Long_TS        ? long_SL      : na, title="SL Level", color=color.red,   style=plot.style_linebr, linewidth=2)
plot(longTrade and e_Long_TS  and long_T_stop and not e_Long_SL    ? long_T_stop  : na, title="TS Level", color=color.red,   style=plot.style_linebr, linewidth=2)

// Short Position Profit and Loss Plotting

plot(shortTrade and e_Short_TP and short_TP                        ? short_TP     : na, title="TP Level", color=color.green, style=plot.style_linebr, linewidth=2)
plot(shortTrade and e_Short_SL and short_SL and not e_Short_TS     ? short_SL     : na, title="SL Level", color=color.red,   style=plot.style_linebr, linewidth=2)
plot(shortTrade and e_Short_TS and short_T_stop and not e_Short_SL ? short_T_stop : na, title="TS Level", color=color.red,   style=plot.style_linebr, linewidth=2)