Momentum Zone ATR Reversal Order Quantitative Strategie
Überblick
Die Hauptidee dieser Strategie ist die Kombination von Dynamikzonen und ATR-Indikatoren, um bei Goldforken zu handeln und bei Dead Forks zu gehen. Gleichzeitig wird ein Stop-Loss- und ein Stop-Stop-Preis festgelegt. Wenn der Preis ein Umkehrsignal erhält, wird die Position umgekehrt eröffnet, um die Funktion des Umkehrbefehls zu erreichen.
Grundsätze
- Die Hochbodensignale werden mit einer schnellen EMA und einer langsamen EMA berechnet. Ein schneller EMA, der höher ist als ein langsamer EMA, ist ein Beobachter, der dagegen ein Beobachter ist.
- Wenn es keine Lagerstätte gibt, macht man mehr, wenn es Goldfäcke gibt, und wenn es keine gibt, ist es leer.
- Wenn eine Position eröffnet wurde, wird die aktuelle Position ausgelöscht, um eine neue Position in der entgegengesetzten Richtung zu eröffnen.
- Die Stop-Loss- und Stop-Off-Preise werden mit Hilfe der ATR-Indikatoren berechnet. Die Stop-Loss-Preise werden an die ATR-Kanäle angepasst, um sicherzustellen, dass das Stop-Loss-Risiko gering ist.
- Wenn der Preis in eine Überkauf-Überverkaufszone eintritt, wird der Stop-Loss-Preis auf den höchsten oder niedrigsten Preis der letzten K-Linie angepasst, um eine Einschränkung zu vermeiden.
Vorteile
- In Kombination mit Dynamic Energy Zones und ATR ist es möglich, Positionen im Trend zu eröffnen und zeitlich zu stoppen.
- Umkehr-Order-Funktionen, die in der Lage sind, schnell zu wechseln, wenn die Preise sich umdrehen, um die Nutzung der Preis-Zweiseffekte für höhere Gewinne.
- Die ATR-Stopp-Mechanismen ermöglichen eine effektive Kontrolle der einzelnen Stopp-Risiken und eine hohe Gesamtgewinnrate.
- In Verbindung mit dem Überkauf-Überverkauf-Urteil, um zu vermeiden, dass Sie von unvorhergesehenen Ereignissen betroffen sind.
Risiken und Lösungen
- Reverse Orders können zu häufig gehandelt werden, was zu höheren Kosten und Stop-Loss-Raten führt.
- Lösung: Erhöhung der Mindesthaltungsdauer und Verringerung der Reversal-Effekte bei Schwankungen.
- Eine Änderung des ATR-Wertes kann den Stop-Loss-Bereich zu groß oder zu klein machen.
- Lösung: Realzeit-Anpassung der Stoppdistanz an den ATR-Wert.
- Die falsche Einstellung der Parameter kann zu einer zu hohen Handelsfrequenz oder einer schlechten Signalleistung führen.
- Lösung: Auswahl der richtigen Parameterkombinationen für verschiedene Sorten.
Optimierungsrichtung
- Optimierung der Parameter-Einstellungen und Suche nach der optimalen Parameterkombination.
- Zusätzliche Filterung der technischen Hilfsmittel zur Verbesserung der Signalqualität.
- Ein zusätzliches Modul für die Vermögensverwaltung, das die Positionen an die Gesamtvermögen des Kontos anknüpft.
- Die Analyse über die Zeiträume hinzufügen, um die Effektivität der Strategie zu verbessern.
Zusammenfassen
Diese Strategie integriert die Vorteile der Dynamic Energy Zone und der ATR-Indikatoren, um effizienten Zwei-Wege-Handel zu ermöglichen. Die Reverse-Order-Mechanismen und der ATR-Smart Stop können die Preisschwankungen optimal nutzen. Optimierte Parameter-Einstellungen und die Kombination von mehr Indikatoren können die Effektivität der Strategie weiter verbessern. Die Strategie ist für Hochfrequenz-Zwei-Wege-Handel geeignet und kann auch als unterstützendes Entscheidungswerkzeug verwendet werden.
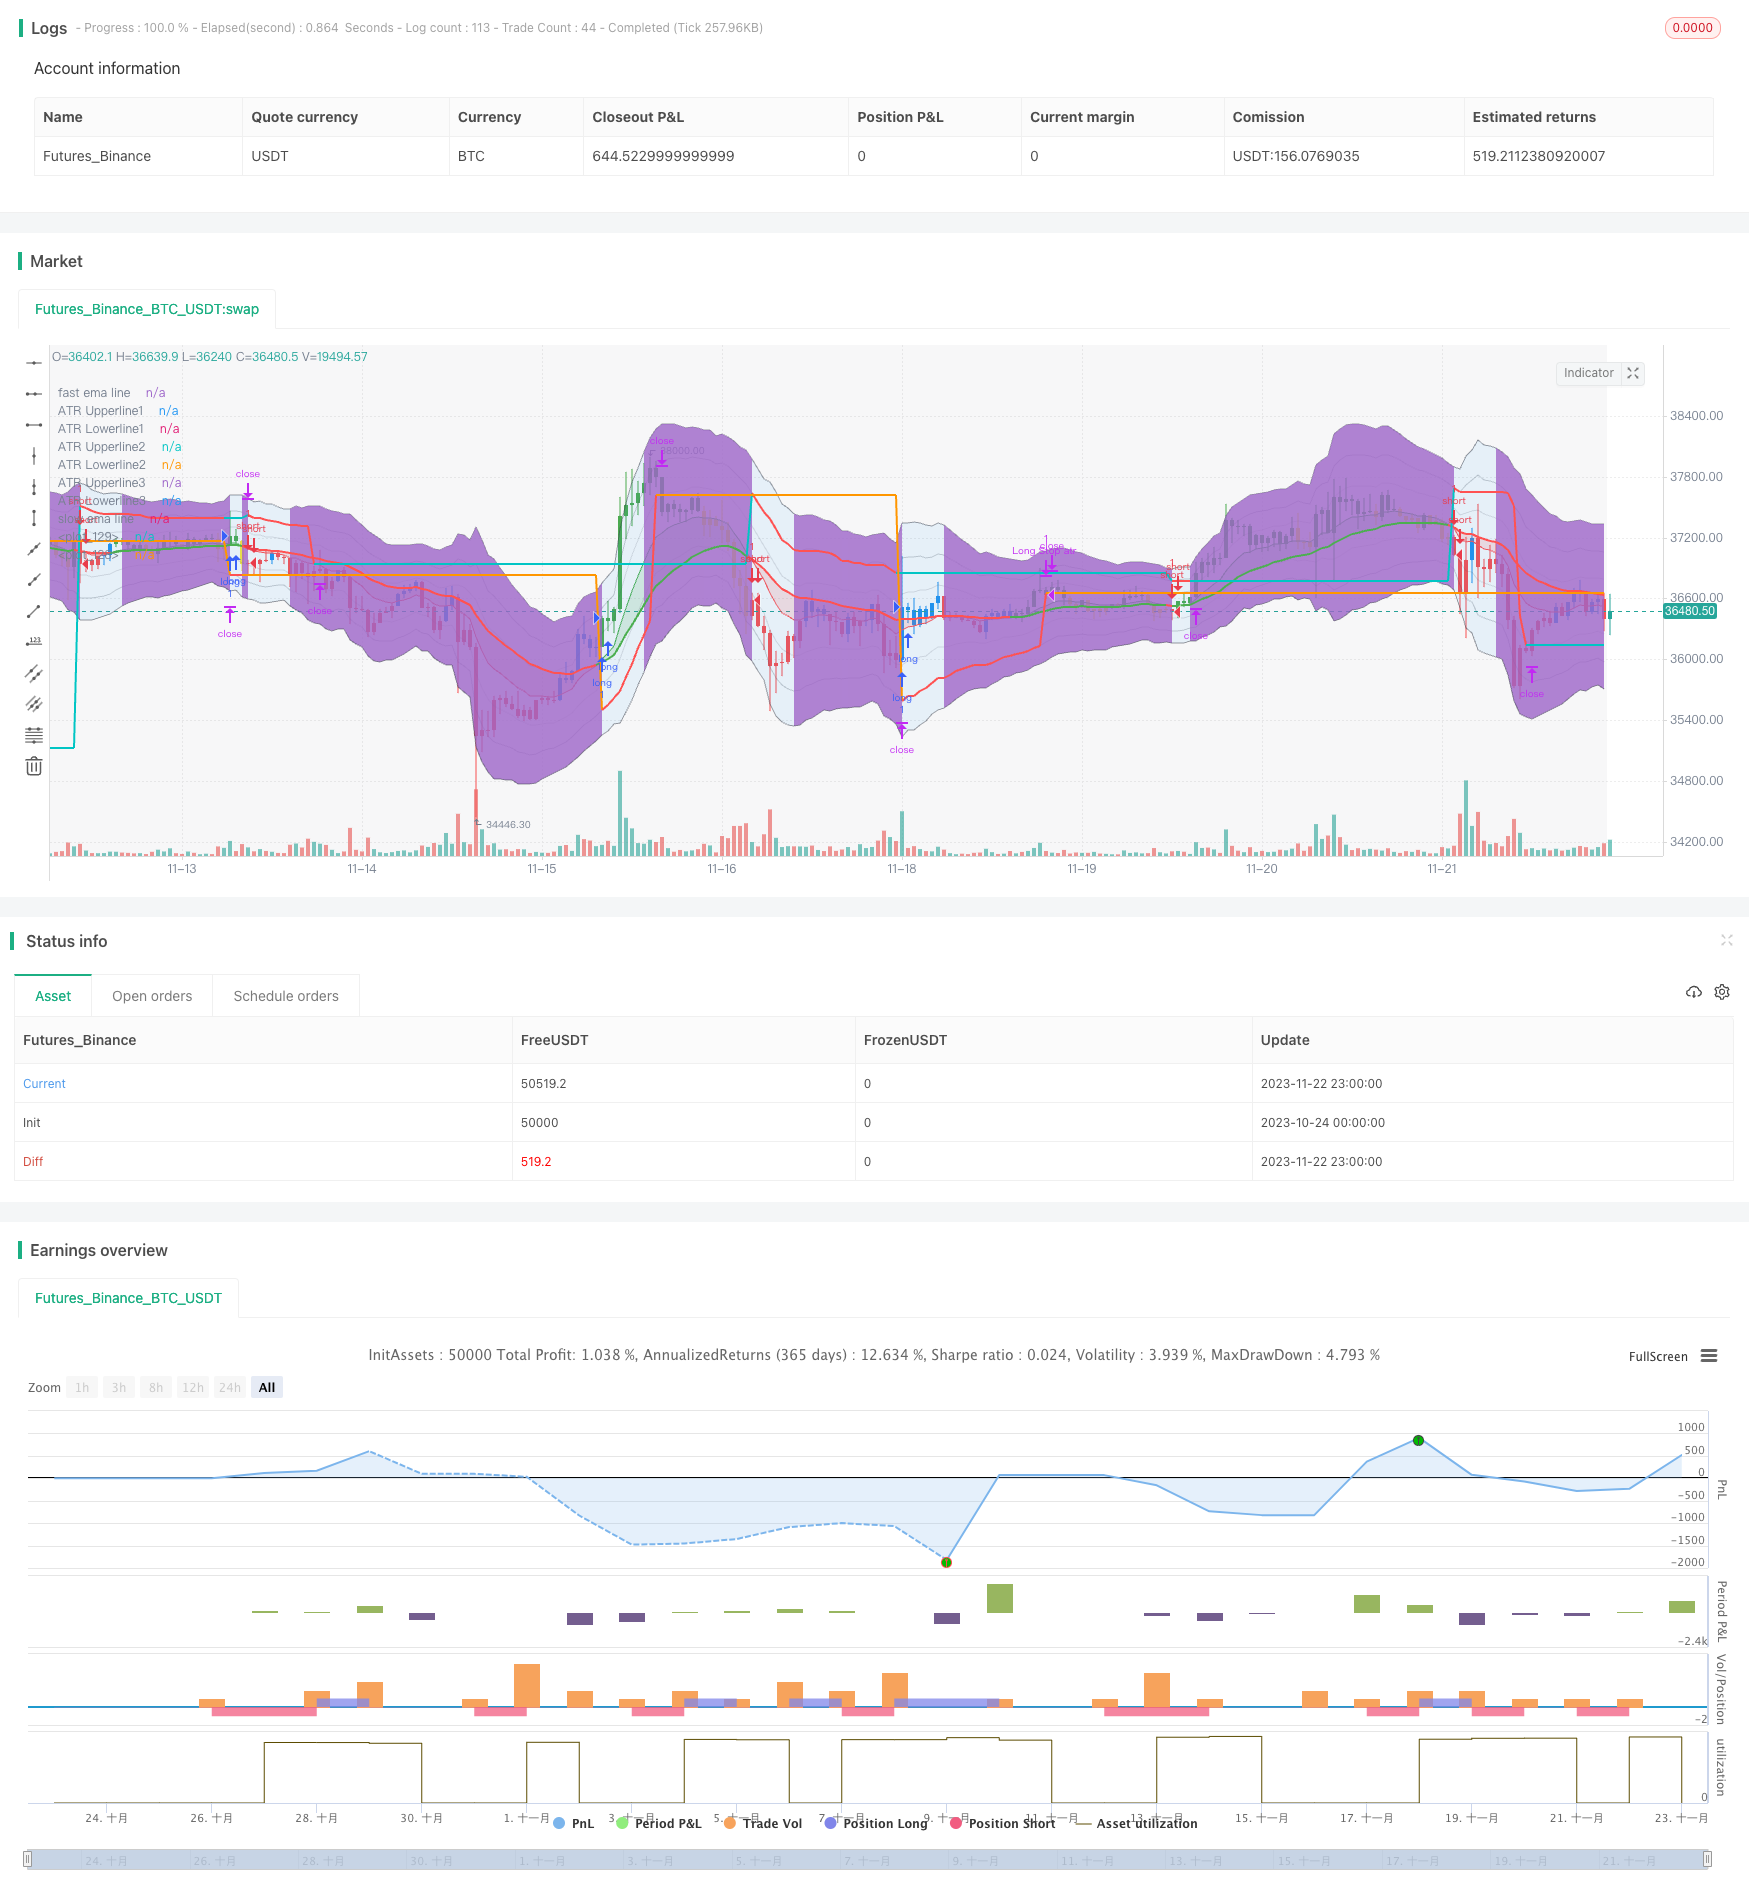
/*backtest
start: 2023-10-24 00:00:00
end: 2023-11-23 00:00:00
period: 1h
basePeriod: 15m
exchanges: [{"eid":"Futures_Binance","currency":"BTC_USDT"}]
*/

// This source code is subject to the terms of the Mozilla Public License 2.0 at https://mozilla.org/MPL/2.0/
// © fenirlix

//@version=5
// Strategy parameter incl. position size, commission and initial capital
strategy("ACTIONZONE-ATR REVERSEORDER STRATEGY", "ACTIONZONEATR-REVERSEORDER", overlay=true
     )

// User Input Variable
fastMaInput     = input.int(12, "Fast MA Period", minval=2, step=1)
slowMaInput     = input.int(26, "Fast MA Period", minval=2, step=1)

atrLengthInput  = input.int(14, "ATR length", minval=2,step=1)
atrInnerMultInput = input.float(1, "atr inner multiplier", minval=0.1, step=0.1)
atrMidMultInput = input.float(2, "atr inner multiplier", minval=0.1, step=0.1) //***** MOST OF RISK MANAGEMENT LOGIC BASE ON THIS INPUT *****//
atrOuterMultInput = input.float(3, "atr inner multiplier", minval=0.1, step=0.1)

// Backtesting Date range
startYearInput      = input.int(2021, "Start Year", minval=1900, maxval=2100, step=1)
startMonthInput     = input.int(12, "Start Month", minval=1, maxval=12, step=1)
startDateInput      = input.int(1, "Start Day", minval=1, maxval=31, step=1)
setEndRangeInput    = input.bool(false, "Using Specific End Test Date") //Set specific End date or use present(end of candle) data
endYearInput        = input.int(2022, "End Year", minval=1900, maxval=2100, step=1)
endMonthInput       = input.int(1, "End Month", minval=1, maxval=12, step=1)
endDateInput        = input.int(31, "End Day", minval=1, maxval=31, step=1)

startDate = timestamp(syminfo.timezone, startYearInput, startMonthInput, startDateInput)
endDate = timestamp(syminfo.timezone, endYearInput, endMonthInput, endDateInput)
inDateRange = time >= startDate //Set backtest date range to present data
if setEndRangeInput
    inDateRange and time <= endDate //set backtest date range to specific date

// minimum position hold period (to get rid of false signal in sideway trend)
minHoldInput = input.int(8, 'Minimum position Hold Limit', minval=1, maxval=365, step=1) // Set Minimum Position Hold

var bool reverseToLong = false // Assign reverse order operator
var bool reverseToShort = false // Assign reverse order operator

// Indicator Declaration
fastEma = ta.ema(close, fastMaInput)
slowEma = ta.ema(close, slowMaInput)
atr = ta.atr(atrLengthInput)

// Declare trend of asset
isBullish = fastEma > slowEma
isBearish = fastEma <= slowEma

// Record position hold length, to limit minimum hold period(candle)
var int hold_length = 0
if strategy.opentrades > 0 or strategy.opentrades < 0
    hold_length := hold_length + 1
else
    hold_length := 0

// create permanent variable of stop price
var float longStopPrice = na
var float shortStopPrice = na

// Chart-Indicator COLOR declaration
REDBEAR     = color.new(color.red, 80)
GREENBULL   = color.new(color.green, 80)

greenLong = isBullish and close > fastEma
yellowLong = isBullish and close < fastEma
blueShort = isBearish and close > fastEma
redShort = isBearish and close < fastEma

// assign oversold, overbought condition(in this case, price over middle atr plus/minus fastEma)
overBand = high[1] > fastEma + (2*atr)
underBand = low[1] < fastEma - (2*atr)

// Strategy

// Main Entry Condition
goLong = isBullish and isBullish[1] == 0
goShort = isBearish and isBearish[1] == 0

inPosition = strategy.position_size != 0
minHoldPeriod = hold_length > minHoldInput ? true : false

// Entry Condition
if not inPosition and inDateRange and barstate.isconfirmed == true //compute after close of the bar to avoid repainting
    if goLong or reverseToLong // Long if longcondition or reverse order receive.
        strategy.entry('long', strategy.long)
        longStopPrice := fastEma - (atr * 2) // Set stop loss price
        reverseToLong := false // Reset reverse order status

    else if goShort or reverseToShort
        strategy.entry('short', strategy.short)
        shortStopPrice := fastEma + (atr * 2)
        reverseToShort := false
// Take profit and Set Higher Stop
if inPosition and minHoldPeriod and barstate.isconfirmed == true // check if we're in position and pass minimum hold period, confirm no repainting
    if strategy.position_size > 0
        // if exit position by Sellcondition(which is the same as ShortCondition), Exit Long position and make Short order(by set reverse order to true)
        strategy.close('long', when=goShort, comment='exitLong(' + str.tostring(hold_length) + ')')
        reverseToShort := true
        if overBand //If overbought condition met, set Stop price to LAST LOW, and not reverse any position
            longStopPrice := low[1]
            reverseToShort := false
    else if strategy.position_size < 0
        strategy.close('short', when=goLong, comment='exitShort(' + str.tostring(hold_length) + ')')
        reverseToLong := true
        if underBand
            shortStopPrice := high[1]
            reverseToLong := false
// Stop Loss and Set calculate stop loss using Atr Channel
if inPosition
    if strategy.position_size > 0
        if fastEma - (atr * atrMidMultInput) > longStopPrice // set long stop price to the higher of latest long stop price and ATR lower channel
            longStopPrice := fastEma - (atr * atrMidMultInput)
        strategy.exit('Long Stop atr ', 'long', stop=longStopPrice)
    else if strategy.position_size < 0
        if fastEma + (atr * atrMidMultInput) < shortStopPrice
            shortStopPrice := fastEma + (atr * atrMidMultInput)
        strategy.exit('Short Stop atr ', 'short', stop=shortStopPrice)

// Plotting
fastLine = plot(fastEma, title='fast ema line', linewidth=1, color=isBullish ? color.green : color.red)
slowLine = plot(slowEma, title='slow ema line', linewidth=2, color= isBullish? color.green : color.red)
atrUpperLine1 = plot(fastEma + (atr * atrInnerMultInput), title='ATR Upperline1', color=color.new(color.black,85))
atrLowerLine1 = plot(fastEma - (atr * atrInnerMultInput), title='ATR Lowerline1', color=color.new(color.black,85))
atrUpperLine2 = plot(fastEma + (atr * atrMidMultInput), title='ATR Upperline2', color=color.new(color.black,75))
atrLowerLine2 = plot(fastEma - (atr * atrMidMultInput), title='ATR Lowerline2', color=color.new(color.black,75))
atrUpperLine3 = plot(fastEma + (atr * atrOuterMultInput), title='ATR Upperline3', color=color.new(color.black,50))
atrLowerLine3 = plot(fastEma - (atr * atrOuterMultInput), title='ATR Lowerline3', color=color.new(color.black,50))

plot(longStopPrice, color=strategy.position_size > 0 ? color.red : na, linewidth=2)
plot(shortStopPrice, color=strategy.position_size < 0 ? color.red : na, linewidth=2)

//  Filling
fill(fastLine, slowLine, color=isBullish ? GREENBULL : REDBEAR)
fill(atrUpperLine3, atrLowerLine3, color=inPosition and (minHoldInput - hold_length > 0) ? color.new(color.blue,90): na)

barColor = switch
    greenLong => color.green
    yellowLong =>  color.yellow
    blueShort => color.blue
    redShort => color.red
    => color.black
barcolor(color=barColor)

// Fill background to distinguish inactive time(Zulu time)
nightTime = time(timeframe.period, "1500-0100") ? color.new(color.black, 95): na
bgcolor(nightTime)