Dynamische Volatilitätserfassungsstrategie mit RSI-Bollinger-Bändern

Überblick
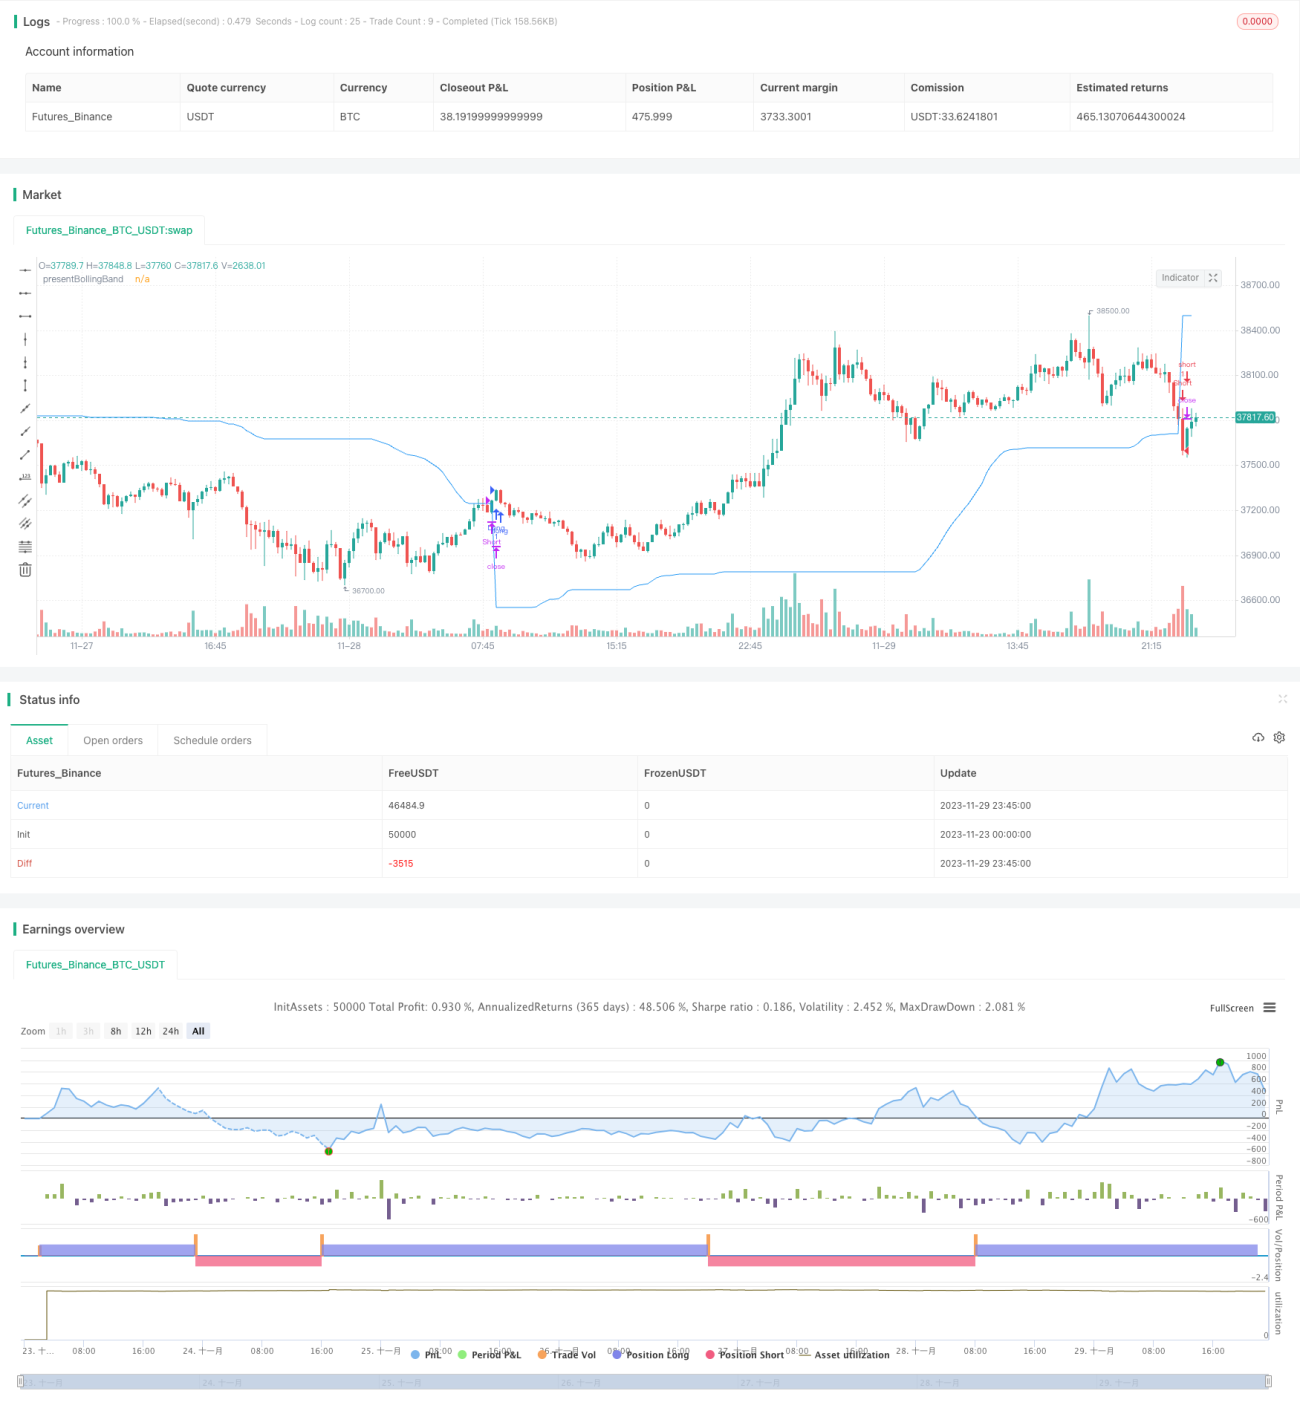
Die RSI-Bulling-Band-Strategie ist eine Handelsstrategie, die die Bulling-Band (BB), den Relativ-Schwachen-Indikator (RSI) und den einfachen Moving Average (SMA) integriert. Die Strategie ist einzigartig, da sie einen dynamischen Level zwischen dem oberen und unteren Kurs berechnet, der auf den Schlusskurs basiert. Diese einzigartige Funktion ermöglicht es der Strategie, sich an Marktvolatilität und Preisänderungen anzupassen.
Die Kryptowährungs- und Aktienmärkte sind sehr volatil und eignen sich daher hervorragend für eine Bollinger-Band-Strategie. Der RSI hilft dabei, Überkäufe und Überverkäufe in diesem oft spekulativen Markt zu erkennen.
Strategieprinzip
Dynamische Bollingband: Die Strategie berechnet zunächst die oberen und unteren Bollingbands nach der von dem Benutzer definierten Länge und dem Multiplikator. Dann wird der Wert des PresentBollingBand in Kombination mit dem Bollingband und der Schlusskursdynamik angepasst. Schließlich wird ein Mehrsignal erzeugt, wenn der Preis den Present BollingBand durchquert, und ein Leersignal, wenn der Preis den Present BollingBand durchquert.
RSI: Die Strategie berechnet auch den RSI und seine SMA, wenn der Benutzer sich entscheidet, ein RSI-Signal zu erzeugen, und verwendet diese, um zusätzliche Über- und Unterziehungssignale zu erzeugen. Ein RSI-basiertes Signal wird nur verwendet, wenn die Option "RSI-Signal erzeugen" auf "true" gesetzt ist.
Die Strategie überprüft dann die gewählte Handelsrichtung und geht entsprechend in eine Über- oder Unterkursposition. Wenn die Handelsrichtung auf den Zwei-Strahler eingestellt ist, kann die Strategie gleichzeitig in eine Über- und Unterkursposition gehen.
Schließlich wird ein Plus-Betrieb platziert, wenn der Schlusskurs die gegenwärtige Bollingbandbreite durchschreitet; ein Short-Betrieb wird platziert, wenn der Schlusskurs die gegenwärtige Bollingbandbreite durchschreitet.
Analyse der Stärken
Die Strategie kombiniert die Vorteile der Bollinger Bands, RSI und SMA-Indikatoren, um die Volatilität des Marktes anzupassen, die Dynamik der Schwankungen zu erfassen und Handelssignale bei Überkauf und Überverkauf zu erzeugen.
Der RSI ergänzt die Brin-Band-Trading-Signale und verhindert falsche Eintritte in den turbulenten Märkten. Er erlaubt die Auswahl, nur zu handeln, nur zu handeln oder in beide Richtungen zu handeln, um sich an unterschiedliche Marktbedingungen anzupassen.
Die Parameter sind individuell anpassbar und an die persönlichen Risikopräferenzen angepasst.
Risikoanalyse
Die Strategie ist auf technische Indikatoren angewiesen und kann nicht mit den grundlegenden Veränderungen umgehen.
Die falsche Einstellung der Brin-Band-Parameter kann zu einer zu häufigen oder zu spärlichen Erzeugung von Handelssignalen führen.
Die Risiken im Zwei-Wege-Handel erhöhen sich, und man muss vorsichtig sein, um Verluste aus der Börsennotierung zurückzuführen.
Es wird empfohlen, die Risiken in Kombination mit Stop Loss zu kontrollieren.
Optimierungsrichtung
-
Filtersignale in Kombination mit anderen Indikatoren, z. B. MACD.
-
Erhöhung der Stop-Loss-Strategie.
-
Optimierung der Brin-Band- und RSI-Parameter.
-
Anpassung der Parameter an die verschiedenen Handelsarten und -zyklen <unk>
-
Berücksichtigen Sie die Optimierung der Festplatte und passen Sie die Parameter an die tatsächliche Situation an.
Zusammenfassen
Die RSI-Brin-Band-Strategie ist eine technisch-indikatorgetriebene Strategie, die die Vorteile von Brin-Bändern, RSI und SMA-Indikatoren kombiniert, um die Marktschwankungen durch die dynamische Anpassung von Brin zu erfassen. Die Strategie bietet viel Platz für die Anpassung und Optimierung, kann jedoch keine grundlegenden Veränderungen vorhersagen.
- 1