Y-Profit-Maximizer-Strategie
Überblick
Die Kernidee der Strategie besteht darin, den Wert der mobilen Stop-Tracking-Methode zu maximieren und den Einstieg durch Filter und Stop-Stop-Methoden zu optimieren. Das Y-Form im Strategie-Namen steht für die Kreuzung der Strategie-Signal-Linien.
Strategieprinzip
Diese Strategie basiert hauptsächlich auf der PMax Explorer-Strategie von KivancOzbilgic mit einigen Änderungen.
PMax berechnet auf Basis von ATR und Moving Average. Generate Buy Signal, wenn der Preis über PMax geht.
T3-Indikatoren und Preise als Filter, um den Eintritt zu gewährleisten, wenn der Trend nach oben geht.
Einstellung der Stopp-Methode: Setzen Sie die Doppel-BAND-Strategie, um den ersten Stopp zu beurteilen, und dann die nachfolgende Stopp- und Stop-Loss-Strategie, die durch die Satz-Strategie bestimmt wird.
Die MOST-Anzeige hilft bei der Beurteilung von Trends, um unnötige Umkehrungen zu reduzieren.
Analyse der Stärken
Die PMax-Strategie selbst hat den Vorteil, dass man keine hohen Stop-Losses verfolgt, während ein mobiler Stop-Loss-Mechanismus eine geringere DD fördert.
Doppelte Filter sorgen dafür, dass nur im Aufwärtstrend gespielt wird, um falsche Durchbrüche zu vermeiden.
Mehrfache Stop-Point-Einstellungen ermöglichen eine größere Flexibilität der Gewinnung.
Der MOST-Indikator sorgt dafür, dass nur mehrfache Operationen durchgeführt werden, um Reverse-Trading zu vermeiden.
Risikoanalyse
PMax selbst hat eine gewisse Verzögerung, die es leicht macht, den ersten Durchbruch zu verpassen.
Übermäßige Einstellungen des Filters können auch den goldenen Eintrittspunkt verpassen.
Wenn der Stop-Limit zu optimistisch eingestellt ist, können die Bestellungen nicht vollständig ausgeführt werden.
Ein Einzelhandel mit mehreren Händlern ist bei sehr volatilen Sorten nicht rentabel.
Optimierungsrichtung
Die kurzfristige Abweichung von der Aufnahme kann mit Hilfe der MACD-Klasse getestet werden, um den Zeitpunkt der Aufnahme festzustellen.
Ein einfacherer Filter kann getestet werden, wobei nur ein Filterindikator erhalten bleibt.
Es kann ein automatisch angepasster Stop-Off-Mechanismus hinzugefügt werden, der die nachfolgenden Stop-Off-Punkte an die Dynamik der Volatilität und der Rendite anpasst.
Tests können erlaubt werden, um die Positionsverhältnisse entsprechend dem Filter anzupassen.
Zusammenfassen
Die Strategie als Ganzes richtet sich an den Einstieg mit PMax als Kern und entwickelt mehrschichtige Filter- und Stop-Methoden zur Optimierung, um bessere Gewinne bei Trendvarianten zu erzielen. In der späteren Phase kann die Strategie durch die Vereinfachung der Filter, die Optimierung der Stop-Einstellungen und die angemessene Anpassung der Positionsverwaltung optimiert werden.
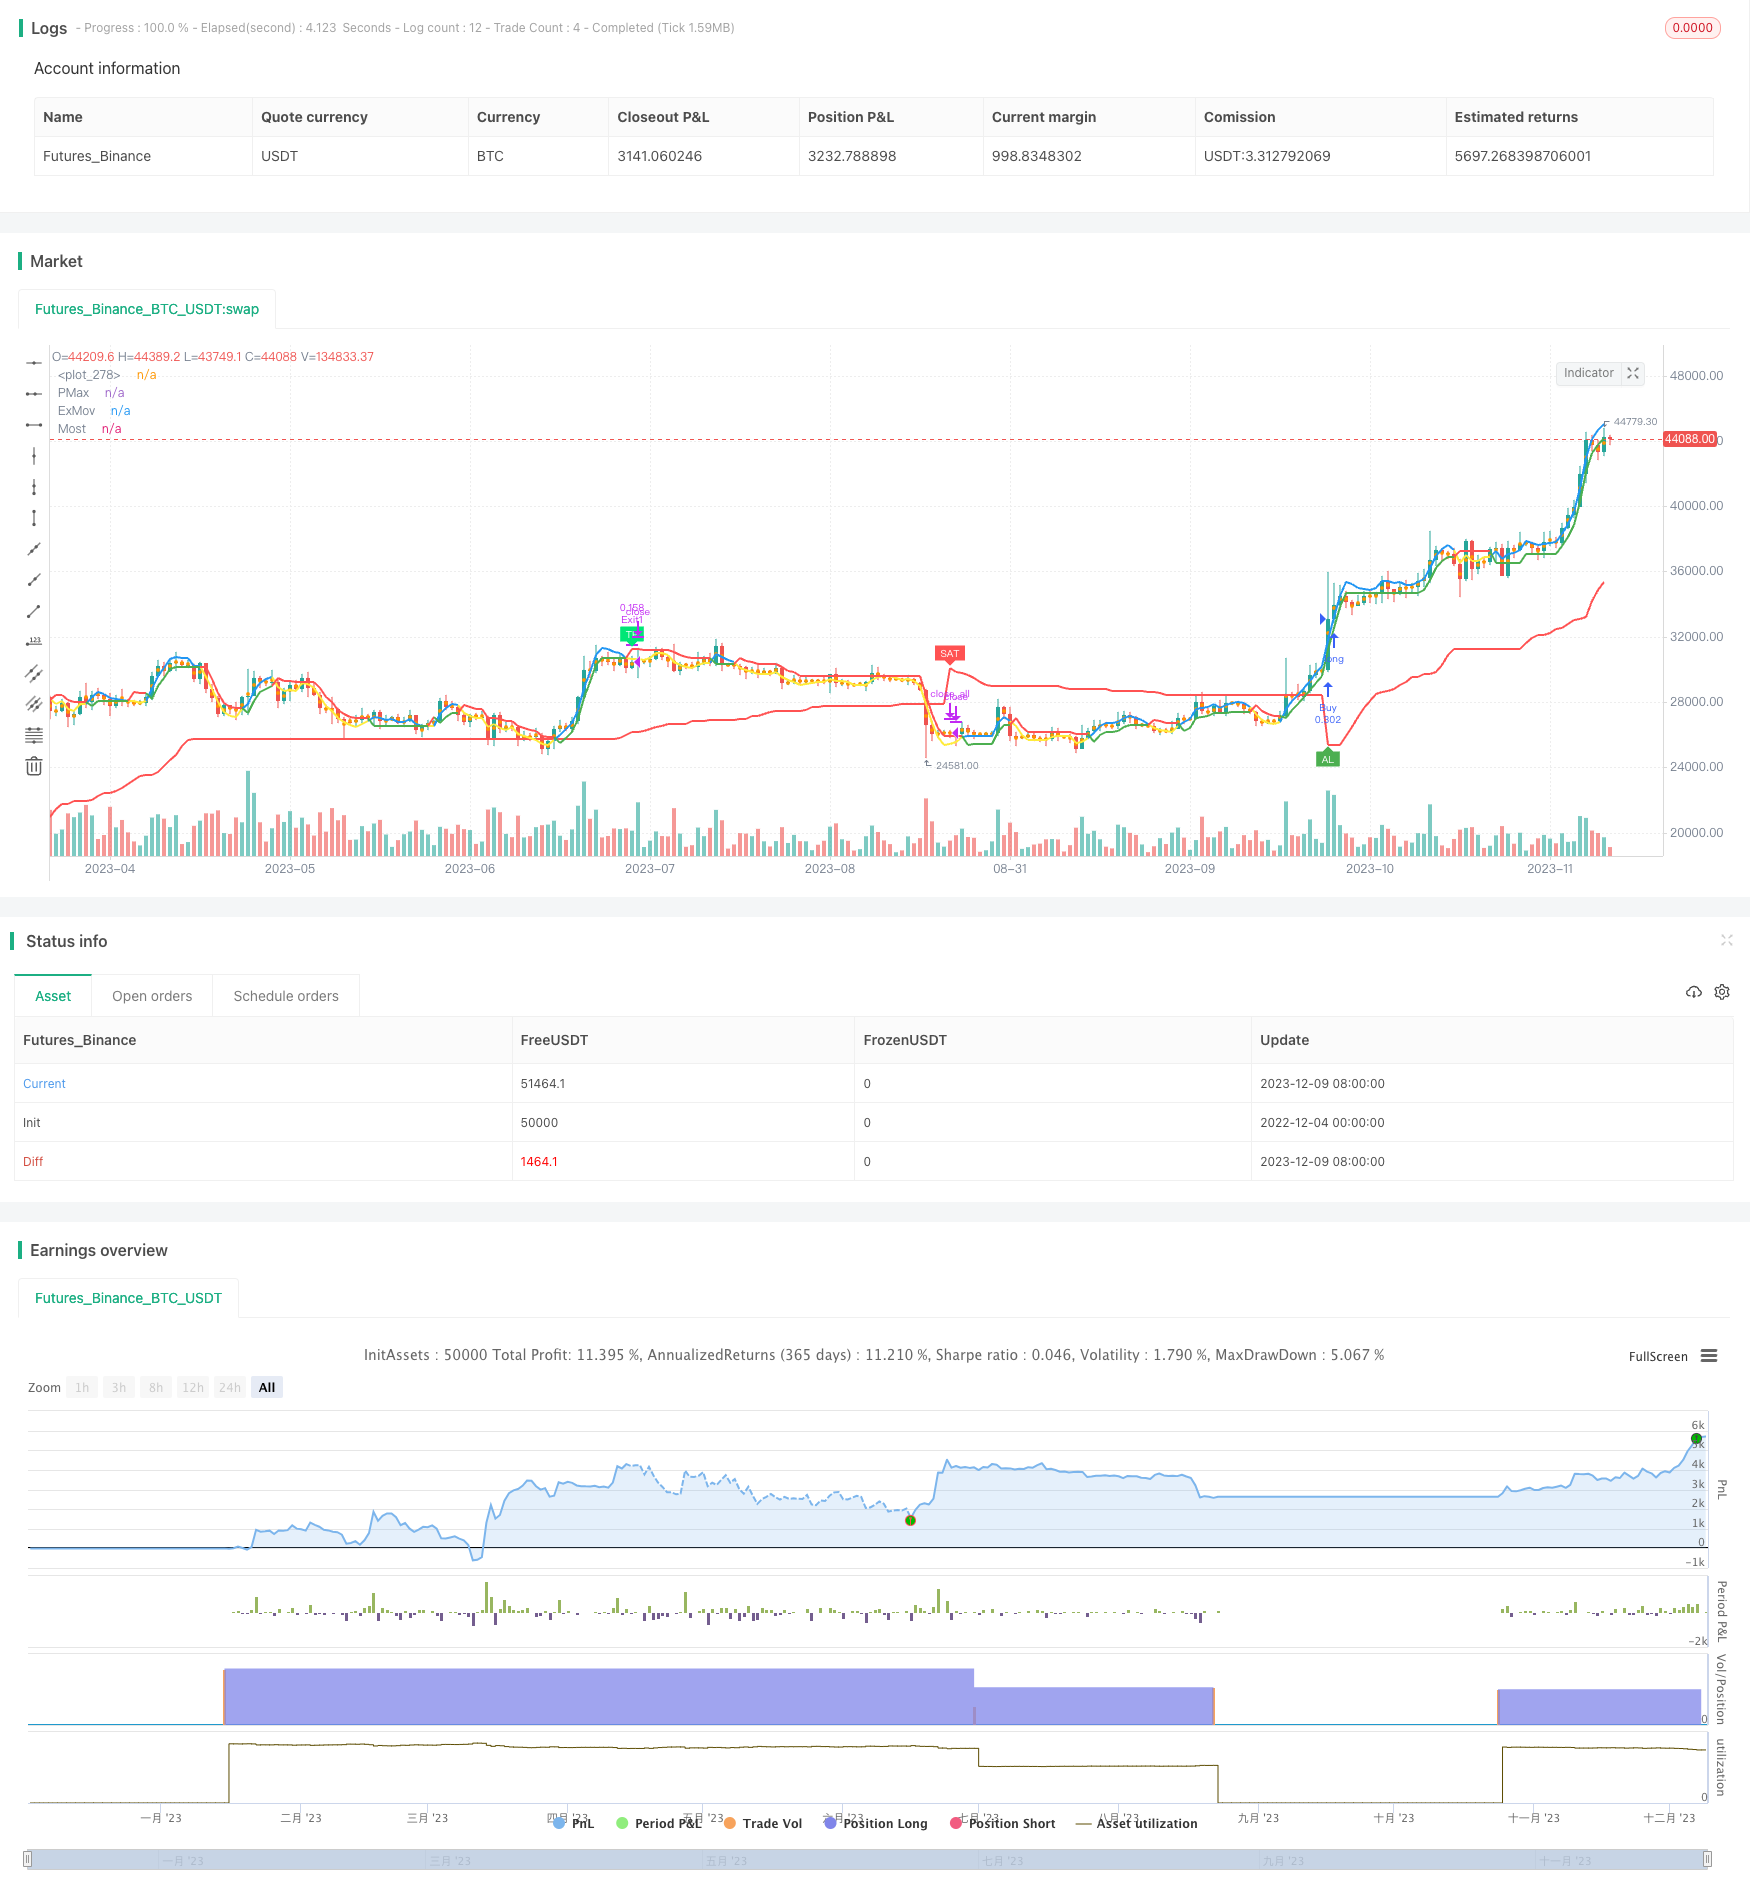
/*backtest
start: 2022-12-04 00:00:00
end: 2023-12-10 00:00:00
period: 1d
basePeriod: 1h
exchanges: [{"eid":"Futures_Binance","currency":"BTC_USDT"}]
*/

//@version=4
// This source code is subject to the terms of the Mozilla Public License 2.0 at https://mozilla.org/MPL/2.0/
// © KivancOzbilgic
//developer: @KivancOzbilgic
//author: @enesyetkin

strategy("Y-Profit Maximizer Strategy with Exit Points", shorttitle="Y-PMax Strategy with Exit Points", overlay=true, default_qty_type=strategy.cash, default_qty_value=10000, initial_capital=10000, currency=currency.USD, commission_value=0.1, commission_type=strategy.commission.percent)
baslik1 = input(title="-------------------- PMax Ayarları -------------------", defval=false)
src = input(hl2, title="Kaynak")
Periods = input(title="ATR uzunluğu", type=input.integer, defval=10)
Multiplier = input(title="ATR Multiplier", type=input.float, step=0.1, defval=3.0)
mav = input(title="Moving Average Tipi", defval="VAR", options=["SMA", "EMA", "WMA", "TMA", "VAR", "WWMA", "ZLEMA", "TSF"])
length =input(13, "Moving Average uzunluğu", minval=1)
filtrelemeacik = input(title="Filtreleme Açık/Kapalı", type=input.bool, defval=false)
filtreleme = input(title="Filtreleme T3/Src (T3 Açık/Src Kapalı)", type=input.bool, defval=false)
changeATR= input(title="ATR Hesaplama Yöntemi Değişsin mi?", type=input.bool, defval=true)
showsupport = input(title="Moving Average i göster?", type=input.bool, defval=false)
showsignalsk = input(title="Al Sat Sinyallerini göster?", type=input.bool, defval=true)
showsignalsc = input(title="Fiyat/Pmax kesişim sinyallerini göster?", type=input.bool, defval=false)
highlighting = input(title="Bulut Açık/Kapalı?", type=input.bool, defval=false)


baslik4 = input(title="-------------------- T3 Ayarları --------------------", defval=false)
length1 = input(89, "T3 Uzunluğu")
length2 = input(5, "T3 Filter Uzunluğu")
a1 = input(0.84, "T3 Volume Faktörü")
a13 = 0.84
length12 = input(5, "Fibo T3 Uzunluğu")
a12 = input(0.618, "T3 Fİbo Volume Faktörü")
T31Show = input(title="T3 ü göster?", type=input.bool, defval=false)
T32Show = input(title= "T3 filtreyi göster?", type=input.bool, defval=false)
T3FiboLine = input(false, title="T3 Fibonacci Oranlı Çizgiler?")

shownum = true

baslik7 = input(title="---------------- Take Profit Ayarları --------------", defval=false)

len = input(25, "Yılan Genişliği")
domcycle = input(20, minval=10, title="Dominant Döngü Genişliği")
rapida = input(8, "Hızlı Ort")
lenta = input(26, "Yavaş Ort")
stdv = input(0.8, "Genişlik")
tpfiltre = input(false, title="TP Filtresi avg2/avg4?")
tplevelshow = input(false, title="TP Level ve Exit Level Sayım Açık Kapalı?")
tp1show =  input(false, title="Erken TP Açık Kapalı")

baslik8 = input(title="------------------- MOST Ayarları ------------------", defval=false)

src_most=input(close,"Source")
AP2 = input(defval=8,title="Length",minval=1)
AF2 = input(defval=2,title="Percent",minval=0.1)/100
mav1 = input(title="Moving Average Tipi", defval="ZLEMovA", options=["EMovA","ZLEMovA"])
plotbuysell = input(true, "Al Sat Etiketleri", input.bool)


///T3 1&2
e1 = ema((high + low + 2 * close) / 4, length1)
e2 = ema(e1, length1)
e3 = ema(e2, length1)
e4 = ema(e3, length1)
e5 = ema(e4, length1)
e6 = ema(e5, length1)
c1 = -a1 * a1 * a1
c2 = 3 * a1 * a1 + 3 * a1 * a1 * a1
c3 = -6 * a1 * a1 - 3 * a1 - 3 * a1 * a1 * a1
c4 = 1 + 3 * a1 + a1 * a1 * a1 + 3 * a1 * a1
T3 = c1 * e6 + c2 * e5 + c3 * e4 + c4 * e3

e13 = ema((high + low + 2 * close) / 4, length2)
e23 = ema(e13, length2)
e33 = ema(e23, length2)
e43 = ema(e33, length2)
e53 = ema(e43, length2)
e63 = ema(e53, length2)
c13 = -a13 * a13 * a13
c23 = 3 * a13 * a13 + 3 * a13 * a13 * a13
c33 = -6 * a13 * a13 - 3 * a13 - 3 * a13 * a13 * a13
c43 = 1 + 3 * a13 + a13 * a13 * a13 + 3 * a13 * a13
T33 = c13 * e63 + c23 * e53 + c33 * e43 + c43 * e33


///PMax

atr2 = sma(tr, Periods)
atr= changeATR ? atr(Periods) : atr2
valpha=2/(length+1)
vud1=src>src[1] ? src-src[1] : 0
vdd1=src<src[1] ? src[1]-src : 0
vUD=sum(vud1,9)
vDD=sum(vdd1,9)
vCMO=nz((vUD-vDD)/(vUD+vDD))
VAR=0.0
VAR:=nz(valpha*abs(vCMO)*src)+(1-valpha*abs(vCMO))*nz(VAR[1])
wwalpha = 1/ length
WWMA = 0.0
WWMA := wwalpha*src + (1-wwalpha)*nz(WWMA[1])
zxLag = length/2==round(length/2) ? length/2 : (length - 1) / 2
zxEMAData = (src + (src - src[zxLag]))
ZLEMA = ema(zxEMAData, length)
lrc = linreg(src, length, 0)
lrc1 = linreg(src,length,1)
lrs = (lrc-lrc1)
TSF = linreg(src, length, 0)+lrs
getMA(src, length) =>
    ma = 0.0
    if mav == "SMA"
        ma := sma(src, length)
        ma

    if mav == "EMA"
        ma := ema(src, length)
        ma

    if mav == "WMA"
        ma := wma(src, length)
        ma

    if mav == "TMA"
        ma := sma(sma(src, ceil(length / 2)), floor(length / 2) + 1)
        ma

    if mav == "VAR"
        ma := VAR
        ma

    if mav == "WWMA"
        ma := WWMA
        ma

    if mav == "ZLEMA"
        ma := ZLEMA
        ma

    if mav == "TSF"
        ma := TSF
        ma

    if mav == "T3"
        ma := T3
        ma
    ma

MAvg=getMA(src, length)
longStop = MAvg - Multiplier*atr
longStopPrev = nz(longStop[1], longStop)
longStop := MAvg > longStopPrev ? max(longStop, longStopPrev) : longStop
shortStop = MAvg + Multiplier*atr
shortStopPrev = nz(shortStop[1], shortStop)
shortStop := MAvg < shortStopPrev ? min(shortStop, shortStopPrev) : shortStop
dir = 1
dir := nz(dir[1], dir)
dir := dir == -1 and MAvg > shortStopPrev ? 1 : dir == 1 and MAvg < longStopPrev ? -1 : dir
PMax = dir==1 ? longStop: shortStop


///MOST
zxLag1 = AP2/2==round(AP2/2) ? AP2/2 : (AP2 - 1) / 2
zxEMAData1 = (src_most + (src_most - src_most[zxLag1]))
ZLEMA1 = ema(zxEMAData1, AP2)

getMA1(src, length) =>
    ma1 = 0.0
    if mav1 == "EMovA"
        ma1 := ema(close, 8)
        ma1

    if mav1 == "ZLEMovA"
        ma1 := ZLEMA1
        ma1

Trail1 = getMA1(src, length)
SL2 = Trail1*AF2 // Stop Loss

Trail2 = 0.0
Trail2 := iff(Trail1>nz(Trail2[1],0) and Trail1[1]>nz(Trail2[1],0),max(nz(Trail2[1],0),Trail1-SL2),iff(Trail1<nz(Trail2[1],0) and Trail1[1]<nz(Trail2[1],0),min(nz(Trail2[1],0),Trail1+SL2),iff(Trail1>nz(Trail2[1],0),Trail1-SL2,Trail1+SL2)))

Buy = crossover(Trail1, Trail2)
Sell = crossunder(Trail1, Trail2)
SR=(iff(Trail1 > Trail2 ,1, iff(Trail2 > Trail1,-1,0)))


////T3 TILLSON 1


col1 = T3 > T3[1]
col3 = T3 < T3[1]
col4 = T33 > T33[1]
col5 = T33 < T33[1]
color_1 = col1 ? color.green : col3 ? color.red : color.yellow
color_4 = col4 ? color.green : col5 ? color.red : color.yellow


e12 = ema((high + low + 2 * close) / 4, length12)
e22 = ema(e12, length12)
e32 = ema(e22, length12)
e42 = ema(e32, length12)
e52 = ema(e42, length12)
e62 = ema(e52, length12)
c12 = -a12 * a12 * a12
c22 = 3 * a12 * a12 + 3 * a12 * a12 * a12
c32 = -6 * a12 * a12 - 3 * a12 - 3 * a12 * a12 * a12
c42 = 1 + 3 * a12 + a12 * a12 * a12 + 3 * a12 * a12
T32 = c12 * e62 + c22 * e52 + c32 * e42 + c42 * e32

col12 = T32 > T32[1]
col32 = T32 < T32[1]


///TP BB ve SNAKE

h = ema(high, len)
l = ema(low, len)

hp = h / h[len]
lp = l / l[len]

avg = avg(hp, lp)

havg = ema(highest(avg, len), len)
lavg = ema(lowest(avg, len), len)

avg2 = avg(havg, lavg)
avg3 = avg(havg, avg2)
avg4 = avg(havg, avg3)

dif = havg - avg2

ust = havg + dif
alt = lavg - dif

///BB on MACD

SDev = 0.0
banda_supe = 0.0
banda_inf = 0.0
m_rapida = ema(close,rapida)
m_lenta = ema(close,lenta)
BBMacd = m_rapida - m_lenta
Avg = ema(BBMacd,9)
SDev := stdev(BBMacd,9)
banda_supe := Avg + stdv * SDev
banda_inf := Avg - stdv * SDev

color2 = col12 ? color.blue : col32 ? color.purple : color.yellow

TS1 = plot(Trail1, "ExMov", style=plot.style_line,color=Trail1 > Trail2 ? color.blue : color.yellow, linewidth=2)
TS2 = plot(Trail2, "Most", style=plot.style_line,color=Trail1 > Trail2 ? color.green : color.red, linewidth=2)


tp1 = tpfiltre ? crossunder(BBMacd,banda_supe)  and (avg>avg2) and (MAvg>PMax) and nz(MAvg[10]) > nz(PMax[10]) : crossunder(BBMacd,banda_supe)  and (avg>avg4) and (MAvg>PMax) and nz(MAvg[15]) > nz(PMax[15])
plotshape(tp1 and tp1show, title="TP1", text="TP1", location=location.abovebar, style=shape.labeldown, size=size.tiny, color=color.aqua, textcolor=color.white,transp=0)

plot(T31Show ? T3 : na, color=color_1, linewidth=3, title="T3")
plot(T32Show ? T33 : na, color=color_4, linewidth=3, title="T3 Filter")
plot(T3FiboLine and T32 ? T32 : na, color=color2, linewidth=2, title="T3fibo")
plot(showsupport ? MAvg : na, color=#0585E1, linewidth=2, title="Moving Avg Line")
pALL=plot(PMax, color=color.red, linewidth=2, title="PMax", transp=100)
alertcondition(crossover(MAvg, PMax), title="1- Alım Sinyali", message="{{ticker}}, kapanış fiyatı = {{close}} için Alım Sinyali!")
alertcondition(crossunder(MAvg, PMax), title="2- Satım Sinyali", message="{{ticker}}, kapanış fiyatı = {{close}} için Satım Sinyali!")


buySignalk = filtrelemeacik ? filtreleme ? (crossover(MAvg, PMax) and T33>T3) : (crossover(MAvg, PMax) and src>T3): crossover(MAvg, PMax)


plotshape(buySignalk and showsignalsk ? PMax*0.995 : na, title="AL", text="AL", location=location.absolute, style=shape.labelup, size=size.tiny, color=color.green, textcolor=color.white, transp=0)
sellSignallk = crossunder(MAvg, PMax)
plotshape(sellSignallk and showsignalsk ? PMax*1.005 : na, title="Sat", text="SAT", location=location.absolute, style=shape.labeldown, size=size.tiny, color=color.red, textcolor=color.white, transp=0)
buySignalc = crossover(src, PMax)
plotshape(buySignalc and showsignalsc ? PMax*0.995 : na, title="AL-Fiyat", text="AL", location=location.absolute, style=shape.labelup, size=size.tiny, color=#0F18BF, textcolor=color.white, transp=0)
sellSignallc = crossunder(src, PMax)
plotshape(sellSignallc and showsignalsc ? PMax*1.005 : na, title="Sat-Fiyat", text="SAT", location=location.absolute, style=shape.labeldown, size=size.tiny, color=#0F18BF, textcolor=color.white, transp=0)
mPlot = plot(ohlc4, title="", style=plot.style_circles, linewidth=0,display=display.none)
longFillColor = highlighting ? (MAvg>PMax ? color.green : na) : na
shortFillColor = highlighting ? (MAvg<PMax ? color.red : na) : na
fill(mPlot, pALL, title="Yükseliş Trend Bulutu", color=longFillColor)
fill(mPlot, pALL, title="Düşüş Trend Bulutu", color=shortFillColor)


tplevel = 0
//tplevel := tp1 ? nz(tplevel[1])==0 ? 1 : nz(tplevel[1])==1 ? 2 : 0 : nz(tplevel[1])==0 ? 0 : nz(tplevel[1])==1 ? 1 : nz(tplevel[1])==2 ? 2 : sellSignallk ? 0 : 0
//tplevel := sellSignallk or MAvg < PMax ? 0 : tp1 and nz(tplevel[1])==8 ? 9 : tp1 and nz(tplevel[1])==7 ? 8 : tp1 and nz(tplevel[1])==6 ? 7 : tp1 and nz(tplevel[1])==5 ? 6 : tp1 and nz(tplevel[1])==4 ? 5 : tp1 and nz(tplevel[1])==3 ? 4 : tp1 and nz(tplevel[1])==2 ? 3 : tp1 and nz(tplevel[1])==1 ? 2 : nz(tplevel[1])==1 ? 1 : nz(tplevel[1])==2 ? 2 : nz(tplevel[1])==3 ? 3 : nz(tplevel[1])==4 ? 4 : nz(tplevel[1])==5 ? 5 : nz(tplevel[1])==6 ? 6 : nz(tplevel[1])==7 ? 7 : nz(tplevel[1])==8 ? 8 : nz(tplevel[1])==9 ? 9 : 1
tplevel := sellSignallk or MAvg < PMax ? 0 : Trail1 < Trail2 ? 0 : tp1 and nz(tplevel[1])==1 ? 2 : nz(tplevel[1])==1 ? 1 : nz(tplevel[1])==2 ? 2 : 1

exitlevel = 0

exitlevel := sellSignallk or MAvg < PMax ? 0 : Sell and  nz(tplevel[1])==2 and nz(exitlevel[1])==1 ? 2 : Sell and  nz(tplevel[1])==2 and nz(exitlevel[1])==2 ? 3 : Sell and  nz(tplevel[1])==2 and nz(exitlevel[1])==3 ? 4 :  Sell and  nz(tplevel[1])==2 and nz(exitlevel[1])==4 ? 5: nz(exitlevel[1])==1 ? 1  : nz(exitlevel[1])==2 ? 2 : nz(exitlevel[1])==3 ? 3 : nz(exitlevel[1])==4 ? 4 : nz(exitlevel[1])==5 ? 5:  1

plotchar(tplevel==0 and tplevelshow, char='0', color=color.green)
plotchar(tplevel==1 and tplevelshow , char='1', color=color.green)
plotchar(tplevel==2 and tplevelshow, char='2', color=color.green)


plotshape(exitlevel==0 and tplevelshow , text='0', location=location.belowbar, style=shape.triangledown, color=color.red)
plotshape(exitlevel==1 and tplevelshow , text='1', location=location.belowbar, style=shape.triangledown, color=color.red)
plotshape(exitlevel==2 and tplevelshow , text='2', location=location.belowbar, style=shape.triangledown, color=color.red)
plotshape(exitlevel==3 and tplevelshow , text='3', location=location.belowbar, style=shape.triangledown, color=color.red)
plotshape(exitlevel==4 and tplevelshow , text='4', location=location.belowbar, style=shape.triangledown, color=color.red)
plotshape(exitlevel==5 and tplevelshow , text='5', location=location.belowbar, style=shape.triangledown, color=color.red)

plotshape(nz(tplevel[1])==2 and Sell and exitlevel>=2, title="TP", text="TP", location=location.abovebar, style=shape.labeldown, size=size.tiny, color=color.lime, textcolor=color.white,transp=0)

if (buySignalk)
    strategy.entry("Buy", strategy.long)

if nz(tplevel[1])==2 and Sell and exitlevel==2
    strategy.exit ("Exit1", from_entry="Buy", limit=close, qty_percent = 33.3)

//if nz(tplevel[1])==2 and Sell and exitlevel==3
  //  strategy.exit ("Exit2", from_entry="Buy", limit=close, qty_percent = 33.3)

if nz(tplevel[1])==2 and Sell and exitlevel==3
    strategy.exit ("Exit2", from_entry="Buy", limit=close, qty_percent = 50)

if nz(tplevel[1])==2 and Sell and exitlevel==4
    strategy.exit ("Exit3", from_entry="Buy", limit=close)


if (sellSignallk)
    strategy.close_all()