Strategy Based on Exponential Moving Average and MACD Indicator

Author: ChaoZhang, Date: 2023-12-08 16:58:01
Tags:

img

Overview

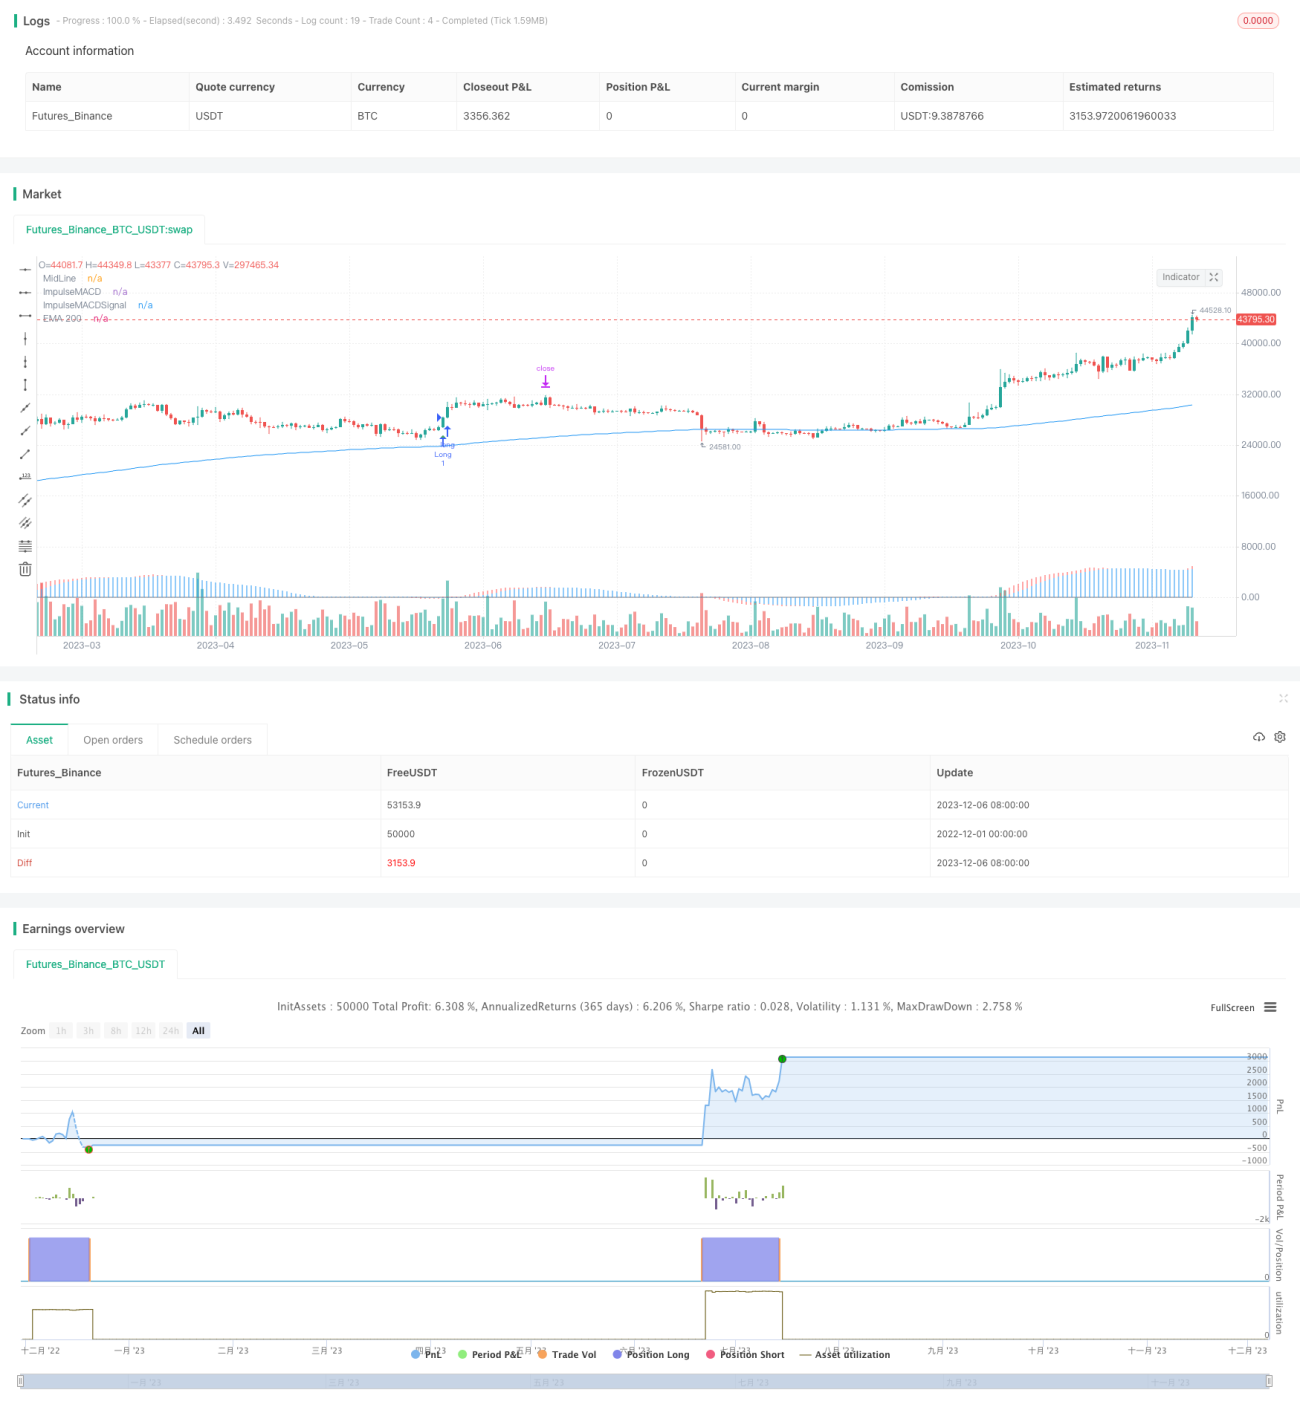
This strategy combines the breakout signals from exponential moving average and MACD indicator, with both long and short holding periods, to realize profits through trend following and mean reversion trading.

Strategy Principle

The strategy is mainly based on:

  1. Calculate 200-day EMA to determine the major trend direction. Closing price above 200-EMA indicates upward trend, while below indicates downward trend.

  2. Calculate EMA based on the median price of highest, lowest and closing prices, then get the difference between the EMA and highest/lowest prices to construct the MACD histogram.

  3. Calculate the 9-day MA of MACD histogram to construct the MACD signal line.

  4. A buy signal is generated when MACD crosses above signal line, while a sell signal when MACD crosses below signal line.

  5. Combine the analysis of major trends to determine whether the market is at the start of a new trend or just a short-term reversal.

Advantages

The strategy combines both trend following and mean reversion trading, which can both track long-term trends and capture short-term reversal opportunities to cope with different market conditions.

The main advantages include:

  1. 200-day EMA determines the major trend direction, avoids trading against trends.

  2. MACD indicator is sensitive to short-term price changes and can capture profitable reversal signals.

  3. Different parameters for MACD components can generate trading signals across time frames.

  4. Integrates stop loss strategies to effectively control single trade loss.

Risks

The main risks include:

  1. Time lag may exist between trading signals from long-term and short-term indicators. Judgements on major trend are important.

  2. MACD as mean reversion indicator may underperform during strong trends.

  3. Improper stop loss placement may result in premature stop loss trigger or oversized loss.

  4. Too frequent breakout signals may introduce more false signals.

Solutions:

  1. Optimize MACD parameters to adjust indicator sensitivity.

  2. Combine other indicators to determine market conditions, avoid blindly following MACD signals.

  3. Test and optimize stop loss strategy parameters.

  4. Add filters to reduce false signals.

Optimization Directions

The strategy can be optimized through:

  1. Optimize parameters for moving average and MACD to obtain more effective trading signals.

  2. Add other indicators like volume, RSI to enhance strategy efficacy.

  3. Set up position sizing rules rather than fixed quantity for every trade.

  4. Add more advanced exit rules on top of stop loss, e.g. profit target, trailing stop.

  5. Backtest with more realistic fee settings to simulate real trading.

  6. Perform walk forward analysis, robustness test to improve reliability.

Conclusion

The strategy balances trend following and mean reversion trading. The essence lies in appropriate parameter tuning and correct understanding of major trends. By optimizing parameters, adding filters the strategy can make better trading signal judgement and achieve more steady profits. Overall speaking, this strategy has high integration degree and promising application prospects.


/*backtest
start: 2022-12-01 00:00:00
end: 2023-12-07 00:00:00
period: 1d
basePeriod: 1h
exchanges: [{"eid":"Futures_Binance","currency":"BTC_USDT"}]
*/

//@version=4
strategy("Strategia EMA + Impulse MACD", shorttitle="EMA+IMACD", overlay=true)

// Impostazioni
ema_length = input(200, title="Periodo EMA a 200", type=input.integer)
lengthMA = input(34, title="Periodo EMA", type=input.integer)
lengthSignal = input(9, title="Periodo Signal", type=input.integer)
lengthImpulseMACD = input(12, title="Periodo Impulse MACD", type=input.integer)
lengthImpulseMACDSignal = input(9, title="Periodo Impulse MACD Signal", type=input.integer)
stopLossPeriod = input(20, title="Periodo Stop Loss", type=input.integer)

var float ema200 = na
if bar_index >= ema_length
    ema200 := ema(close, ema_length)

// Impulse MACD
var float hi = na
var float lo = na
var float mi = na
var float impulseMACD = na
var float impulseMACDSignal = na

calc_smma(src, len) =>
    var float smma = na
    if na(smma)
        smma := sma(src, len)
    else
        smma := (smma[1] * (len - 1) + src) / len
    smma

calc_zlema(src, length) =>
    ema1 = ema(src, length)
    ema2 = ema(ema1, length)
    d = ema1 - ema2
    ema1 + d

if bar_index >= lengthMA
    src = hlc3
    hi := calc_smma(high, lengthMA)
    lo := calc_smma(low, lengthMA)
    mi := calc_zlema(src, lengthMA)

    impulseMACD := (mi > hi) ? (mi - hi) : (mi < lo) ? (mi - lo) : 0
    impulseMACDSignal := sma(impulseMACD, lengthSignal)

// Calcolo dello stop loss
var float stopLossLong = na
var float stopLossShort = na

stopLossLong := lowest(low, stopLossPeriod)
stopLossShort := highest(high, stopLossPeriod)

// Calcolo del take profit
var float takeProfitLong = na
var float takeProfitShort = na

if not na(stopLossLong)
    takeProfitLong := close + (close - stopLossLong) * 1.5
if not na(stopLossShort)
    takeProfitShort := close - (stopLossShort - close) * 1.5

// Condizioni per aprire una posizione long
longCondition = not na(ema200) and not na(impulseMACD) and not na(impulseMACDSignal) and close > ema200 and impulseMACD < 0 and impulseMACDSignal < 0 and crossover(impulseMACD, impulseMACDSignal)

// Condizioni per aprire una posizione short
shortCondition = not na(ema200) and not na(impulseMACD) and not na(impulseMACDSignal) and close < ema200 and impulseMACD > 0 and impulseMACDSignal > 0 and crossunder(impulseMACD, impulseMACDSignal)

// Disegna l'EMA 200 sul grafico
plot(ema200, color=color.blue, title="EMA 200")

// Imposta lo stop loss e il take profit
strategy.entry("Long", strategy.long, when=longCondition)
strategy.entry("Short", strategy.short, when=shortCondition)
strategy.exit("Take Profit/Stop Loss Long", from_entry="Long", stop=stopLossLong, limit=takeProfitLong)
strategy.exit("Take Profit/Stop Loss Short", from_entry="Short", stop=stopLossShort, limit=takeProfitShort)

// Impulse MACD
plot(0, color=color.gray, linewidth=1, title="MidLine")
plot(impulseMACD, color=color.red, linewidth=2, title="ImpulseMACD", style=plot.style_histogram)
plot(impulseMACDSignal, color=color.blue, linewidth=2, title="ImpulseMACDSignal", style=plot.style_histogram)

// Disegna le operazioni long e short sul grafico
plotshape(series=longCondition, location=location.belowbar, color=color.green, style=shape.triangleup, title="Long Entry")
plotshape(series=shortCondition, location=location.abovebar, color=color.red, style=shape.triangledown, title="Short Entry")


More