Bollinger Bands Prozentuale Handelsstrategie

Überblick
Die Strategie basiert auf dem Brin-Band-Indikator, kombiniert mit einem Moving Average und einem ATR-Technik-Indikator, um ein kurzperiodiges Breakout-System zu realisieren. Die Strategie ermittelt überkaufliche und überverkaufliche Preise durch Berechnung des relativen Positionsanteils der Preise innerhalb des Brin-Band-Kanals, um ein Handelssignal zu erzeugen, kombiniert mit einem neuen Breakout des Hoch-Low-Punkts.
Strategieprinzip
- Berechnung der Brinkennetz-Strecke und des Anteils der Preise an der relative Position innerhalb der Strecke
- Der Moving Average wird für den Eröffnungspreis, den Schlusspreis, den Höchstpreis und den Tiefpreis berechnet.
- Berechnung der ATR-Indikatoren in Verbindung mit der Einstellung einer Stop-Line
- Beurteilen Sie, ob der Preis in der Nähe eines neuen Höchst- oder Tiefstwerts ist
- Der Jahreshoch- und -Tiefstpreis wird in Kombination mit dem Preis für die größeren Ebenen verwendet.
- Beurteilen Sie, ob ein Handelssignal über die Brin-Band-Prozentsatzänderungen und neue Höhen und Tiefen gesendet wird
Die Strategie nutzt die Bollinger Bands, um die Marktfluktuation zu bestimmen. Die Breite der Bollinger Bands wird durch die Standarddifferenz bestimmt. Der Preis ist ein Kaufpunkt, wenn er von der Bollinger Band abgeht, und der Preis ist ein Verkaufspunkt, wenn er von der Bollinger Band aufgeht.
Strategische Vorteile
- Strenge Brin-Band-Gate-Break-Beurteilung reduziert Falschsignale
- Der Moving Average gleicht die Preise und erkennt die wahren Trends
- ATR-Indikator dynamischer Tracking-Stopp, der einzelne Verluste einschränkt
- Neue Höhen und Tiefen sowie jährliche Hoch- und Tiefurteile machen die Signale zuverlässiger
- Mehrfache Technik-Indikatoren für eine effizientere Strategie
Strategische Risiken und Lösungen
- Die falsche Einstellung der Brin-Band-Gateway-Parameter kann zu zu vielen False-Breakings führen. Verschiedene Parameterkombinationen sollten für optimale Ergebnisse getestet werden.
- Der Prozentsatz der höchsten und niedrigsten Preise, die mit einer größeren Bandbreite berechnet werden können, wenn der Schlusskurs als Referenzlinie einen Rückzug über die von ATR festgelegte Stop-Loss-Marge erreicht.
- Eine strenge Brin-Filterung kann eine Trendchance auf einer längeren Linie verpassen, wobei Filterbedingungen und Haltedauer entsprechend gelockert werden sollten.
- ATR-Indikatoren sind langsamer, um starke Preisschwankungen zu verfolgen, und sollten höherfrequente Schwankungen berücksichtigen, wie z. B. die tatsächliche Breite
- Neue Höhen und Neue Tiefen sind von kurzfristigen Geräuschen beeinträchtigt, wobei die statistische Signifikanz und die Nachhaltigkeit der Trends zu bewerten sind.
Richtung der Strategieoptimierung
- Verschiedene Kombinationen von Parametern werden getestet, um die optimalen Brin-Band-Parameter und die Länge der Moving Averages zu ermitteln
- Modellkombinationen in Kombination mit verschiedenen Brin-Band-Parametern oder Moving Averages
- Tests für die Anpassung an die Parameter für verschiedene Zeiträume und Sorten, um die Robustheit zu verbessern
- Kombination mit weiteren großer Ebenen, wie z. B. Sonnenstrahl-Ebenen, Brin-Band-Signale oder saisonalen Faktoren
- Beurteilung von Trendfollowing-Möglichkeiten zur Erweiterung der Strategie und des Gewinnraums
Zusammenfassen
Die Strategie kombiniert mehrere technische Instrumente wie Brin-Band-Prozentsätze, Moving Averages, ATR-Indikatoren, Neues Hoch, Neues Tief und Jahreshoch-Tief, um eine relativ strenge und effiziente Breakout-Handelsstrategie in kurzen Perioden zu erstellen. Ihr herausragender Vorteil besteht darin, verschiedene Arten von Instrumenten zu nutzen, um den Lärm zu reduzieren und echte Trendsignale zu erkennen.
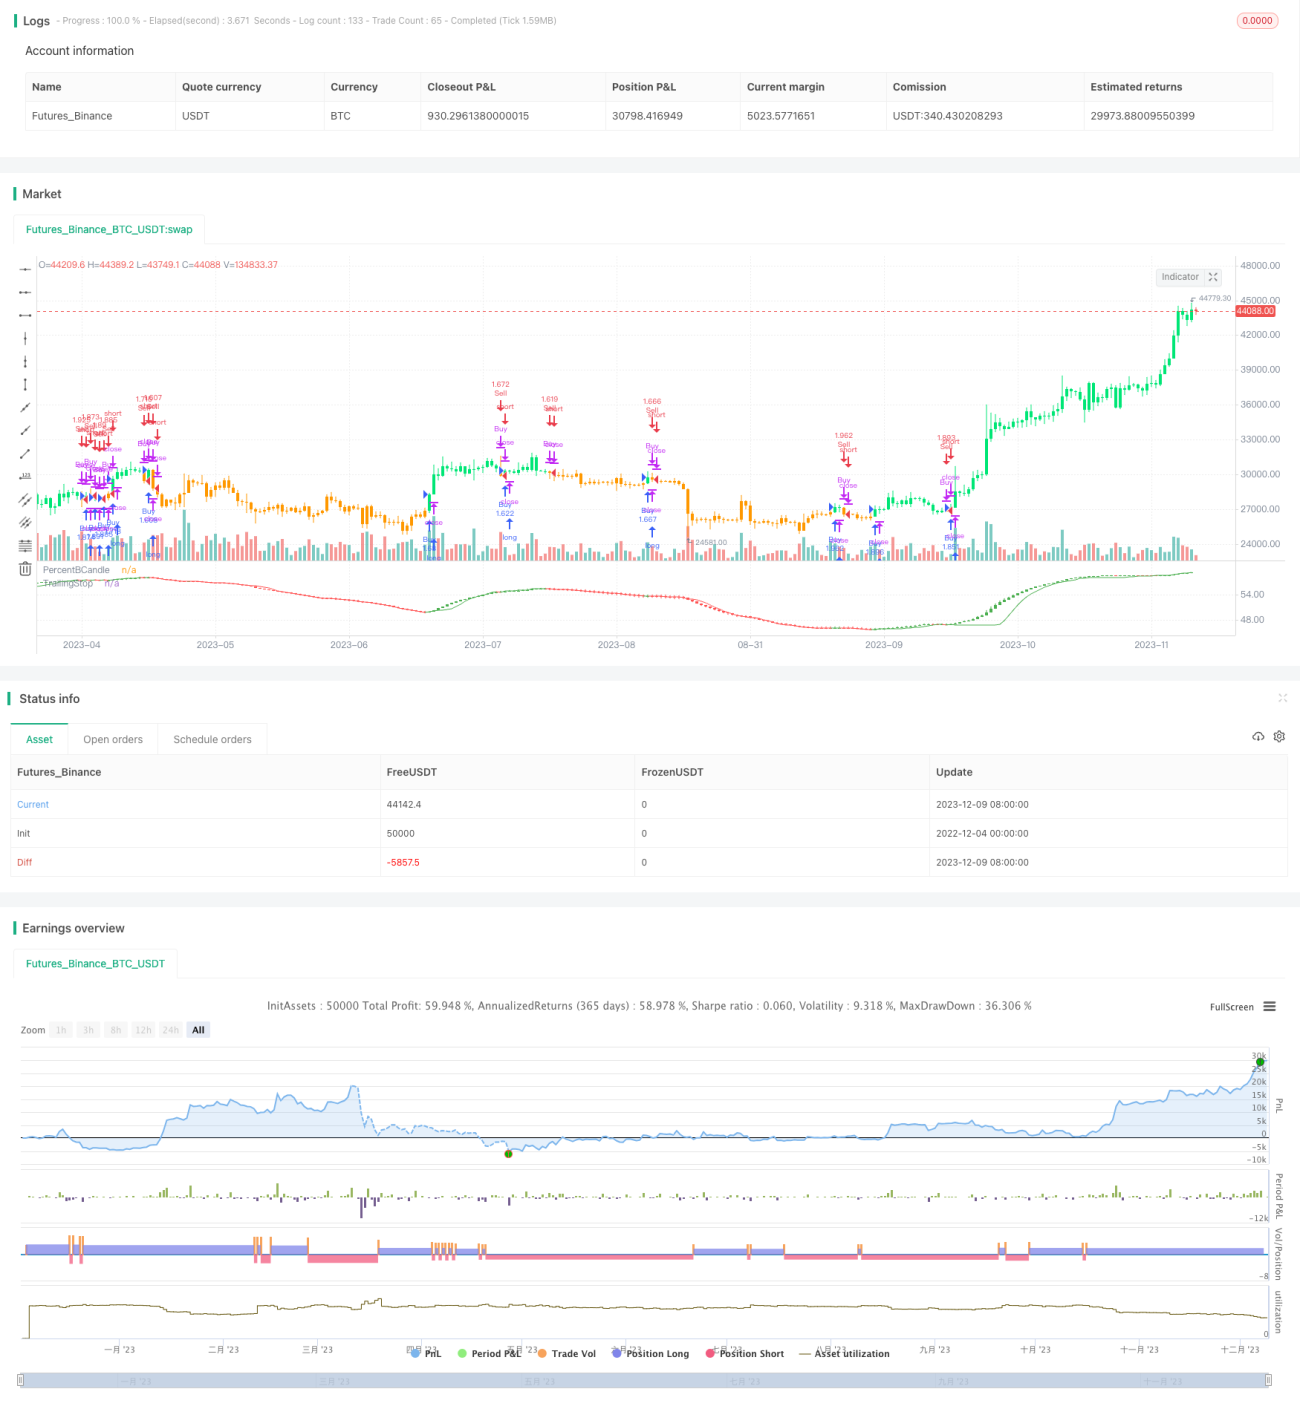
/*backtest
start: 2022-12-04 00:00:00
end: 2023-12-10 00:00:00
period: 1d
basePeriod: 1h
exchanges: [{"eid":"Futures_Binance","currency":"BTC_USDT"}]
*/

// This source code is subject to the terms of the Mozilla Public License 2.0 at https://mozilla.org/MPL/2.0/
// © HeWhoMustNotBeNamed

//@version=4- 1