Fusion Moving Average Multiple Crossover-Handelsstrategie


Erstellungsdatum: 2023-12-20 14:12:20 zuletzt geändert: 2023-12-20 14:12:20
Kopie: 0 Klicks: 632
1
konzentrieren Sie sich auf
1621
Anhänger

Fusion Moving Average Multiple Crossover-Handelsstrategie

Überblick

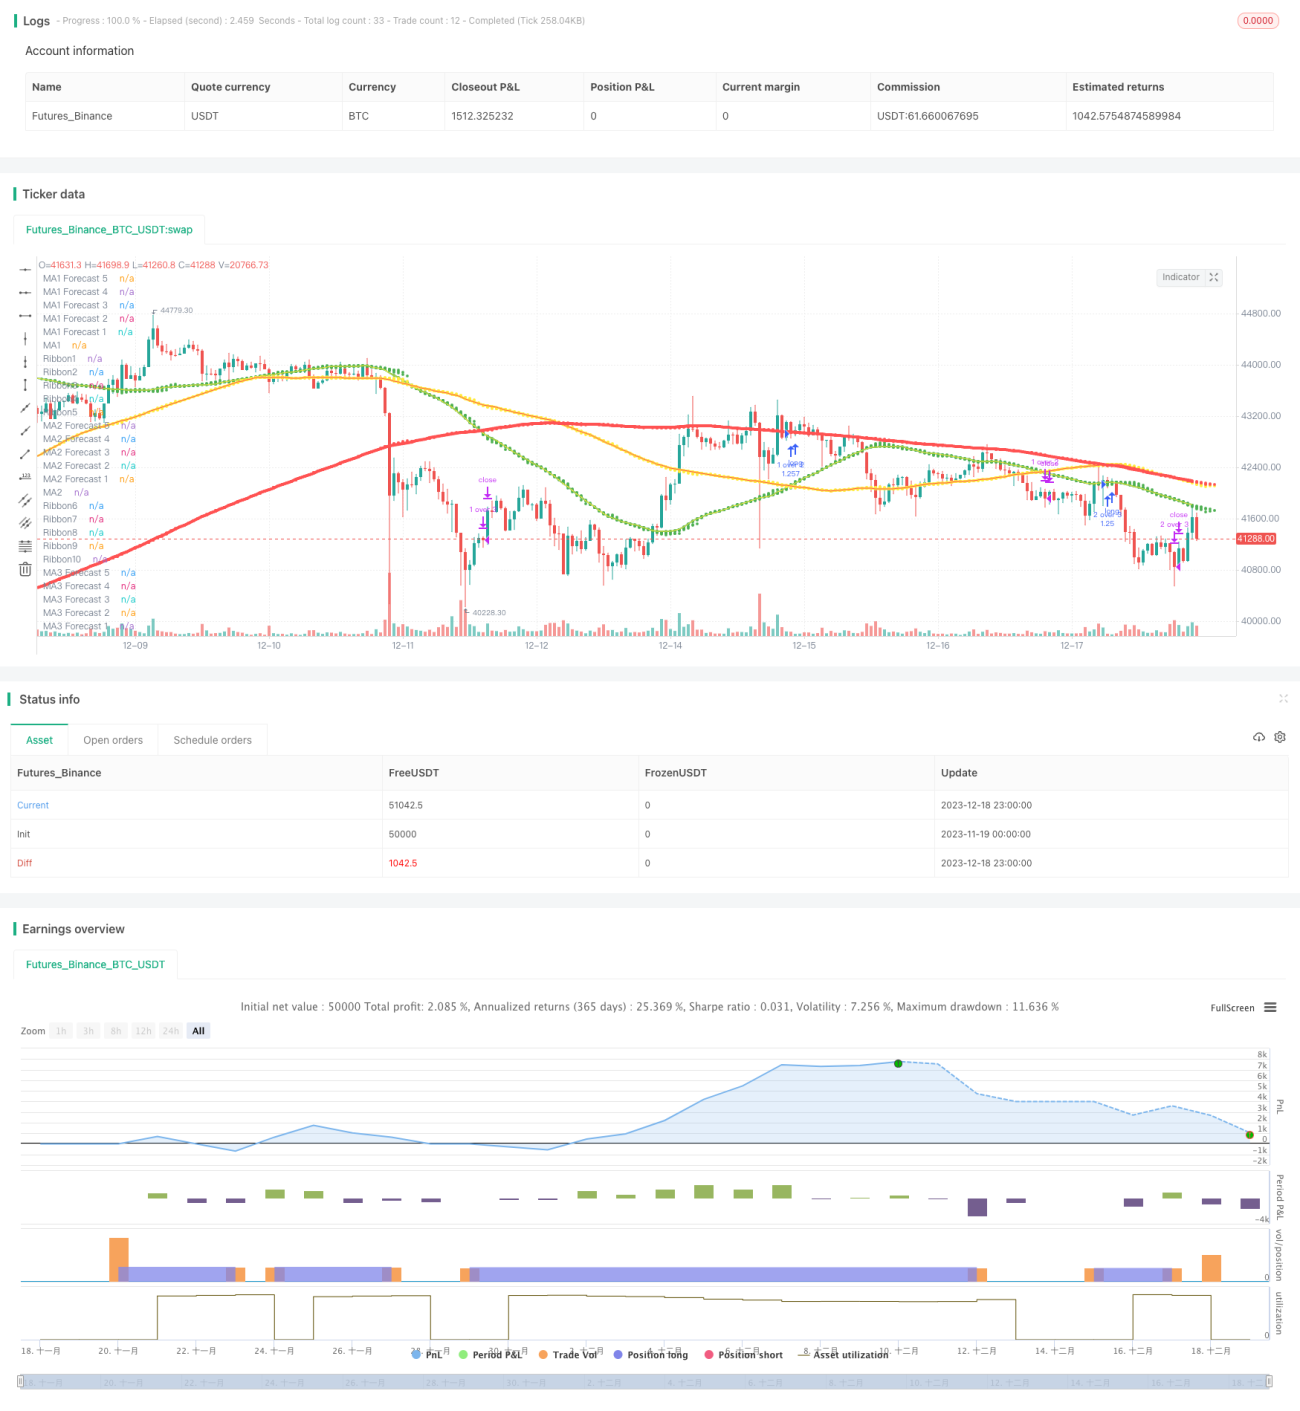
Die Strategie ist eine Handelsstrategie, die auf der Kreuzung von drei Moving Averages (MA1, MA2, MA3) basiert. Eine flexible Kombination von Handelsstrategien kann durch die Einstellung des Typs, der Periode, der Preisquelle und der Auflösung der drei Moving Averages und der Frage, ob der Handel zwischen ihnen erlaubt ist, erzielt werden.

Grundsätze

Die Strategie nutzt hauptsächlich die Kreuzung und Überschrift zwischen den drei Moving Averages als Handelssignale. Ein Long-Open-Signal wird erzeugt, wenn ein Moving Average mit kürzerer Periode von unten nach oben über einen Moving Average mit längerer Periode geht. Ein Plain-Signal wird erzeugt, wenn ein Moving Average mit kürzerer Periode von oben nach unten über einen Moving Average mit längerer Periode geht.

Der Benutzer kann frei wählen zwischen drei Arten von Moving Averages (SMA, EMA, etc.), Perioden, Preis-Datenquellen (Klusskurs, Höchstpreis, etc.) und K-Linie-Auflösung (Minuten-Linie, Tages-Linie, etc.). Außerdem kann er wählen, ob er einen Crossover zwischen den einzelnen Moving Averages eröffnet, um zu entscheiden, ob auf bestimmte Crossovers gehandelt werden soll.

Die Strategie setzt derzeit nur auf die Eröffnung und den Abschluss von Positionen zu Marktpreisen. Bei jeder Transaktion werden 100% der gesamten Eigenkapitalbeteiligung des Kontos investiert.

Vorteile

  1. Optimierung und Kombination von Parametern wie Typ und Periode von Moving Averages, die frei gewählt werden können, um das Risiko von Kurvenübereinstimmungen zu verringern
  2. Multiple Moving Average-Kreuzungen ergeben mehrere Handelsmöglichkeiten und erhöhen die Handelsfrequenz
  3. Die Verwendung von langen, mittleren und kurzen Moving Averages ermöglicht eine Balance zwischen Trend und Umkehr.
  4. Unterstützt verschiedene K-Line-Auflösungen und ermöglicht mehrere Zeitrahmen
  5. Selbstständige Vorhersagefunktion, um die Parameter-Eignung zu testen

Die Gefahr

  1. Eine große Anzahl von Parameterkombinationen könnte zu einer Überoptimierung führen
  2. Hohe Transaktionsfrequenz, möglicherweise erhöhte Transaktionsgebühren und Slip-Point-Kosten
  3. Die Eintrittskarten sind nicht limitiert.
  4. Multiple Moving Averages könnten Konfliktsignale geben
  5. Es können Unterschiede zwischen der Rückmeldung und der Festplatte vorliegen.

Optimierungsvorschläge

  1. Die Walks-Forward-Analyse wird verwendet, um einen effektiven Parameterbereich zu erhalten.
  2. Hinzufügen von Transaktionsgebühren und Gleitpunkte in der Rückmessung
  3. Versuchen Sie, die Marktpreisliste anstelle der Grenzpreisliste zu ersetzen.
  4. Mehr Filterbedingungen, um Konfliktsignale zu vermeiden
  5. Validierungsstrategien in der Simulation von Rückmeldungen in realen Umgebungen

Zusammenfassen

Die Strategie nutzt die Glatteigenschaften von Moving Averages und die Fähigkeit zur Mustererkennung von Kreuzsignalen. Der Benutzer kann die Parameter flexibel auswählen, um eine Balance zwischen Trendfolgen und Umkehrerkennung herzustellen. Gleichzeitig ist darauf zu achten, überoptimierte Risiken zu kontrollieren und die Stärke der Strategie in komplexen Märkten zu überprüfen, die reale Umgebungen simulieren.

Strategiequellcode
/*backtest
start: 2023-11-19 00:00:00
end: 2023-12-19 00:00:00
period: 1h
basePeriod: 15m
exchanges: [{"eid":"Futures_Binance","currency":"BTC_USDT"}]
*/

//@version=4 

//
// Pine Script v4
// @author BigBitsIO
// Script Library: https://www.tradingview.com/u/BigBitsIO/#published-scripts
//

// study(title, shorttitle, overlay, format, precision)
// https://www.tradingview.com/pine-script-reference/#fun_strategy 
strategy(shorttitle = "TManyMA Strategy - ST9 - Long Market Only", title="Triple Many Moving Averages", overlay=true, pyramiding=1, default_qty_type=strategy.percent_of_equity, default_qty_value=100)

// MA#Period is a variable used to store the indicator lookback period.  In this case, from the input.
// input - https://www.tradingview.com/pine-script-docs/en/v4/annotations/Script_inputs.html
MA1Period = input(50, title="MA1 Period", minval=1, step=1)
MA1Type = input(title="MA1 Type", defval="SMA", options=["RMA", "SMA", "EMA", "WMA", "HMA", "DEMA", "TEMA", "VWMA"])
MA1Source = input(title="MA1 Source", type=input.source, defval=close)
MA1Resolution = input(title="MA1 Resolution", defval="00 Current", options=["00 Current", "01 1m", "02 3m", "03 5m", "04 15m", "05 30m", "06 45m", "07 1h", "08 2h", "09 3h", "10 4h", "11 1D", "12 1W", "13 1M"])
MA1Visible = input(title="MA1 Visible", type=input.bool, defval=true) // Will automatically hide crossBovers containing this MA

MA2Period = input(100, title="MA2 Period", minval=1, step=1)
MA2Type = input(title="MA2 Type", defval="SMA", options=["RMA", "SMA", "EMA", "WMA", "HMA", "DEMA", "TEMA", "VWMA"])
MA2Source = input(title="MA2 Source", type=input.source, defval=close)
MA2Resolution = input(title="MA2 Resolution", defval="00 Current", options=["00 Current", "01 1m", "02 3m", "03 5m", "04 15m", "05 30m", "06 45m", "07 1h", "08 2h", "09 3h", "10 4h", "11 1D", "12 1W", "13 1M"])
MA2Visible = input(title="MA2 Visible", type=input.bool, defval=true) // Will automatically hide crossovers containing this MA

MA3Period = input(200, title="MA3 Period", minval=1, step=1)
MA3Type = input(title="MA3 Type", defval="SMA", options=["RMA", "SMA", "EMA", "WMA", "HMA", "DEMA", "TEMA", "VWMA"])
MA3Source = input(title="MA3 Source", type=input.source, defval=close)
MA3Resolution = input(title="MA3 Resolution", defval="00 Current", options=["00 Current", "01 1m", "02 3m", "03 5m", "04 15m", "05 30m", "06 45m", "07 1h", "08 2h", "09 3h", "10 4h", "11 1D", "12 1W", "13 1M"])
MA3Visible = input(title="MA3 Visible", type=input.bool, defval=true) // Will automatically hide crossovers containing this MA

ShowCrosses = input(title="Show Crosses", type=input.bool, defval=false)

ForecastBias = input(title="Forecast Bias", defval="Neutral", options=["Neutral", "Bullish", "Bearish"])
ForecastBiasPeriod = input(14, title="Forecast Bias Period")
ForecastBiasMagnitude = input(1, title="Forecast Bias Magnitude", minval=0.25, maxval=20, step=0.25)
ShowForecasts = input(title="Show Forecasts", type=input.bool, defval=true)

ShowRibbons = input(title="Show Ribbons", type=input.bool, defval=true)

TradeMA12Crosses = input(title="Trade MA 1-2 Crosses", type=input.bool, defval=true)
TradeMA13Crosses = input(title="Trade MA 1-3 Crosses", type=input.bool, defval=true)
TradeMA23Crosses = input(title="Trade MA 2-3 Crosses", type=input.bool, defval=true)


// MA# is a variable used to store the actual moving average value.
// if statements - https://www.tradingview.com/pine-script-reference/#op_if
// MA functions - https://www.tradingview.com/pine-script-reference/ (must search for appropriate MA)
// custom functions in  pine - https://www.tradingview.com/wiki/Declaring_Functions
ma(MAType, MASource, MAPeriod) =>
    if MAType == "SMA"
        ta.sma(MASource, MAPeriod)
    else
        if MAType == "EMA"
            ta.ema(MASource, MAPeriod)
        else
            if MAType == "WMA"
                ta.wma(MASource, MAPeriod)
            else
                if MAType == "RMA"
                    ta.rma(MASource, MAPeriod)
                else
                    if MAType == "HMA"
                        ta.wma(2*wma(MASource, MAPeriod/2)-ta.wma(MASource, MAPeriod), round(sqrt(MAPeriod)))
                    else
                        if MAType == "DEMA"
                            e = ta.ema(MASource, MAPeriod)
                            2 * e - ta.ema(e, MAPeriod)
                        else
                            if MAType == "TEMA"
                                e = ta.ema(MASource, MAPeriod)
                                3 * (e - ta.ema(e, MAPeriod)) + ta.ema(ema(e, MAPeriod), MAPeriod)
                            else
                                if MAType == "VWMA"
                                    ta.vwma(MASource, MAPeriod)
                                
res(MAResolution) =>
    if MAResolution == "00 Current"
        timeframe.period
    else
        if MAResolution == "01 1m"
            "1"
        else
            if MAResolution == "02 3m"
                "3"
            else
                if MAResolution == "03 5m"
                    "5"
                else
                    if MAResolution == "04 15m"
                        "15"
                    else
                        if MAResolution == "05 30m"
                            "30"
                        else
                            if MAResolution == "06 45m"
                                "45"
                            else
                                if MAResolution == "07 1h"
                                    "60"
                                else
                                    if MAResolution == "08 2h"
                                        "120"
                                    else
                                        if MAResolution == "09 3h"
                                            "180"
                                        else
                                            if MAResolution == "10 4h"
                                                "240"
                                            else
                                                if MAResolution == "11 1D"
                                                    "1D"
                                                else
                                                    if MAResolution == "12 1W"
                                                        "1W"
                                                    else
                                                        if MAResolution == "13 1M"
                                                            "1M"

// https://www.tradingview.com/pine-script-reference/#fun_request.security
MA1 = request.security(syminfo.tickerid, res(MA1Resolution), ma(MA1Type, MA1Source, MA1Period))     
MA2 = request.security(syminfo.tickerid, res(MA2Resolution), ma(MA2Type, MA2Source, MA2Period))
MA3 = request.security(syminfo.tickerid, res(MA3Resolution), ma(MA3Type, MA3Source, MA3Period))   
                    
// Plotting crossover/unders for all combinations of crosses
// Crossovers no longer detected in label code, they need to be re-used for strategy - crosses and visibility must be set
MA12Crossover = MA1Visible and MA2Visible and ta.crossover(MA1, MA2)
MA12Crossunder = MA1Visible and MA2Visible and ta.crossunder(MA1, MA2)
MA13Crossover = MA1Visible and MA3Visible and ta.crossover(MA1, MA3)
MA13Crossunder = MA1Visible and MA3Visible and ta.crossunder(MA1, MA3)
MA23Crossover = MA2Visible and MA3Visible and ta.crossover(MA2, MA3)
MA23Crossunder = MA2Visible and MA3Visible and ta.crossunder(MA2, MA3)

// https://www.tradingview.com/pine-script-reference/v4/#fun_label%7Bdot%7Dnew
if ShowCrosses and MA12Crossunder
    lun1 = label.new(bar_index, na, tostring(MA1Period)+' '+MA1Type+' crossed under '+tostring(MA2Period)+' '+MA2Type, 
      color=color.red, 
      textcolor=color.red,
      style=label.style_xcross, size=size.small)
    label.set_y(lun1, MA1)
if ShowCrosses and MA12Crossover
    lup1 = label.new(bar_index, na, tostring(MA1Period)+' '+MA1Type+' crossed over '+tostring(MA2Period)+' '+MA2Type, 
      color=color.green, 
      textcolor=color.green,
      style=label.style_xcross, size=size.small)
    label.set_y(lup1, MA1)
if ShowCrosses and MA13Crossunder
    lun2 = label.new(bar_index, na, tostring(MA1Period)+' '+MA1Type+' crossed under '+tostring(MA3Period)+' '+MA3Type, 
      color=color.red, 
      textcolor=color.red,
      style=label.style_xcross, size=size.small)
    label.set_y(lun2, MA1)
if ShowCrosses and MA13Crossover
    lup2 = label.new(bar_index, na, tostring(MA1Period)+' '+MA1Type+' crossed over '+tostring(MA3Period)+' '+MA3Type, 
      color=color.green, 
      textcolor=color.green,
      style=label.style_xcross, size=size.small)
    label.set_y(lup2, MA1)
if ShowCrosses and MA23Crossunder
    lun3 = label.new(bar_index, na, tostring(MA2Period)+' '+MA2Type+' crossed under '+tostring(MA3Period)+' '+MA3Type, 
      color=color.red, 
      textcolor=color.red,
      style=label.style_xcross, size=size.small)
    label.set_y(lun3, MA2)
if ShowCrosses and MA23Crossover
    lup3 = label.new(bar_index, na, tostring(MA2Period)+' '+MA2Type+' crossed over '+tostring(MA3Period)+' '+MA3Type, 
      color=color.green, 
      textcolor=color.green,
      style=label.style_xcross, size=size.small)
    label.set_y(lup3, MA2) 

// plot - This will draw the information on the chart
// plot - https://www.tradingview.com/pine-script-docs/en/v4/annotations/plot_annotation.html
plot(MA1Visible ? MA1 : na, color=color.green, linewidth=2, title="MA1")
plot(MA2Visible ? MA2 : na, color=color.yellow, linewidth=3, title="MA2")
plot(MA3Visible ? MA3 : na, color=color.red, linewidth=4, title="MA3")


// Forecasting - forcasted prices are calculated using our MAType and MASource for the MAPeriod - the last X candles.
//              it essentially replaces the oldest X candles, with the selected source * X candles
// Bias - We'll add an "adjustment" for each additional candle being forecasted based on ATR of the previous X candles
// custom functions in  pine - https://www.tradingview.com/wiki/Declaring_Functions
bias(Bias, BiasPeriod) =>
    if Bias == "Neutral"
        0
    else
        if Bias == "Bullish"
            (atr(BiasPeriod) * ForecastBiasMagnitude)
        else
            if Bias == "Bearish"
                ((atr(BiasPeriod)  * ForecastBiasMagnitude) * -1) // multiplying by -1 to make it a negative, bearish bias


// Note - Can not show forecasts on different resolutions at the moment, x-axis is an issue
Bias = bias(ForecastBias, ForecastBiasPeriod) // 14 is default atr period
MA1Forecast1 = (request.security(syminfo.tickerid, res(MA1Resolution), ma(MA1Type, MA1Source, MA1Period - 1)) * (MA1Period - 1) + ((MA1Source * 1) + (Bias * 1))) / MA1Period
MA1Forecast2 = (request.security(syminfo.tickerid, res(MA1Resolution), ma(MA1Type, MA1Source, MA1Period - 2)) * (MA1Period - 2) + ((MA1Source * 2) + (Bias * 2))) / MA1Period
MA1Forecast3 = (request.security(syminfo.tickerid, res(MA1Resolution), ma(MA1Type, MA1Source, MA1Period - 3)) * (MA1Period - 3) + ((MA1Source * 3) + (Bias * 3))) / MA1Period
MA1Forecast4 = (request.security(syminfo.tickerid, res(MA1Resolution), ma(MA1Type, MA1Source, MA1Period - 4)) * (MA1Period - 4) + ((MA1Source * 4) + (Bias * 4))) / MA1Period
MA1Forecast5 = (request.security(syminfo.tickerid, res(MA1Resolution), ma(MA1Type, MA1Source, MA1Period - 5)) * (MA1Period - 5) + ((MA1Source * 5) + (Bias * 5))) / MA1Period

plot(MA1Resolution == "00 Current" and ShowForecasts and MA1Visible ? MA1Forecast1 : na, color=color.green, linewidth=1, style=plot.style_circles, title="MA1 Forecast 1", offset=1, show_last=1)
plot(MA1Resolution == "00 Current" and ShowForecasts and MA1Visible ? MA1Forecast2 : na, color=color.green, linewidth=1, style=plot.style_circles, title="MA1 Forecast 2", offset=2, show_last=1)
plot(MA1Resolution == "00 Current" and ShowForecasts and MA1Visible ? MA1Forecast3 : na, color=color.green, linewidth=1, style=plot.style_circles, title="MA1 Forecast 3", offset=3, show_last=1)
plot(MA1Resolution == "00 Current" and ShowForecasts and MA1Visible ? MA1Forecast4 : na, color=color.green, linewidth=1, style=plot.style_circles, title="MA1 Forecast 4", offset=4, show_last=1)
plot(MA1Resolution == "00 Current" and ShowForecasts and MA1Visible ? MA1Forecast5 : na, color=color.green, linewidth=1, style=plot.style_circles, title="MA1 Forecast 5", offset=5, show_last=1)


MA2Forecast1 = (request.security(syminfo.tickerid, res(MA2Resolution), ma(MA2Type, MA2Source, MA2Period - 1)) * (MA2Period - 1) + ((MA1Source * 1) + (Bias * 1))) / MA2Period
MA2Forecast2 = (request.security(syminfo.tickerid, res(MA2Resolution), ma(MA2Type, MA2Source, MA2Period - 2)) * (MA2Period - 2) + ((MA1Source * 2) + (Bias * 2))) / MA2Period
MA2Forecast3 = (request.security(syminfo.tickerid, res(MA2Resolution), ma(MA2Type, MA2Source, MA2Period - 3)) * (MA2Period - 3) + ((MA1Source * 3) + (Bias * 3))) / MA2Period
MA2Forecast4 = (request.security(syminfo.tickerid, res(MA2Resolution), ma(MA2Type, MA2Source, MA2Period - 4)) * (MA2Period - 4) + ((MA1Source * 4) + (Bias * 4))) / MA2Period
MA2Forecast5 = (request.security(syminfo.tickerid, res(MA2Resolution), ma(MA2Type, MA2Source, MA2Period - 5)) * (MA2Period - 5) + ((MA1Source * 5) + (Bias * 5))) / MA2Period

plot(MA2Resolution == "00 Current" and ShowForecasts and MA2Visible ? MA2Forecast1 : na, color=color.yellow, linewidth=1, style=plot.style_circles, title="MA2 Forecast 1", offset=1, show_last=1)
plot(MA2Resolution == "00 Current" and ShowForecasts and MA2Visible ? MA2Forecast2 : na, color=color.yellow, linewidth=1, style=plot.style_circles, title="MA2 Forecast 2", offset=2, show_last=1)
plot(MA2Resolution == "00 Current" and ShowForecasts and MA2Visible ? MA2Forecast3 : na, color=color.yellow, linewidth=1, style=plot.style_circles, title="MA2 Forecast 3", offset=3, show_last=1)
plot(MA2Resolution == "00 Current" and ShowForecasts and MA2Visible ? MA2Forecast4 : na, color=color.yellow, linewidth=1, style=plot.style_circles, title="MA2 Forecast 4", offset=4, show_last=1)
plot(MA2Resolution == "00 Current" and ShowForecasts and MA2Visible ? MA2Forecast5 : na, color=color.yellow, linewidth=1, style=plot.style_circles, title="MA2 Forecast 5", offset=5, show_last=1)


MA3Forecast1 = (request.security(syminfo.tickerid, res(MA3Resolution), ma(MA3Type, MA3Source, MA3Period - 1)) * (MA3Period - 1) + ((MA1Source * 1) + (Bias * 1))) / MA3Period
MA3Forecast2 = (request.security(syminfo.tickerid, res(MA3Resolution), ma(MA3Type, MA3Source, MA3Period - 2)) * (MA3Period - 2) + ((MA1Source * 2) + (Bias * 2))) / MA3Period
MA3Forecast3 = (request.security(syminfo.tickerid, res(MA3Resolution), ma(MA3Type, MA3Source, MA3Period - 3)) * (MA3Period - 3) + ((MA1Source * 3) + (Bias * 3))) / MA3Period
MA3Forecast4 = (request.security(syminfo.tickerid, res(MA3Resolution), ma(MA3Type, MA3Source, MA3Period - 4)) * (MA3Period - 4) + ((MA1Source * 4) + (Bias * 4))) / MA3Period
MA3Forecast5 = (request.security(syminfo.tickerid, res(MA3Resolution), ma(MA3Type, MA3Source, MA3Period - 5)) * (MA3Period - 5) + ((MA1Source * 5) + (Bias * 5))) / MA3Period

plot(MA3Resolution == "00 Current" and ShowForecasts and MA3Visible ? MA3Forecast1 : na, color=color.red, linewidth=1, style=plot.style_circles, title="MA3 Forecast 1", offset=1, show_last=1)
plot(MA3Resolution == "00 Current" and ShowForecasts and MA3Visible ? MA3Forecast2 : na, color=color.red, linewidth=1, style=plot.style_circles, title="MA3 Forecast 2", offset=2, show_last=1)
plot(MA3Resolution == "00 Current" and ShowForecasts and MA3Visible ? MA3Forecast3 : na, color=color.red, linewidth=1, style=plot.style_circles, title="MA3 Forecast 3", offset=3, show_last=1)
plot(MA3Resolution == "00 Current" and ShowForecasts and MA3Visible ? MA3Forecast4 : na, color=color.red, linewidth=1, style=plot.style_circles, title="MA3 Forecast 4", offset=4, show_last=1)
plot(MA3Resolution == "00 Current" and ShowForecasts and MA3Visible ? MA3Forecast5 : na, color=color.red, linewidth=1, style=plot.style_circles, title="MA3 Forecast 5", offset=5, show_last=1)


// Ribbon related code
// For Ribbons to work - they must use the same MAType, MAResolution and MASource.  This is to ensure the ribbons are fair between one to the other.
// Ribbons also will usually look better if MA1Period < MA2Period and MA2Period < MA3Period

// custom functions in  pine - https://www.tradingview.com/wiki/Declaring_Functions
// This function is used to calculate the period to be used on a ribbon based on existing MAs
rperiod(P1, P2, Step, Ribbons) =>
    ((array.abs(P1 - P2)) / (Ribbons + 1) * Step) + math.min(P1, P2)
    // divide by +1 so that 5 lines can show.  Divide by 5 and one line shows up on another MA

// MA1-MA2
Ribbon1 = request.security(syminfo.tickerid, res(MA1Resolution), ma(MA1Type, MA1Source, rperiod(MA1Period, MA2Period, 1, 5)))
Ribbon2 = request.security(syminfo.tickerid, res(MA1Resolution), ma(MA1Type, MA1Source, rperiod(MA1Period, MA2Period, 2, 5)))
Ribbon3 = request.security(syminfo.tickerid, res(MA1Resolution), ma(MA1Type, MA1Source, rperiod(MA1Period, MA2Period, 3, 5)))
Ribbon4 = request.security(syminfo.tickerid, res(MA1Resolution), ma(MA1Type, MA1Source, rperiod(MA1Period, MA2Period, 4, 5)))
Ribbon5 = request.security(syminfo.tickerid, res(MA1Resolution), ma(MA1Type, MA1Source, rperiod(MA1Period, MA2Period, 5, 5)))

plot(ShowRibbons and MA1Type == MA2Type and MA1Resolution == MA2Resolution and MA1Source == MA2Source ? Ribbon1 : na, color=color.green, linewidth=1, style=plot.style_line, title="Ribbon1", transp=90)
plot(ShowRibbons and MA1Type == MA2Type and MA1Resolution == MA2Resolution and MA1Source == MA2Source ? Ribbon2 : na, color=color.green, linewidth=1, style=plot.style_line, title="Ribbon2", transp=85)
plot(ShowRibbons and MA1Type == MA2Type and MA1Resolution == MA2Resolution and MA1Source == MA2Source ? Ribbon3 : na, color=color.green, linewidth=1, style=plot.style_line, title="Ribbon3", transp=80)
plot(ShowRibbons and MA1Type == MA2Type and MA1Resolution == MA2Resolution and MA1Source == MA2Source ? Ribbon4 : na, color=color.yellow, linewidth=1, style=plot.style_line, title="Ribbon4", transp=75)
plot(ShowRibbons and MA1Type == MA2Type and MA1Resolution == MA2Resolution and MA1Source == MA2Source ? Ribbon5 : na, color=color.yellow, linewidth=1, style=plot.style_line, title="Ribbon5", transp=70)

// MA2-MA3
Ribbon6 = request.security(syminfo.tickerid, res(MA2Resolution), ma(MA2Type, MA2Source, rperiod(MA2Period, MA3Period, 1, 5)))
Ribbon7 = request.security(syminfo.tickerid, res(MA2Resolution), ma(MA2Type, MA2Source, rperiod(MA2Period, MA3Period, 2, 5)))
Ribbon8 = request.security(syminfo.tickerid, res(MA2Resolution), ma(MA2Type, MA2Source, rperiod(MA2Period, MA3Period, 3, 5)))
Ribbon9 = request.security(syminfo.tickerid, res(MA2Resolution), ma(MA2Type, MA2Source, rperiod(MA2Period, MA3Period, 4, 5)))
Ribbon10 = request.security(syminfo.tickerid, res(MA2Resolution), ma(MA2Type, MA2Source, rperiod(MA2Period, MA3Period, 5, 5)))
        
plot(ShowRibbons and MA2Type == MA3Type and MA2Resolution == MA3Resolution and MA2Source == MA3Source ? Ribbon6 : na, color=color.yellow, linewidth=1, style=plot.style_line, title="Ribbon6", transp=70)
plot(ShowRibbons and MA2Type == MA3Type and MA2Resolution == MA3Resolution and MA2Source == MA3Source ? Ribbon7 : na, color=color.yellow, linewidth=1, style=plot.style_line, title="Ribbon7", transp=75)
plot(ShowRibbons and MA2Type == MA3Type and MA2Resolution == MA3Resolution and MA2Source == MA3Source ? Ribbon8 : na, color=color.red, linewidth=1, style=plot.style_line, title="Ribbon8", transp=80)
plot(ShowRibbons and MA2Type == MA3Type and MA2Resolution == MA3Resolution and MA2Source == MA3Source ? Ribbon9 : na, color=color.red, linewidth=1, style=plot.style_line, title="Ribbon9", transp=85)
plot(ShowRibbons and MA2Type == MA3Type and MA2Resolution == MA3Resolution and MA2Source == MA3Source ? Ribbon10 : na, color=color.red, linewidth=1, style=plot.style_line, title="Ribbon10", transp=90)

// Strategy Specific
if MA12Crossover and TradeMA12Crosses
    //https://www.tradingview.com/pine-script-reference/#fun_strategy{dot}entry
    strategy.entry("1 over 2", strategy.long, comment="1 over 2")
if MA12Crossunder and TradeMA12Crosses
    //https://www.tradingview.com/pine-script-reference/#fun_strategy{dot}close
    strategy.close("1 over 2")
    
if MA13Crossover and TradeMA13Crosses
    //https://www.tradingview.com/pine-script-reference/#fun_strategy{dot}entry
    strategy.entry("1 over 3", strategy.long, comment="1 over 3")
if MA13Crossunder and TradeMA13Crosses
    //https://www.tradingview.com/pine-script-reference/#fun_strategy{dot}close
    strategy.close("1 over 3")
    
if MA23Crossover and TradeMA23Crosses
    //https://www.tradingview.com/pine-script-reference/#fun_strategy{dot}entry
    strategy.entry("2 over 3", strategy.long, comment="2 over 3")
if MA23Crossunder and TradeMA23Crosses
    //https://www.tradingview.com/pine-script-reference/#fun_strategy{dot}close
    strategy.close("2 over 3")