Strategie für den Ausbruch aus einem dreifachen Supertrend mit gleitendem Durchschnitt
Überblick
Die Triple-Overtrend-Equilibrium-Breakout-Strategie ist eine relativ verbreitete Strategie, bei der der Übertrend-Equilibrium mit mehreren unterschiedlichen Parameter-Sätzen und den EMAs des Trends definiert wird, um die Trendrichtung zu erkennen und zu handeln. Die Hauptidee der Strategie besteht darin, einen Übertrend zu bilden, wenn mindestens zwei Übertrend-Equilibrium-Linien oberhalb des EMAs des Trends definieren, und einen Übertrend zu bilden, wenn mindestens zwei Übertrend-Equilibrium-Linien unterhalb des EMAs des Trends definieren.
Strategieprinzip
Die Strategie beurteilt Positionserhöhungen und Positionserhöhungen durch die Einrichtung von Supertrend-Mittellinien mit drei verschiedenen Parametern und einer EMA, die die Richtung der großen Trends definiert:
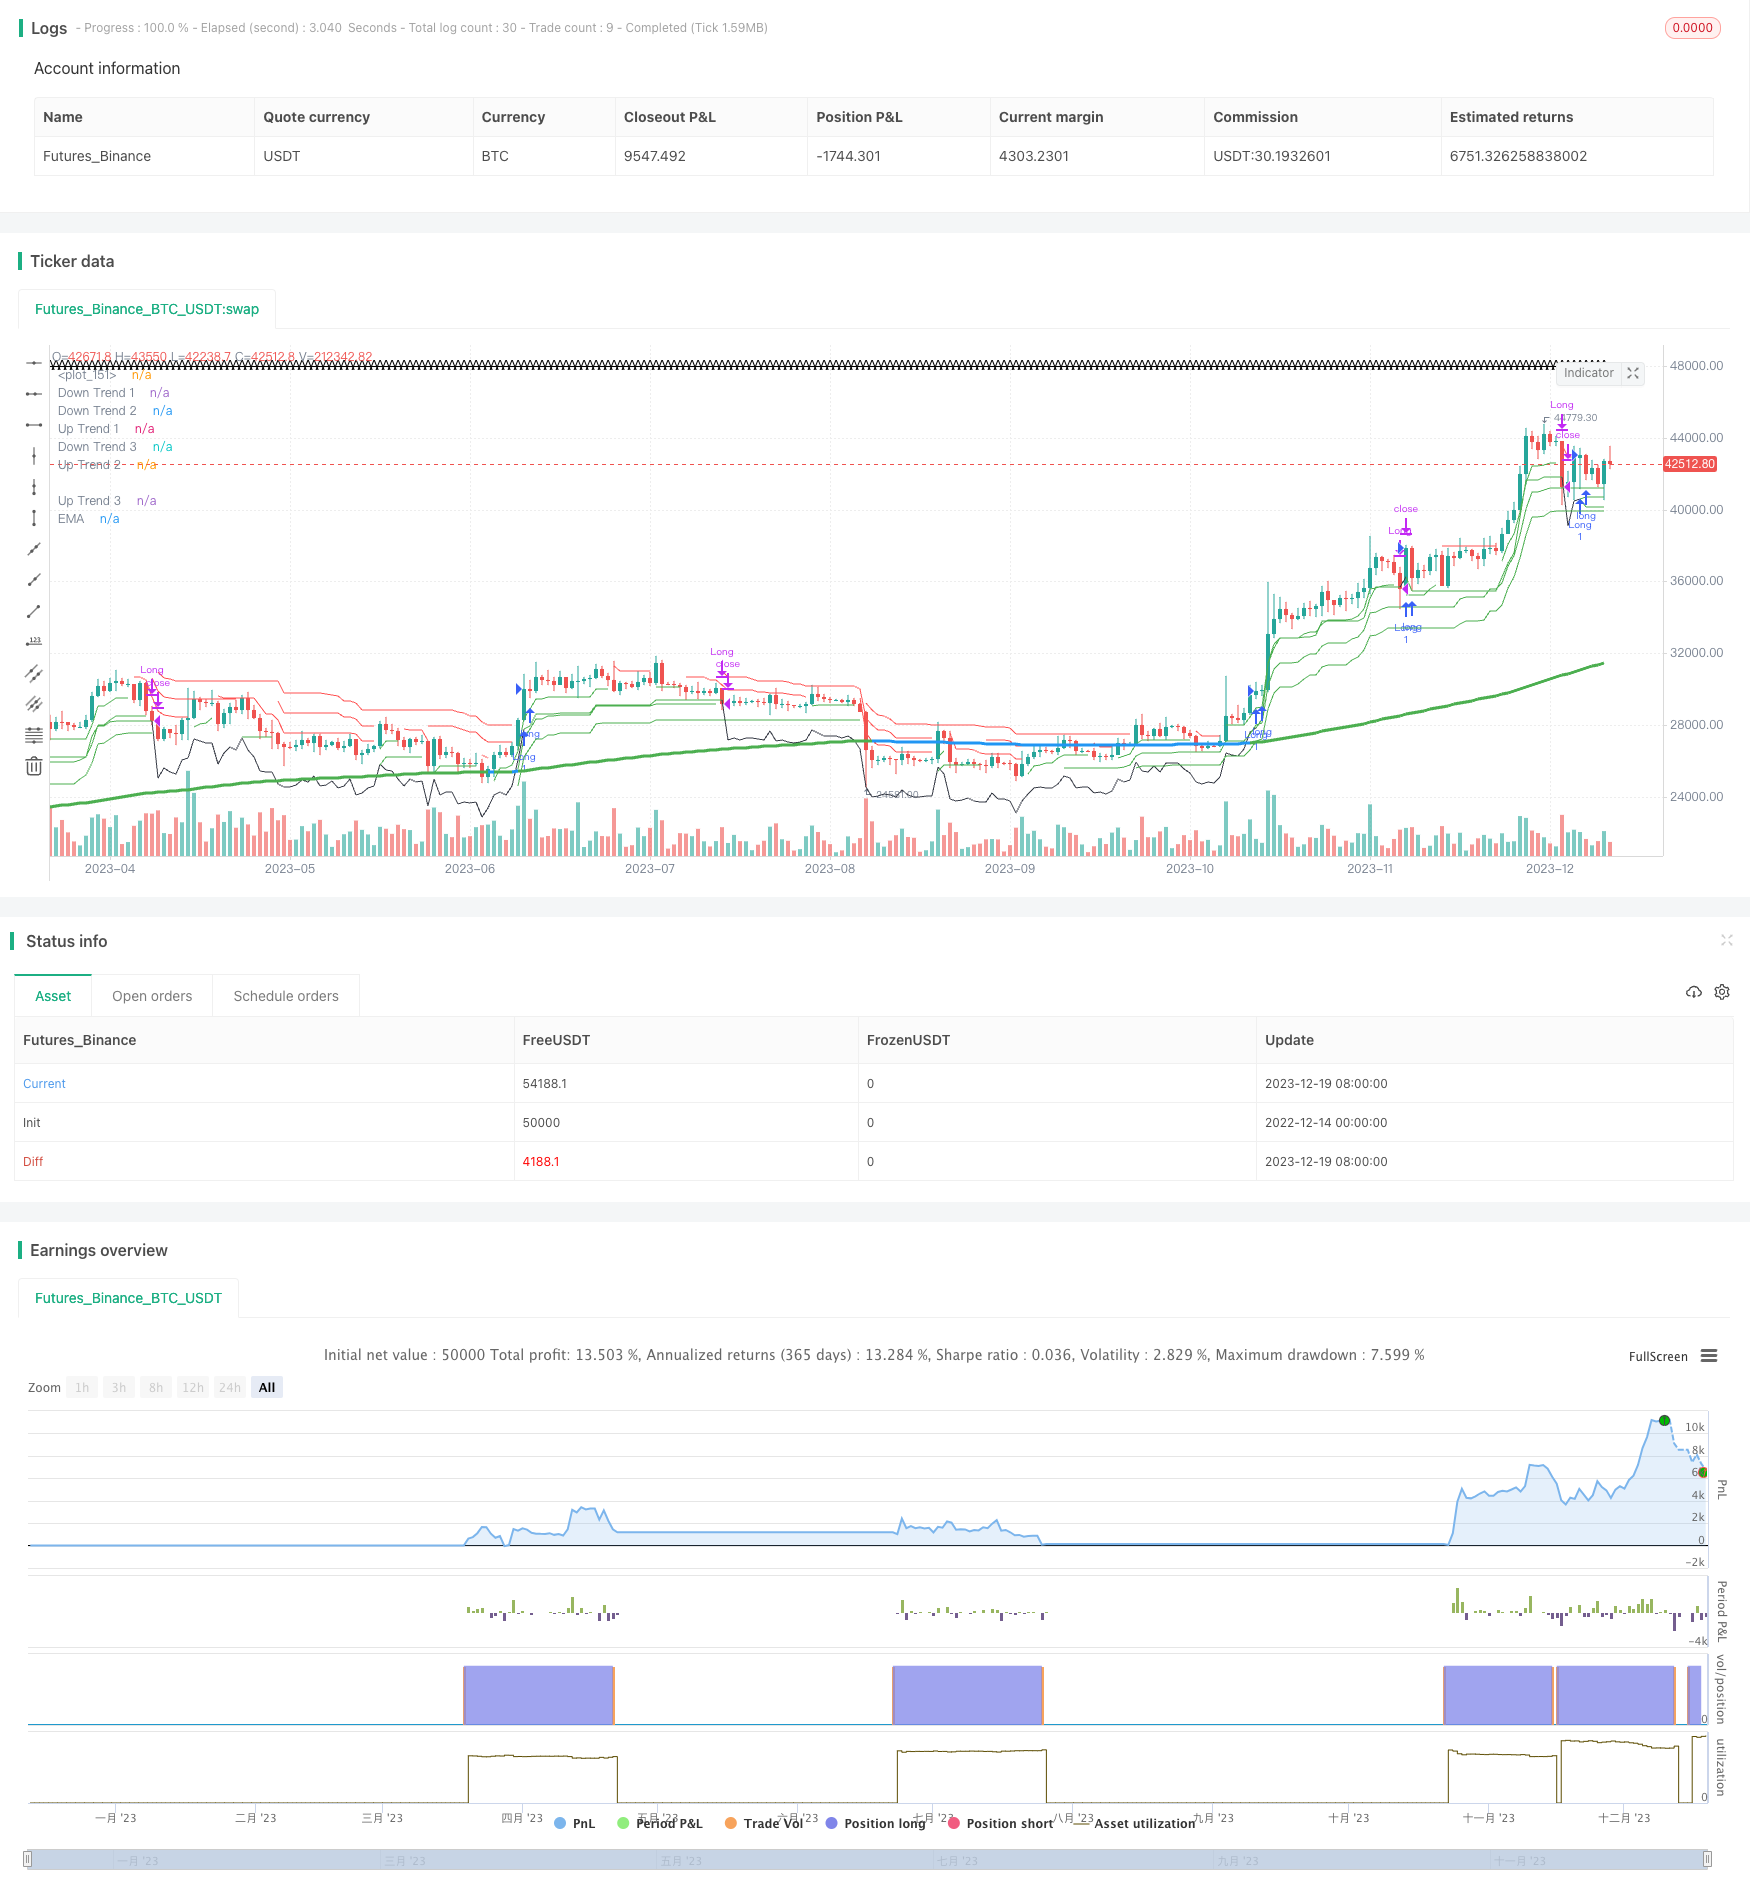
Es gibt drei Übertrend-Gleichlinien: supertrend1, supertrend2 und supertrend3. Die Farben sind grün für den Aufwärtstrend und rot für den Abwärtstrend.
Ein EMA mit einem schlanken Moving Average ematrend definiert den Trend, wenn die drei Übertrend-Durchschnittslinien alle über dem EMA liegen.
Wenn mindestens zwei Übertrend-Gewinnlinien gleichzeitig auf der großen Scheibe mehrere Köpfe zeigen, werden mehrere Köpfe (grün) angezeigt, d. h. wenn die Richtungswerte kleiner als 0 sind, wird dies als Mehrkopfsignal beurteilt. Wenn mindestens zwei Übertrend-Gewinnlinien gleichzeitig auf der großen Scheibe leer sind, werden leere Köpfe (rot) angezeigt, d. h. wenn die Richtungswerte größer als 0 sind, wird dies als leeres Signal beurteilt.
Die Positionen werden dann bei einem Signal über/unter gehalten.
Die Stop-Loss-Bedingung ist festgelegt. Der feste Stop-Loss ist als Risiko-Rendite, also als Verlust-Rendite, eingestellt. Der mobile Stop-Loss ist als Abnahme eines ATR eingestellt.
Wenn die Stop-Loss- oder Stop-Stop-Bedingungen ausgelöst werden, wird die Position platziert.
Analyse der Stärken
Diese Strategie hat folgende Vorteile:
Die EMA wird in Kombination mit einer dreifachen Übertrend-Gewinnlinie beurteilt, um Trendsignale effektiv zu erkennen.
Die Regeln für die Bestimmung von Mehrraumbedingungen sind klar, leicht verständlich und umsetzbar.
Einrichtung von mobilen Stop-Loss- und Fix-Stop-Systemen zur effektiven Risikokontrolle.
Die Hyperparameter können je nach Bedarf angepasst und die Strategie optimiert werden.
Risikoanalyse
Die Strategie birgt einige Risiken:
Die falsche Einstellung der Hyperparameter kann dazu führen, dass gute Handelschancen verpasst werden. Es können verschiedene ATR-Zyklen, ATR-Multiplikate und EMA-Zyklen-Parameter getestet werden.
Die Wahrscheinlichkeit, dass ein Durchbruch fehlschlägt, kann durch Anpassung der Hyperparameter verringert werden.
Eine zu lockere Stop-Loss- oder Stop-Stop-Einstellung erhöht die Verlustwahrscheinlichkeit. Der Stop-Loss-Bereich sollte entsprechend eingegrenzt werden.
Die Rückmeldung kann zu einer Über-Anpassung führen.
Optimierungsrichtung
Diese Strategie kann in folgenden Bereichen optimiert werden:
Die optimale Kombination von Hyperparametern wird getestet. Es können verschiedene ATR-Perioden, ATR-Multiplikatoren und EMA-Durchschnittsperioden kombiniert werden, um die optimale Kombination zu finden.
Erweiterung der Handelsarten. Verschiedene Arten wie Aktien, digitale Währungen und andere können hinzugefügt werden, um die Effektivität der Strategie zu überprüfen.
In Kombination mit anderen Indikatoren filtern Sie die Signale. Sie können beispielsweise Indikatoren wie RSI, MACD und andere hinzufügen, um ein falsches Trendsignal zu vermeiden.
Optimierung der Stop-Loss-Stopp-Mechanismen. Sie können die Stop-Loss-Verfolgung testen oder die Stop-Loss-Methode basierend auf ATR/Volatilitätsänderungen.
Zusammenfassen
Die Dreifach-Übertrend-Gleichgewichtslinie-Break-Strategie ist insgesamt eine relativ einfache und praktische Trendverfolgungsstrategie. Sie kombiniert mehrere Übertrend-Gleichgewichtslinien und Trendurteile EMAs zur Erkundung von Chancen und zur effektiven Risikokontrolle. Durch die Optimierung von Parametern und der Optimierung von Regeln können bessere Ergebnisse erzielt werden.
/*backtest
start: 2022-12-14 00:00:00
end: 2023-12-20 00:00:00
period: 1d
basePeriod: 1h
exchanges: [{"eid":"Futures_Binance","currency":"BTC_USDT"}]
*/

// @version=5
// author=theasgard and moonshot-indicator (ms)
// year 2021
//
// This is a well knowen strategy by using 3 different Supertrends and a trend-defining EMA,
// feel free to play around with the settings, a backtest on 8h ETHUSDT pair brought some good results using
// the 233EMA and investing 75% of a 10k start capital
//
// the idea is to have at least 2 supertrnds going green above the trend-EMA to go long and exit by turning
// 2 supertrends red (idea: 1 supertrend in red could initialize a take profit)
// shorts work vice versa
// The EMA shows in green for uptrends and in red for downtrends, if it is blue no Signal will be taken because
// the 3 supertrends are not all above or below the trendline(EMA)
//
// Update 1:
// Fixed a minor input error
// Added ATR stoploss, and commented out the percentage stop loss
// Added time window to backtest
// Added exit on risk/revard is met
// This version is only buy...wait for next update adding shorts

strategy("ms hypertrender", overlay=true)

// set up 3 supertrendlines and colour the direction up/down
atrPeriod1 = input(10, "ATR Length 1")
factor1 = input.float(1.0, "ATR Factor 1", step = 0.01)
[supertrend1, direction1] = ta.supertrend(factor1, atrPeriod1)
upTrend1 = plot(direction1 < 0 ? supertrend1 : na, "Up Trend 1", color = color.green, style=plot.style_linebr)
downTrend1 = plot(direction1 < 0? na : supertrend1, "Down Trend 1", color = color.red, style=plot.style_linebr)

atrPeriod2 = input(11, "ATR Length 2")
factor2 = input.float(2.0, "ATR Factor 2", step = 0.01)
[supertrend2, direction2] = ta.supertrend(factor2, atrPeriod2)
upTrend2 = plot(direction2 < 0 ? supertrend2 : na, "Up Trend 2", color = color.green, style=plot.style_linebr)
downTrend2 = plot(direction2 < 0? na : supertrend2, "Down Trend 2", color = color.red, style=plot.style_linebr)

atrPeriod3 = input(12, "ATR Length 3")
factor3 = input.float(3.0, "ATR Factor 3", step = 0.01)
[supertrend3, direction3] = ta.supertrend(factor3, atrPeriod3)
upTrend3 = plot(direction3 < 0 ? supertrend3 : na, "Up Trend 3", color = color.green, style=plot.style_linebr)
downTrend3 = plot(direction3 < 0? na : supertrend3, "Down Trend 3", color = color.red, style=plot.style_linebr)

//set up the trend dividing EMA and color uptrend nutreal downtrend
len = input.int(233, minval=1, title="Trend-EMA Length")
src = input(close, title="Source")
offset = input.int(title="Offset", defval=0, minval=-500, maxval=500)

//general Bull or Bear Trend? Visualized by ema
ematrend = ta.ema(src, len)
generaluptrend = supertrend1 > ematrend and supertrend2 > ematrend and supertrend3 > ematrend
generaldowntrend = supertrend1 < ematrend and supertrend2 < ematrend and supertrend3 < ematrend
emacolor = if generaluptrend
    color.green
else if generaldowntrend
    color.red
else
    color.blue
plot(ematrend, title="EMA", color=emacolor, linewidth=3, offset=offset)

// Bullish? min 2 supertrends green
bullish = (direction1 < 0 and direction2 < 0) or (direction1 < 0 and direction3 < 0) or (direction2 < 0 and direction3 < 0) and generaluptrend
extremebullish = direction1 < 0 and direction2 < 0 and direction3 < 0 and generaluptrend //all 3 green

// Bearish? min 2 supertrends red
bearish = (direction1 > 0 and direction2 > 0) or (direction1 > 0 and direction3 > 0) or (direction2 > 0 and direction3 > 0) and generaldowntrend
extremebearish = direction1 > 0 and direction2 > 0 and direction3 > 0 and generaldowntrend //all 3 red

// Open Long
//plotchar(((bullish and not bullish[1]) or (extremebullish and not extremebullish[1])) and (emacolor==color.green)? close : na, title = 'Start Long', char='▲', color = #80eb34, location = location.belowbar, size = size.small)

// TP 10% Long
TP10long = ((generaluptrend and bullish[1]) or (generaluptrend and extremebullish[1])) and (direction1 > 0 or direction2 > 0 or direction3 > 0)
//plotchar(TP10long and not TP10long[1]? close : na, title = 'TP on Long', char='┼', color = #ffd000, location = location.abovebar, size = size.tiny)

// Exit Long
//plotchar(extremebearish and not extremebearish[1] or bearish and not bearish[1]? close : na, title = 'Close all Longs', char='Ꭓ', color = #ff0037, location = location.abovebar, size = size.tiny)
stopsupertrendup = if supertrend1 < supertrend2 and supertrend1 < supertrend3
    (supertrend1)
else if supertrend2 < supertrend1 and supertrend2 < supertrend3
    (supertrend2)
else if supertrend3 < supertrend1 and supertrend3 < supertrend2
    (supertrend3)
lowestLows = ta.lowest(low, 1)
// Open Short
//plotchar(((bearish and not bearish[1]) or (extremebearish and not extremebearish[1])) and (emacolor==color.red)? close : na, title = 'Start Short', char='▼', color = #0547e3, location = location.abovebar, size = size.small)

// TP 10% Short
TP10short = ((generaldowntrend and bearish[1]) or (generaldowntrend and extremebearish[1])) and (direction1 < 0 or direction2 < 0 or direction3 < 0)
//plotchar(TP10short and not TP10short[1]? close : na, title = 'TP on Short', char='┼', color = #ffd000, location = location.belowbar, size = size.tiny)

// Exit Short
//plotchar(extremebullish and not extremebullish[1] or bullish and not bullish[1]? close : na, title = 'Close all Shorts', char='Ꭓ', color = #ff0037, location = location.belowbar, size = size.tiny)
stopsupertrenddown = if supertrend1 > supertrend2 and supertrend1 > supertrend3
    (supertrend1)
else if supertrend2 > supertrend1 and supertrend2 > supertrend3
    (supertrend2)
else if supertrend3 > supertrend1 and supertrend3 > supertrend2
    (supertrend3)
highestHighs = ta.highest(high,1)
// Set stop loss level with input options (optional)
//longLossPerc = input.float(title="Long Stop Loss (%)",
//     minval=0.0, step=0.1, defval=1) * 0.01

//shortLossPerc = input.float(title="Short Stop Loss (%)",
//     minval=0.0, step=0.1, defval=1) * 0.01

// Determine stop loss price
//longStopPrice  = strategy.position_avg_price * (1 - longLossPerc)
//shortStopPrice = strategy.position_avg_price * (1 + shortLossPerc)

openlong = (extremebullish and not extremebullish[1]) and (emacolor==color.green)//(((bullish and not bullish[1]) or
openshort = (extremebearish and not extremebearish[1]) and (emacolor==color.red)//(((bearish and not bearish[1]) or
exitlong = lowestLows<(stopsupertrendup - ((stopsupertrendup / 100) * 0.1)) //(extremebearish and not extremebearish[1] or bearish and not bearish[1]) or TP10long or
exitshort = highestHighs>(stopsupertrenddown - ((stopsupertrenddown / 100) * 0.1)) //(extremebullish and not extremebullish[1] or bullish and not bullish[1]) or TP10short
//strategy.entry("buy", strategy.long, when=openlong)
//strategy.entry("sell", strategy.short, when=openshort)

//strategy.close("buy", when=exitlong)
//strategy.close("sell", when=exitshort)

// Submit exit orders based on calculated stop loss price
//if (strategy.position_size > 0)
//    strategy.exit(id="Long Stop", stop=longStopPrice)

//if (strategy.position_size < 0)
//    strategy.exit(id="Short Stop", stop=shortStopPrice)

backtest_timeframe_start = input(defval = timestamp("01 Apr 2016 13:30 +0000"), title = "Backtest Start Time")
USE_ENDTIME = input(false,title="Define the ending period for backtests (If false, will test up to most recent candle)")
backtest_timeframe_end = input(defval = timestamp("19 Mar 2021 19:30 +0000"), title = "Backtest End Time")
TARGET_PROFIT_MODE = input(false,title="Exit when Risk:Reward met")
REWARD_RATIO = input(3,title="Risk:[Reward] (i.e. 3) for exit")
// Trailing stop loss {
TSL_ON = input(true,title="Use trailing stop loss")
var entry_price = float(0)
ATR_multi_len = 26
ATR_multi = input(2, "ATR multiplier for stop loss")
ATR_buffer = ta.atr(ATR_multi_len) * ATR_multi
plotchar(ATR_buffer, "ATR Buffer", "A", location = location.top)
risk_reward_buffer = (ta.atr(ATR_multi_len) * ATR_multi) * REWARD_RATIO
take_profit_long = low > entry_price + risk_reward_buffer
take_profit_short = low < entry_price - risk_reward_buffer
var trailing_SL_buffer = float(0)
var stop_loss_price = float(0)
stop_loss_price := math.max(stop_loss_price, close - trailing_SL_buffer)
// plot TSL line
trail_profit_line_color = color.green
if strategy.position_size == 0  or not TSL_ON
    trail_profit_line_color := color.black
    stop_loss_price := close - trailing_SL_buffer
plot(stop_loss_price,color=trail_profit_line_color)
// }

if true
    buy_condition = openlong
    exit_condition = exitlong
    //ENTRY:
    if buy_condition
        if strategy.position_size == 0
            entry_price := close
            trailing_SL_buffer := ATR_buffer
            stop_loss_price := close - ATR_buffer

        msg = "entry"
        if strategy.position_size > 0
            msg := "pyramiding"
        strategy.entry("Long",strategy.long, comment=msg)

    //EXIT:
    // Case (A) hits trailing stop
    if TSL_ON and strategy.position_size > 0 and close <= stop_loss_price
        if close > entry_price
            strategy.close("Long", comment="take profit [trailing]")
        else if close <= entry_price
            strategy.close("Long", comment="stop loss")
    // Case (B) take targeted profit relative to risk
    if strategy.position_size > 0 and TARGET_PROFIT_MODE
        if take_profit_long
            strategy.close("Long", comment="take profits [risk:reward]")
    // Case (C)
    if strategy.position_size > 0 and exit_condition
        if take_profit_long
            strategy.close("Long", comment="exit[rsi]")