Bohr-Band-ATR-Trailing-Stop-Loss-Strategie
Überblick
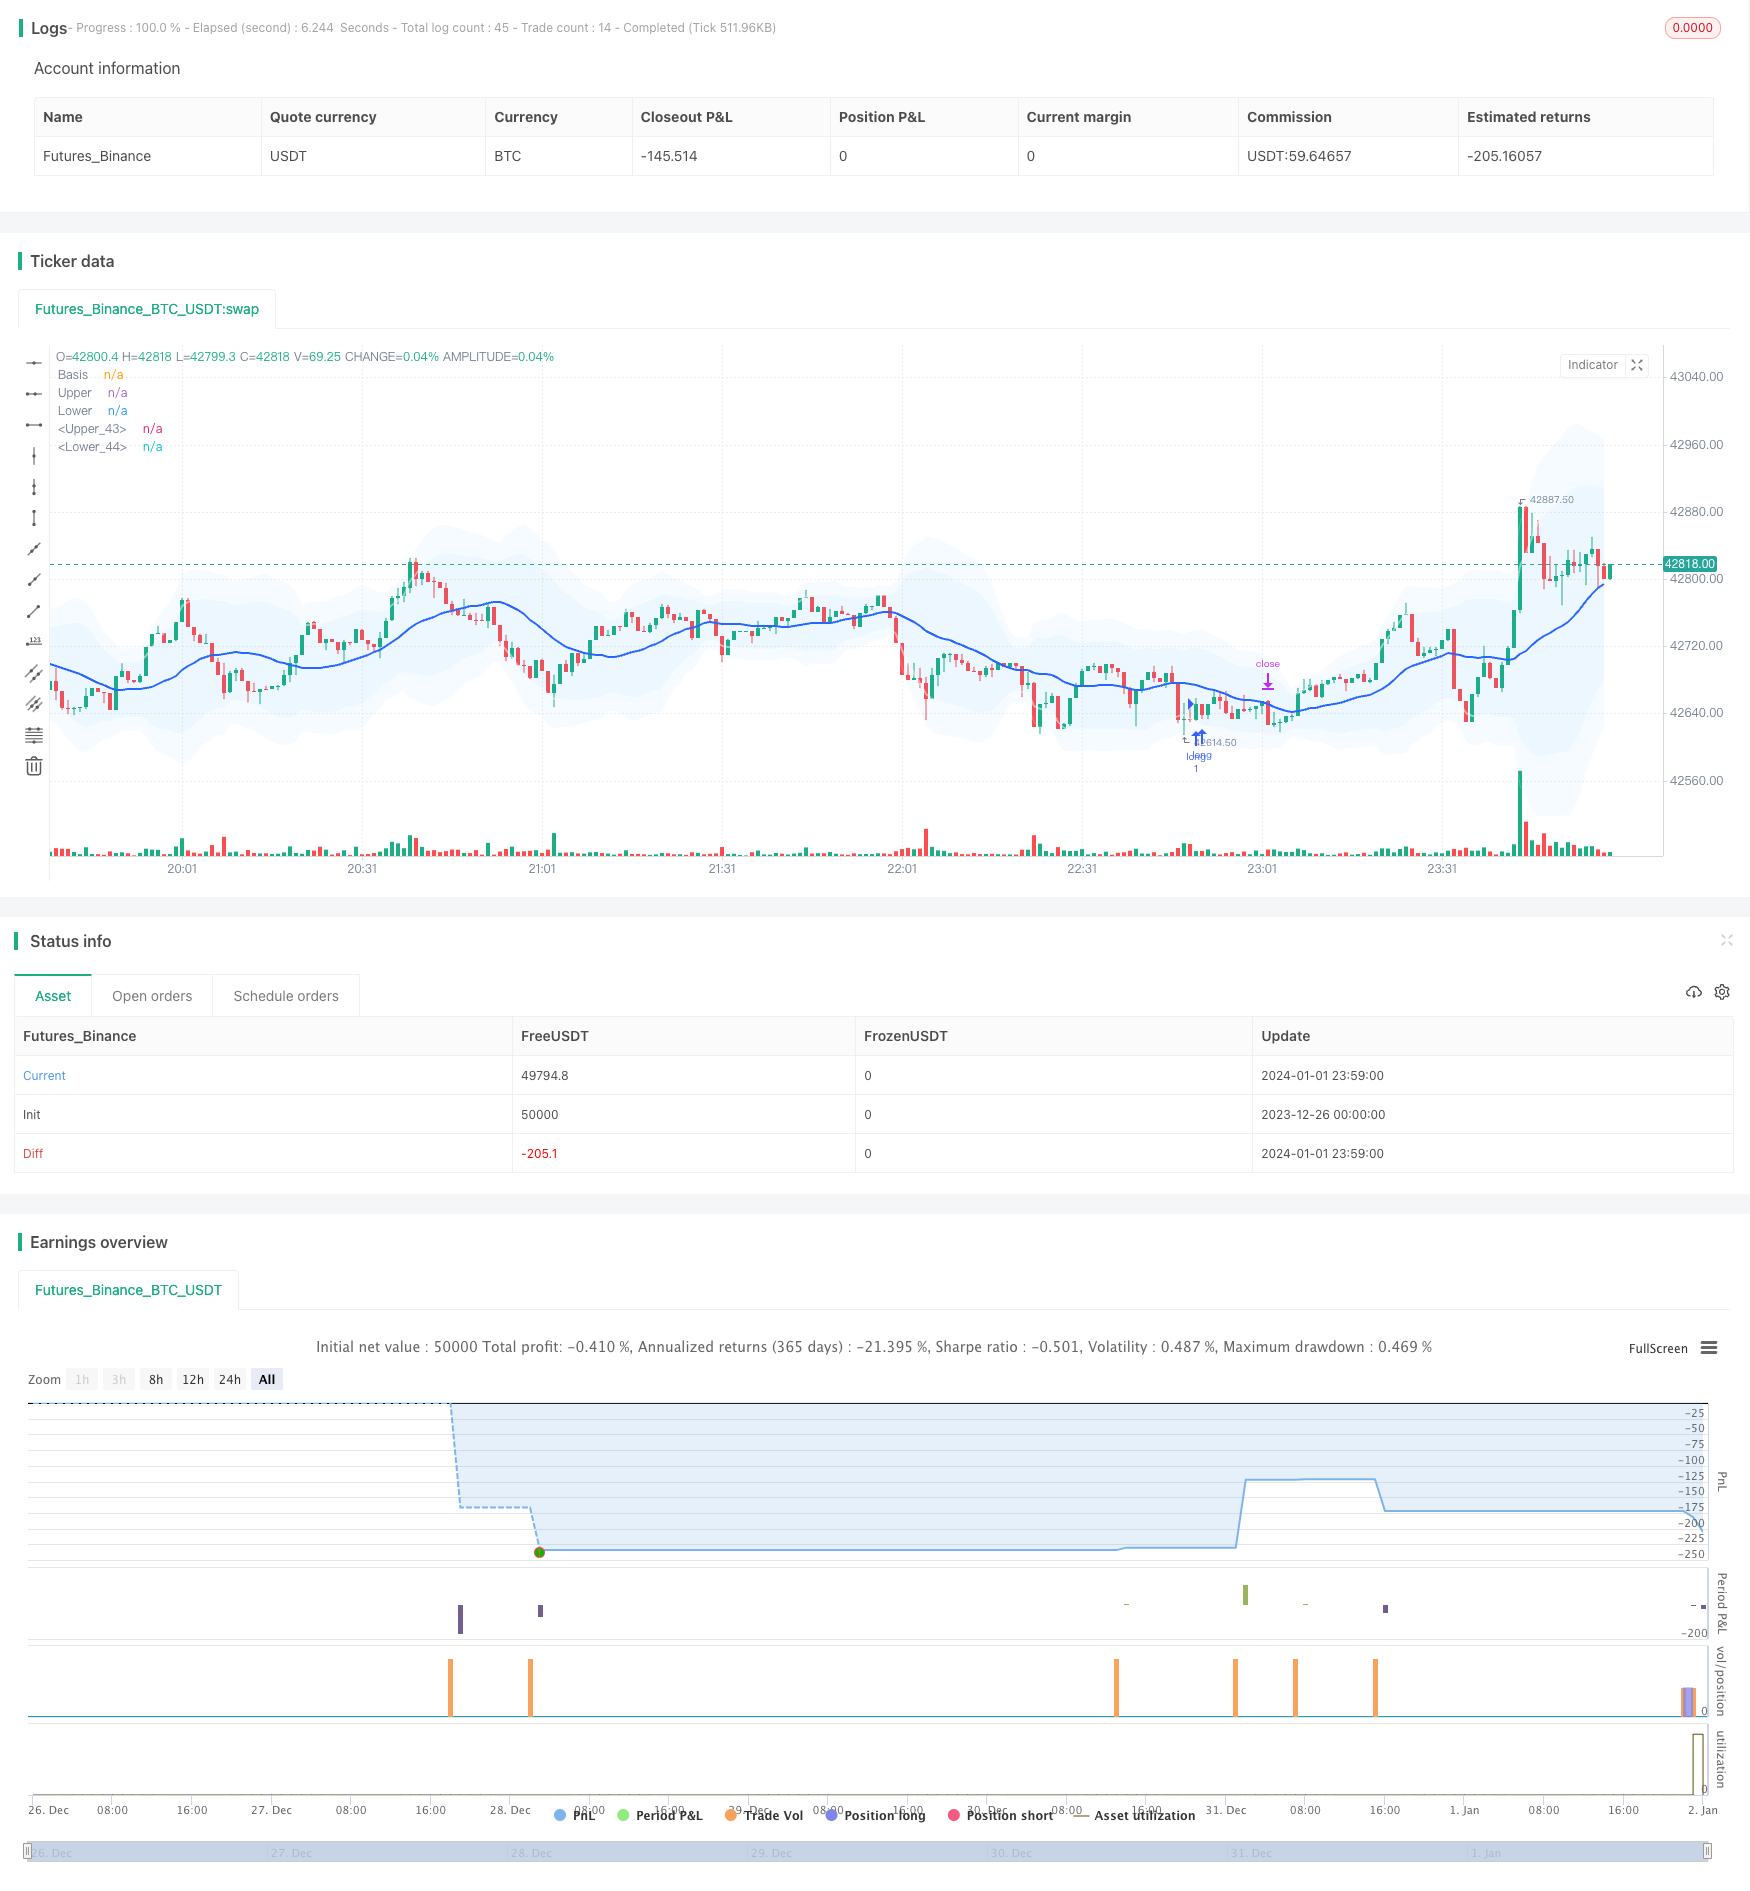
Diese Strategie kombiniert die Verwendung von Boll-Band-Indikatoren und der mittleren realen Breite (ATR), um eine Breakout-Trading-Strategie zu bilden, die eine nachfolgende Stop-Loss-Funktion hat. Die Handelssignale werden ausgesendet, wenn der Preis über die Boll-Band mit einer bestimmten Standardabweichung auf- oder abgleitet. Gleichzeitig werden die Stop-Loss- und Stopp-Länge mit dem ATR-Indikator berechnet, um die Verlustquote zu kontrollieren.
Strategieprinzip
Der erste Schritt ist die Berechnung der mittleren, oberen und unteren Bahnlinien. Die mittlere Bahnlinie ist der einfache Moving Average (SMA) des Preises, die oberen und unteren Bahnlinien sind die Integer der Preisdifferenz. Wenn der Preis von der unteren Bahnlinie nach oben bricht, machen Sie mehr; wenn er von der oberen Bahnlinie nach unten bricht, machen Sie nichts.
Der zweite Schritt ist die Berechnung des ATR-Wertes. Der ATR-Wert spiegelt die durchschnittliche Schwankungsbreite des Preises wider. Der Long-Stop-Loss und der Short-Stop-Loss werden nach den ATR-Werten festgelegt.
Schritt drei: Verwenden Sie einen Zeitfilter und handeln Sie nur in bestimmten Zeiträumen, um starke Schwankungen bei wichtigen Nachrichten zu vermeiden.
Schritt 4: Trailing-Stop-Mechanismus. Der Stop-Loss wird in Echtzeit entsprechend der aktuellen ATR-Position angepasst, um mehr Gewinne zu erzielen.
Analyse der Stärken
Die Bollinger Bands spiegeln die Preiszentralen selbst wider und sind effektiver als ein einfacher Moving Average.
ATR-Stopp-Verluste ermöglichen eine kontrollierte Verlustquote für jede Einnahme und wirksame Risikokontrolle;
Der Trailing Stop kann sich automatisch an Marktbewegungen anpassen, um mehr Gewinne zu erzielen.
Eine vielfältige Strategie mit individuell anpassbaren Portfolios.
Risikoanalyse
In den letzten Jahren hat sich die Entwicklung in den US-amerikanischen Märkten weiter verbessert.
Der Vormarsch durch den Bol-Band könnte sich umkehren und scheitern.
Es ist wichtig zu beachten, dass es gefährlich ist, nachts und in Zeiten wichtiger Nachrichten zu handeln.
Gegenmaßnahmen:
- Die Einhaltung der Grundsätze des Risikomanagements und die Kontrolle von Einzelschäden;
- Das ist eine sehr wichtige Aufgabe.
- Vermeiden Sie Zeitfilter, wenn die Gefahr größer ist.
Optimierungsrichtung
- Optimierte Konfigurationen für verschiedene Parameterkombinationen testen
- Hinzufügen von Wärmeindikatoren wie OBV
- Hinzufügen von Optimierungen für Machine Learning-Module
Zusammenfassen
Die Strategie kombiniert die Verwendung von Boll-Band-Indikatoren, um die Trendmitte und die Breakout-Richtung zu bestimmen. Die ATR-Indikatoren berechnen die Stop-Loss-Garantie-Gewinn-Loss-Ratio und die Trailing-Stop-Loss-Lock-Profit. Die Strategie ist hochgradig anpassbar, risikokontrollierbar und eignet sich für den Short-Line-Intraday-Handel.
/*backtest
start: 2023-12-26 00:00:00
end: 2024-01-02 00:00:00
period: 1m
basePeriod: 1m
exchanges: [{"eid":"Futures_Binance","currency":"BTC_USDT"}]
*/

// This source code is subject to the terms of the Mozilla Public License 2.0 at https://mozilla.org/MPL/2.0/
// © sadeq_haddadi

//@version=5

strategy('Bollinger Bands + ATR / trail- V2', overlay=true ) // Interactive Brokers rate)


//date and time
startDate   = input(title="Start Date", defval=timestamp("01 Aug 2023 00:00 +0000"), tooltip="Date & time to begin analysis",group = 'Time Filter')
endDate     = input(title="End Date", defval=timestamp("1 Jan 2099 00:00 +0000"), tooltip="Date & time to stop analysis")
timeSession = input(title="Time Session To Analyze", defval="0300-1700", tooltip="Time session to analyze")
inSession(sess) => true

// indicators

length = input.int(20, minval=1,group = 'Bollinger Band')
maType = input.string("SMA", "Basis MA Type", options = ["SMA", "EMA", "SMMA (RMA)", "WMA", "VWMA"])
src = input(close, title="Source")
mult1 = input.float(2.0, minval=0.001, maxval=50, title="StdDev1")
mult2 = input.float(3.0, minval=0.001, maxval=50, title="StdDev2")

ma(source, length, _type) =>
    switch _type
        "SMA" => ta.sma(source, length)
        "EMA" => ta.ema(source, length)
        "SMMA (RMA)" => ta.rma(source, length)
        "WMA" => ta.wma(source, length)
        "VWMA" => ta.vwma(source, length)

basis = ma(src, length, maType)
dev1 = mult1 * ta.stdev(src, length)
dev2 = mult2 * ta.stdev(src, length)
upper1 = basis + dev1
lower1 = basis - dev1
upper2 = basis + dev2
lower2 = basis - dev2
offset = input.int(0, "Offset", minval = -500, maxval = 500)
plot(basis, "Basis", color=#2962FF, offset = offset,linewidth=2)
p1 = plot(upper1, "Upper", color=color.new(color.white,50), offset = offset,linewidth=2)
p2 = plot(lower1, "Lower", color=color.new(color.white,50), offset = offset,linewidth=2)
p3 = plot(upper2, "Upper", color=color.new(color.white,80), offset = offset,linewidth=1)
p4 = plot(lower2, "Lower", color=color.new(color.white,80), offset = offset,linewidth=1)

fill(p1, p2, title = "Background", color=color.rgb(33, 150, 243, 95))
fill(p3, p4, title = "Background", color=color.rgb(33, 150, 243, 95))

show_crosses = input(false, "Show Cross the Bands?")

plotshape(show_crosses and ta.crossover(close, upper2)  ? src : na, "S", style = shape.triangledown, location =location.abovebar, color = color.yellow, size = size.tiny)
plotshape(show_crosses and ta.crossunder(low, lower2) ? src : na ,"L", style = shape.triangleup, location =  location.belowbar, color = color.purple, size = size.tiny)

second_entry = input(true, "Show second deviation entry point?")

//atr

length_ATR = input.int(title="Length", defval=5, minval=1,group = 'ATR')
smoothing = input.string(title="Smoothing", defval="RMA", options=["RMA", "SMA", "EMA", "WMA"])
m = input.float(1, "Multiplier")
src1 = input(high)
src2 = input(low)
pline = input.bool(title = 'show ATR lines ?', defval=false)


ma_function(source, length_ATR) =>
	if smoothing == "RMA"
		ta.rma(source, length_ATR)
	else
		if smoothing == "SMA"
			ta.sma(source, length_ATR)
		else
			if smoothing == "EMA"
				ta.ema(source, length_ATR)
			else
				ta.wma(source, length_ATR)

a = ma_function(ta.tr(true), length_ATR) * m
x = ma_function(ta.tr(true), length_ATR) * m + src1
x2 = src2 - ma_function(ta.tr(true), length_ATR) * m

PP1 = plot(pline ? x :na , title = "ATR Short Stop Loss", color= color.new(color.red,20) )
PP2 = plot(pline ? x2:na , title = "ATR Long Stop Loss",  color=color.new(color.green,20) )

Tp_to_Sl = input.float(1.5, "TP/SL")
candle_size =  input.float(10, "candle/pip")
distance_source =  input.float(1.5, "distance to midline/pip")
//strategy

buyCondition = low[2] < lower1 and  ta.crossover(close[1], lower1)  and strategy.position_size == 0 and (close[1] - open[1]) < candle_size * 0.0001 and close > open and ( basis - close) > distance_source * 0.0001

sellCondition = high[2] > upper1 and ta.crossunder(close[1], upper1)  and strategy.position_size == 0 and (open[1] - close[1]) < candle_size * 0.0001 and close < open  and (close - basis) > distance_source * 0.0001
//
buyCondition2 = low[2] < lower2 and  ta.crossover(close[1], lower2)  and (close[1] - open[1]) < candle_size * 0.0001 and close > open and ( basis - close) > distance_source * 0.0001
sellCondition2 = high[2] > upper2 and ta.crossunder(close[1], upper2)   and (open[1] - close[1]) < candle_size * 0.0001 and close < open  and (close - basis) > distance_source * 0.0001

plotshape(second_entry and  sellCondition2 ? src : na, "S", style = shape.triangledown, location =location.abovebar, color = color.rgb(241, 153, 177), size = size.tiny)
plotshape(second_entry and buyCondition2 ? src : na ,"L", style = shape.triangleup, location =  location.belowbar, color = color.rgb(177, 230, 168), size = size.tiny)
//
since_buy  =ta.barssince(buyCondition)
since_sell =ta.barssince(sellCondition)
entry_price = ta.valuewhen(buyCondition or sellCondition, src, 0)

sl_long = ta.valuewhen(buyCondition, x2[1], 0)
sl_short = ta.valuewhen(sellCondition, x[1], 0)
buyprofit = entry_price + (Tp_to_Sl*( entry_price - sl_long))
sellprofit= entry_price + (Tp_to_Sl*( entry_price - sl_short))

//alert_massage = "new strategy position is {{strategy.position_size}}"
//prof = ta.crossover(high,upper1)
//buyexit=ta.valuewhen(prof,upper1,0)

if buyCondition and inSession(timeSession)

    strategy.entry( id = "long", direction = strategy.long , alert_message='Open Long Position' )

if sellCondition and inSession(timeSession)

    strategy.entry(id= "short", direction = strategy.short, alert_message='Open Short Position')

//trail-stop loss
use_trailing = input.bool(title = 'use trailing stop loss?', defval=true)
pricestop_long=0.00
pricestop_short=100000.00
if (strategy.position_size > 0)

    if use_trailing == false
        pricestop_long := sl_long
    else
        pricestop_long := math.max (x2, pricestop_long[1]) //trail - long

if (strategy.position_size < 0)

    if use_trailing == false
        pricestop_short := sl_short
    else
        pricestop_short := math.min (x, pricestop_short[1])  // trail - short

if strategy.position_size > 0

    strategy.exit(id = 'close', limit =  buyprofit , stop = pricestop_long  )

if strategy.position_size < 0

    strategy.exit(id = 'close', limit = sellprofit  , stop = pricestop_short  )

alertcondition(buyCondition or sellCondition, 'Enter_position')