Strategie der doppelten Volatilitätsband-Kürzung
Überblick
Die Doppelbandschneidstrategie ist eine Kurzlinien-Handelsstrategie, bei der die Bandschneidindikatoren genutzt werden. Sie nutzt gleichzeitig zwei unterschiedliche Parameter-Einstellungen für die Bandschneid, schnell und langsam, um nach Handelsmöglichkeiten zu suchen, wenn die Bandschneid nach oben oder nach unten bricht.
Strategieprinzip
Die Strategie verwendet gleichzeitig schnelle und langsame Bandbreiten mit einer Standarddifferenz von 1 mit einer Länge von 20 und 50. Wenn der Schlusskurs die schnelle Bandbreite überschreitet, tritt er mit diesem Schlusskurs in einen Mehrheitshandel ein. Wenn der Schlusskurs die schnelle Bandbreite überschreitet, tritt er mit diesem Schlusskurs in einen Leerhandel ein.
Nach dem Eintritt in die Position wartet die Strategie darauf, dass der Preis die langsame Bandbrechung auf oder abwärts durchbricht, um die Richtung des Trends zu bestimmen. Die Strategie wird auch mit dem RSI-Indikator kombiniert, um die Richtung des Trends zu bestimmen. Nur wenn der RSI über 50 liegt, wird ein Kaufsignal für den Überbruch der oberen Bahn berücksichtigt; nur wenn der RSI unter 50 ist, wird ein Verkaufssignal für den Überbruch der unteren Bahn berücksichtigt.
Nach dem Aufbau einer Position wird der entsprechende Mehrkopf- oder Leerkopf-Position ausgeschlossen, wenn der Preis erneut die schnelle Bandbreite auf- oder abgleitet.
Analyse der Stärken
Die Vorteile der Doppelbandbrechungsstrategie bestehen hauptsächlich in der Fähigkeit, kleine Bewegungen zu erfassen. Durch die schnelle Bandbrechungsband, um kleine Preisbruche zu erfassen, kann das Signal der langsamen Bandbrechungsband erneut verifiziert werden, um den Lärm der falschen Brechungen zu filtern und daraus zu profitieren. Die Kombination des RSI-Indikators kann auch verhindern, dass ein Trendwechsel im Schwingungstrend verpasst wird.
Außerdem ist die doppelte Band als Dynamik-Indikator für sich selbst sehr gut geeignet, um zu beurteilen, ob sich der Markt derzeit in einer Phase mit hoher Dynamik befindet, was für eine kurze Handelsstrategie sehr vorteilhaft ist.
Risikoanalyse
Das Hauptrisiko dieser Strategie besteht darin, dass die Handelssignale, die von den doppelten Bands erzeugt werden, möglicherweise zu häufig sind, um den Marktrauschen effektiv zu filtern. Dies führt zu einer Anhäufung von zu vielen falschen Handelsverlusten. Darüber hinaus wird die Bandbreite der Bandbreite in der Phase der niedrigen Geschwindigkeit verringert, wodurch die Handelsmöglichkeiten verringert werden.
Um das Risiko zu verringern, können Sie die Bandbreitenparameter anpassen, langsamere Bandbreiten mit längeren Perioden verwenden oder das Signal manuell bestätigen. Sie können auch mit anderen technischen Indikatoren wie MACD, KDJ usw. kombiniert werden, um die Strategie zu verbessern.
Optimierungsrichtung
Der Optimierungsraum für diese Strategie konzentriert sich hauptsächlich auf die Anpassung der Bandparameter und der RSI-Parameter. Zum Beispiel kann man die Bandparameter für schnelle und langsame Schwankungen in verschiedenen Längezyklen testen, um die beste Kombination zu finden. Oder man kann die RSI-Parameter für verschiedene Längezyklen ausprobieren, um zu sehen, ob die Strategie verbessert werden kann.
Eine andere Optimierungsrichtung ist das Hinzufügen oder Anpassen der Stop-Loss-Logik. Die aktuelle Strategie hat keine Stop-Loss-Einstellung, was das Risiko erhöht, dass die Strategie maximal zurückgezogen wird. Eine angemessene Einstellung von Fixed-Ratio-Stop-Loss oder Tracking-Stop-Loss kann die Risikogewinnsituation erheblich verbessern.
Zusammenfassen
Die Doppelbandschnittstrategie ist eine kurze Handelsstrategie, die auf Marktbewegungen reagiert. Sie kann kleine Preisbewegungen bei hoher Volatilität erfassen und handeln, wenn der Doppelbandindikator ein klares Signal sendet. Die Zuverlässigkeit der Strategie muss jedoch noch weiter überprüft werden. Durch die Hinzufügung von Parameteroptimierung und Stop-Logik wird die Stabilität der Strategie weiter verbessert.
/*backtest
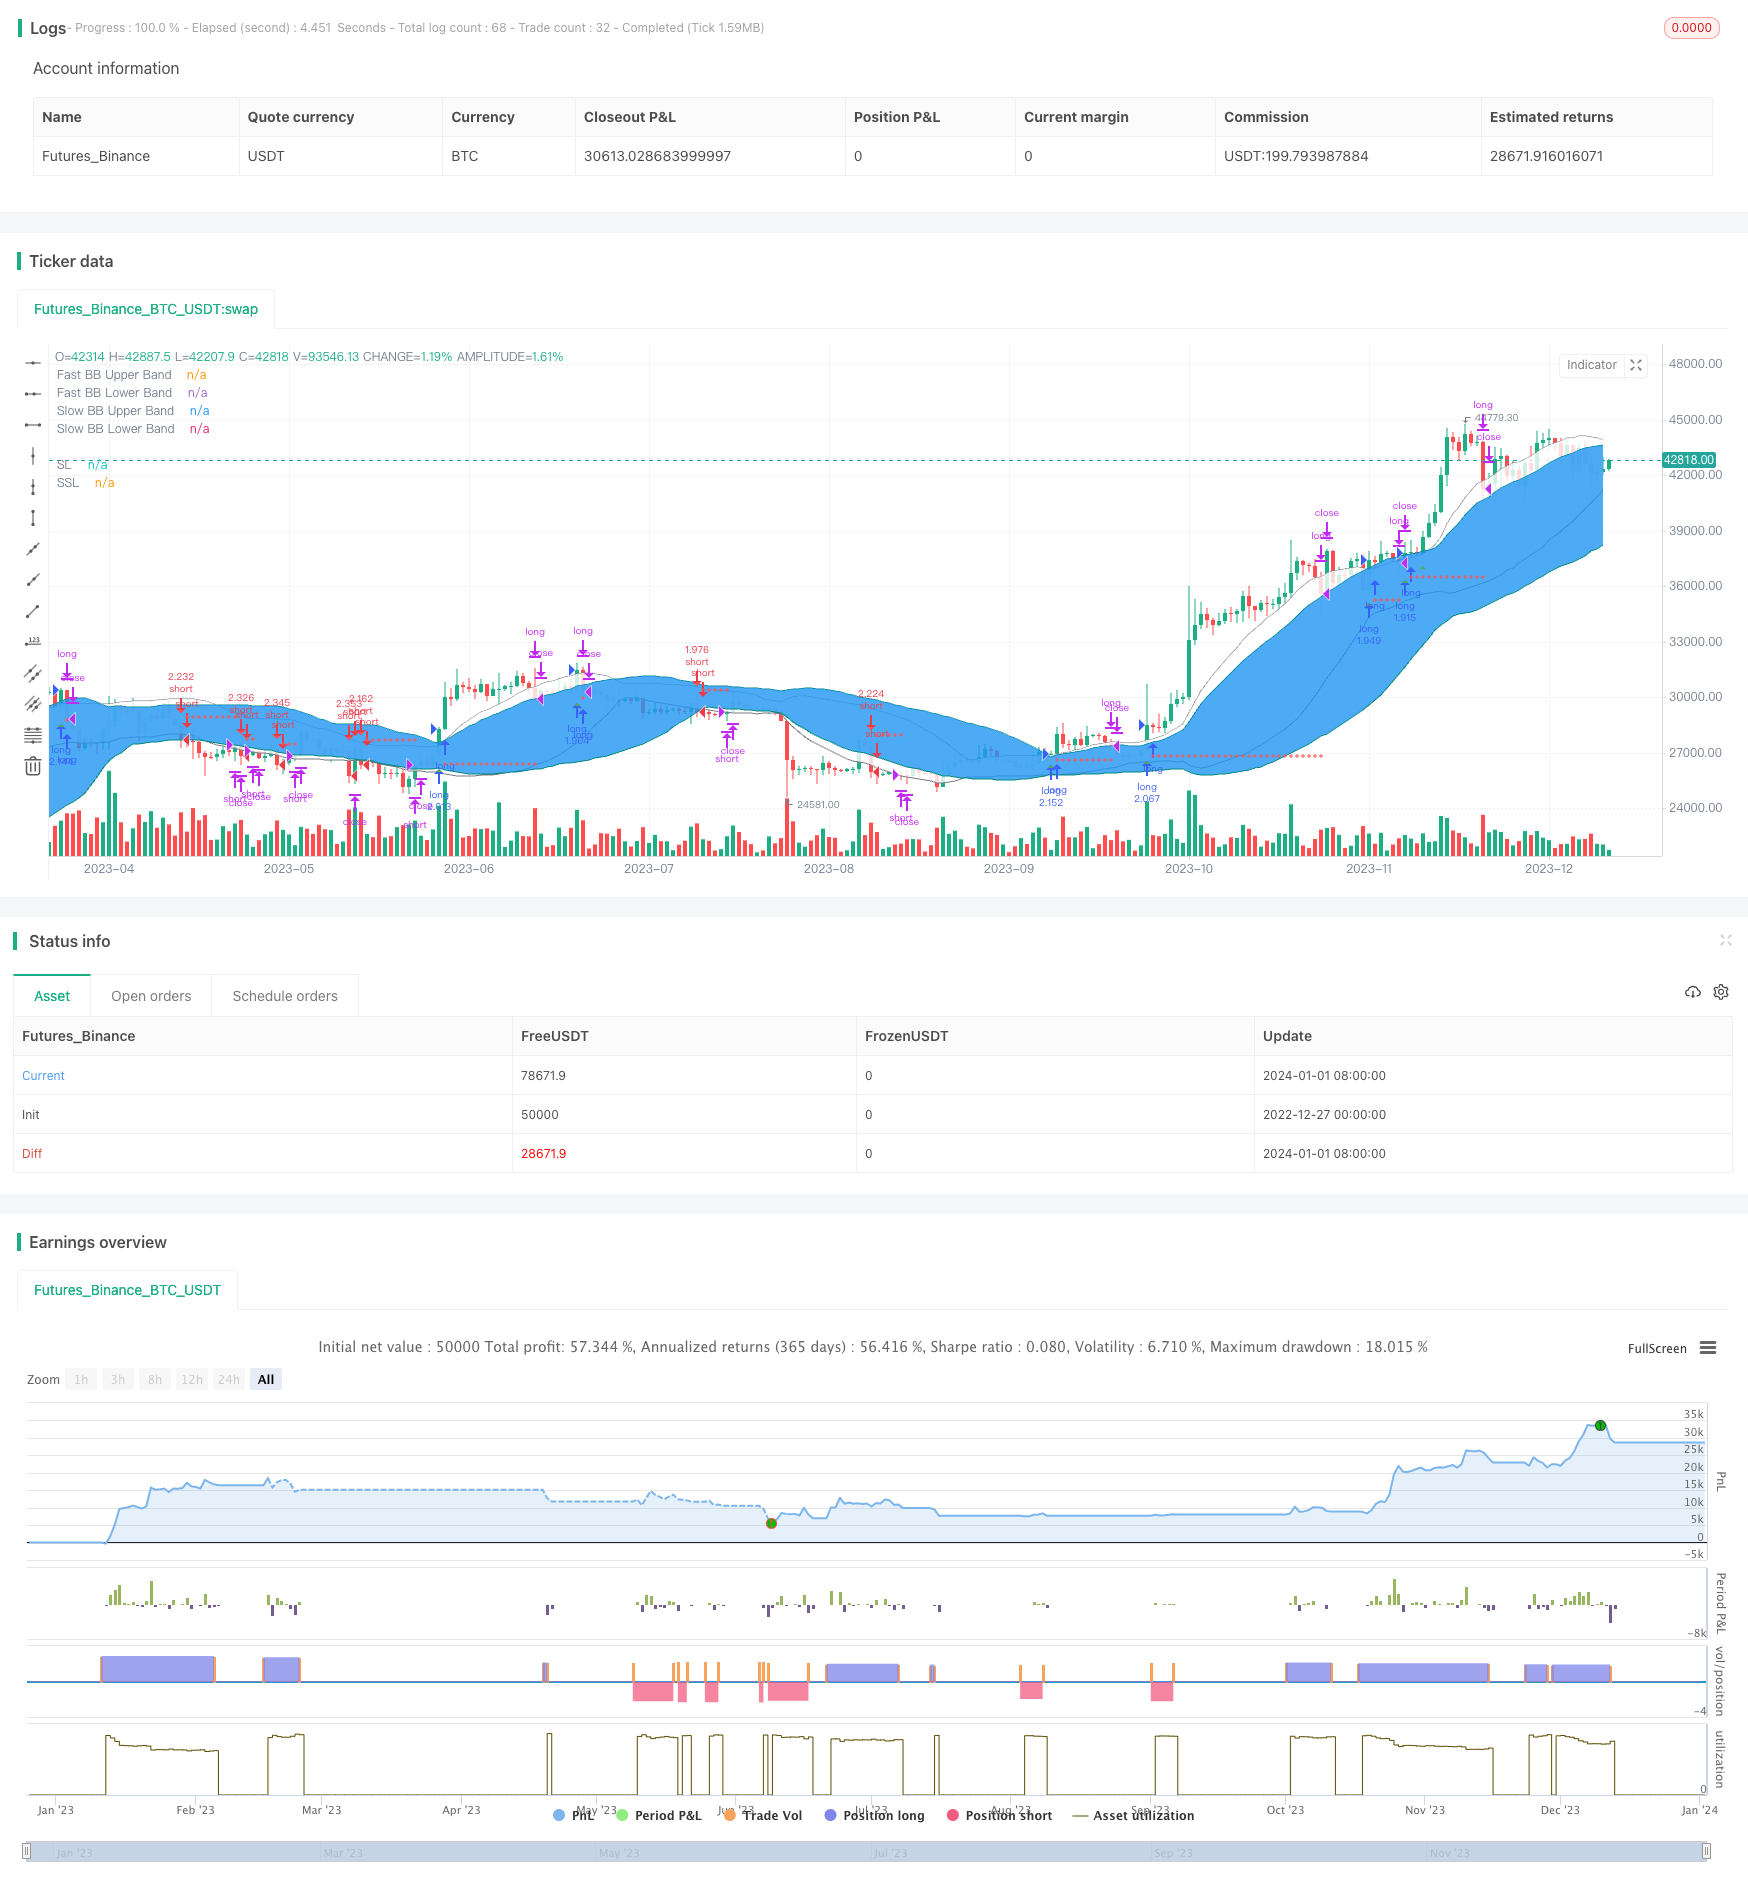
start: 2022-12-27 00:00:00
end: 2024-01-02 00:00:00
period: 1d
basePeriod: 1h
exchanges: [{"eid":"Futures_Binance","currency":"BTC_USDT"}]
*/
// This source code is subject to the terms of the Mozilla Public License 2.0 at https://mozilla.org/MPL/2.0/
// From "Bitcoin Trading Strategies: Algorithmic Trading Strategies For Bitcoin And Cryptocurrency That Work" by David Hanson.
// "Double Bolinger Band Scalping System
// Recommended Timeframe: 1 minute or 5 minute
// Required Indicators:
// - RSI with a length of 14 (default settings)
// - Bolinger band #1 settings: Length = 50, stDev = 1 Hide the basis/middle line (basis line not needed for this strategy)
// Note: This is the slower bolinger band in the directions
// - Bolinger band #2 settings: Length 20, stDev = 1 Hide the basis/middle line (basis line not needed for this strategy)
// Note: This is the faster bolinger band in the directions
// Enter Long/Buy Trade When:
// - RSI is above the level 50
// - A candle closes above the top of the faster bolinger band
// Enter a long when a candle then closes above the top of the slower bolinger band, and price is above the top of both bands
// Place a stop loss under the low of the entry candle Example of a long trade using this strategy
// Exit Long Trade When: A candle closes below the top band of the fast bolinger band
// Enter Short/Sell Trade When:
// - RSI is below the level 50
// - A candle closes below the bottom of the faster bolinger band
// Enter a short when a candle then closes below the bottom of the slower bolinger band, and price is below both bands
// Place a stop loss above the high of the entry candle Example of a short trade using this strategy
// Exit Short Trade When: Price closes inside the bottom of the faster bolinger band"
// © tweakerID
//@version=4
strategy("Double Bollinger Strategy",
overlay=true,
default_qty_type=strategy.percent_of_equity,
default_qty_value=100,
initial_capital=10000,
commission_value=0.04,
calc_on_every_tick=false,
slippage=0)
direction = input(0, title = "Strategy Direction", type=input.integer, minval=-1, maxval=1)
strategy.risk.allow_entry_in(direction == 0 ? strategy.direction.all : (direction < 0 ? strategy.direction.short : strategy.direction.long))
/////////////////////// STRATEGY INPUTS ////////////////////////////////////////
title1=input(true, "-----------------Strategy Inputs-------------------")
i_RSI=input(14, title="RSI Length")
lengthS = input(45, minval=1, title="Slow BB Band Length")
lengthF = input(31, minval=1, title="Fast BB Band Length")
/////////////////////// BACKTESTER /////////////////////////////////////////////
title2=input(true, "-----------------General Inputs-------------------")
// Backtester General Inputs
i_SL=input(true, title="Use Stop Loss and Take Profit")
i_SLType=input(defval="Strategy Stop", title="Type Of Stop", options=["Strategy Stop", "Swing Lo/Hi", "ATR Stop"])
i_SPL=input(defval=10, title="Swing Point Lookback")
i_PercIncrement=input(defval=1, step=.1, title="Swing Point SL Perc Increment")*0.01
i_ATR = input(14, title="ATR Length")
i_ATRMult = input(5, step=.1, title="ATR Multiple")
i_TPRRR = input(2, step=.1, title="Take Profit Risk Reward Ratio")
TS=input(false, title="Trailing Stop")
// Bought and Sold Boolean Signal
bought = strategy.position_size > strategy.position_size[1]
or strategy.position_size < strategy.position_size[1]
// Price Action Stop and Take Profit
LL=(lowest(i_SPL))*(1-i_PercIncrement)
HH=(highest(i_SPL))*(1+i_PercIncrement)
LL_price = valuewhen(bought, LL, 0)
HH_price = valuewhen(bought, HH, 0)
entry_LL_price = strategy.position_size > 0 ? LL_price : na
entry_HH_price = strategy.position_size < 0 ? HH_price : na
tp=strategy.position_avg_price + (strategy.position_avg_price - entry_LL_price)*i_TPRRR
stp=strategy.position_avg_price - (entry_HH_price - strategy.position_avg_price)*i_TPRRR
// ATR Stop
ATR=atr(i_ATR)*i_ATRMult
ATRLong = ohlc4 - ATR
ATRShort = ohlc4 + ATR
ATRLongStop = valuewhen(bought, ATRLong, 0)
ATRShortStop = valuewhen(bought, ATRShort, 0)
LongSL_ATR_price = strategy.position_size > 0 ? ATRLongStop : na
ShortSL_ATR_price = strategy.position_size < 0 ? ATRShortStop : na
ATRtp=strategy.position_avg_price + (strategy.position_avg_price - LongSL_ATR_price)*i_TPRRR
ATRstp=strategy.position_avg_price - (ShortSL_ATR_price - strategy.position_avg_price)*i_TPRRR
// Strategy Stop
float LongStop = valuewhen(bought,low[1],0)*(1-i_PercIncrement)
float ShortStop = valuewhen(bought,high[1],0)*(1+i_PercIncrement)
float StratTP = na
float StratSTP = na
/////////////////////// STRATEGY LOGIC /////////////////////////////////////////
//RSI
RSI=rsi(close, i_RSI)
//BOLL1
[middleS, upperS, lowerS] = bb(close, lengthS, 1)
p1 = plot(upperS, "Slow BB Upper Band", color=color.teal)
p2 = plot(lowerS, "Slow BB Lower Band", color=color.teal)
fill(p1, p2, title = "Slow BB Background", color=color.blue, transp=95)
//BOLL2
[middleF, upperF, lowerF] = bb(close, lengthF, 1)
p1F = plot(upperF, "Fast BB Upper Band", color=color.gray)
p2F = plot(lowerF, "Fast BB Lower Band", color=color.gray)
fill(p1F, p2F, title = "Fast BB Background", color=color.white, transp=95)
BUY = bar_index > 40 and (RSI > 50) and (close > upperF) and crossover(close, upperS)
SELL = bar_index > 40 and (RSI < 50) and (close < lowerF) and crossunder(close, lowerS)
longexit=close < upperF
shortexit=close > lowerF
//Trading Inputs
i_strategyClose=input(true, title="Use Strategy Close Logic")
DPR=input(true, "Allow Direct Position Reverse")
reverse=input(false, "Reverse Trades")
// Entries
if reverse
if not DPR
strategy.entry("long", strategy.long, when=SELL and strategy.position_size == 0)
strategy.entry("short", strategy.short, when=BUY and strategy.position_size == 0)
else
strategy.entry("long", strategy.long, when=SELL)
strategy.entry("short", strategy.short, when=BUY)
else
if not DPR
strategy.entry("long", strategy.long, when=BUY and strategy.position_size == 0)
strategy.entry("short", strategy.short, when=SELL and strategy.position_size == 0)
else
strategy.entry("long", strategy.long, when=BUY)
strategy.entry("short", strategy.short, when=SELL)
if i_strategyClose
strategy.close("long", when=longexit)
strategy.close("short", when=shortexit)
SL= i_SLType == "Swing Lo/Hi" ? entry_LL_price : i_SLType == "ATR Stop" ? LongSL_ATR_price : LongStop
SSL= i_SLType == "Swing Lo/Hi" ? entry_HH_price : i_SLType == "ATR Stop" ? ShortSL_ATR_price : ShortStop
TP= i_SLType == "Swing Lo/Hi" ? tp : i_SLType == "ATR Stop" ? ATRtp : StratTP
STP= i_SLType == "Swing Lo/Hi" ? stp : i_SLType == "ATR Stop" ? ATRstp : StratSTP
//TrailingStop
dif=(valuewhen(strategy.position_size>0 and strategy.position_size[1]<=0, high,0))
-strategy.position_avg_price
trailOffset = strategy.position_avg_price - SL
var tstop = float(na)
if strategy.position_size > 0
tstop := high- trailOffset - dif
if tstop<tstop[1]
tstop:=tstop[1]
else
tstop := na
StrailOffset = SSL - strategy.position_avg_price
var Ststop = float(na)
Sdif=strategy.position_avg_price-(valuewhen(strategy.position_size<0
and strategy.position_size[1]>=0, low,0))
if strategy.position_size < 0
Ststop := low+ StrailOffset + Sdif
if Ststop>Ststop[1]
Ststop:=Ststop[1]
else
Ststop := na
strategy.exit("TP & SL", "long", limit=TP, stop=TS? tstop : SL, when=i_SL)
strategy.exit("TP & SL", "short", limit=STP, stop=TS? Ststop : SSL, when=i_SL)
/////////////////////// PLOTS //////////////////////////////////////////////////
plot(i_SL and strategy.position_size > 0 and not TS ? SL : i_SL and strategy.position_size > 0 and TS ? tstop : na , title='SL', style=plot.style_cross, color=color.red)
plot(i_SL and strategy.position_size < 0 and not TS ? SSL : i_SL and strategy.position_size < 0 and TS ? Ststop : na , title='SSL', style=plot.style_cross, color=color.red)
plot(i_SL and strategy.position_size > 0 ? TP : na, title='TP', style=plot.style_cross, color=color.green)
plot(i_SL and strategy.position_size < 0 ? STP : na, title='STP', style=plot.style_cross, color=color.green)
// Draw price action setup arrows
plotshape(BUY ? 1 : na, style=shape.triangleup, location=location.belowbar,
color=color.green, title="Bullish Setup", size=size.auto)
plotshape(SELL ? 1 : na, style=shape.triangledown, location=location.abovebar,
color=color.red, title="Bearish Setup", size=size.auto)