Quantitative Trendstrategie kombiniert mehrere Faktoren
Überblick
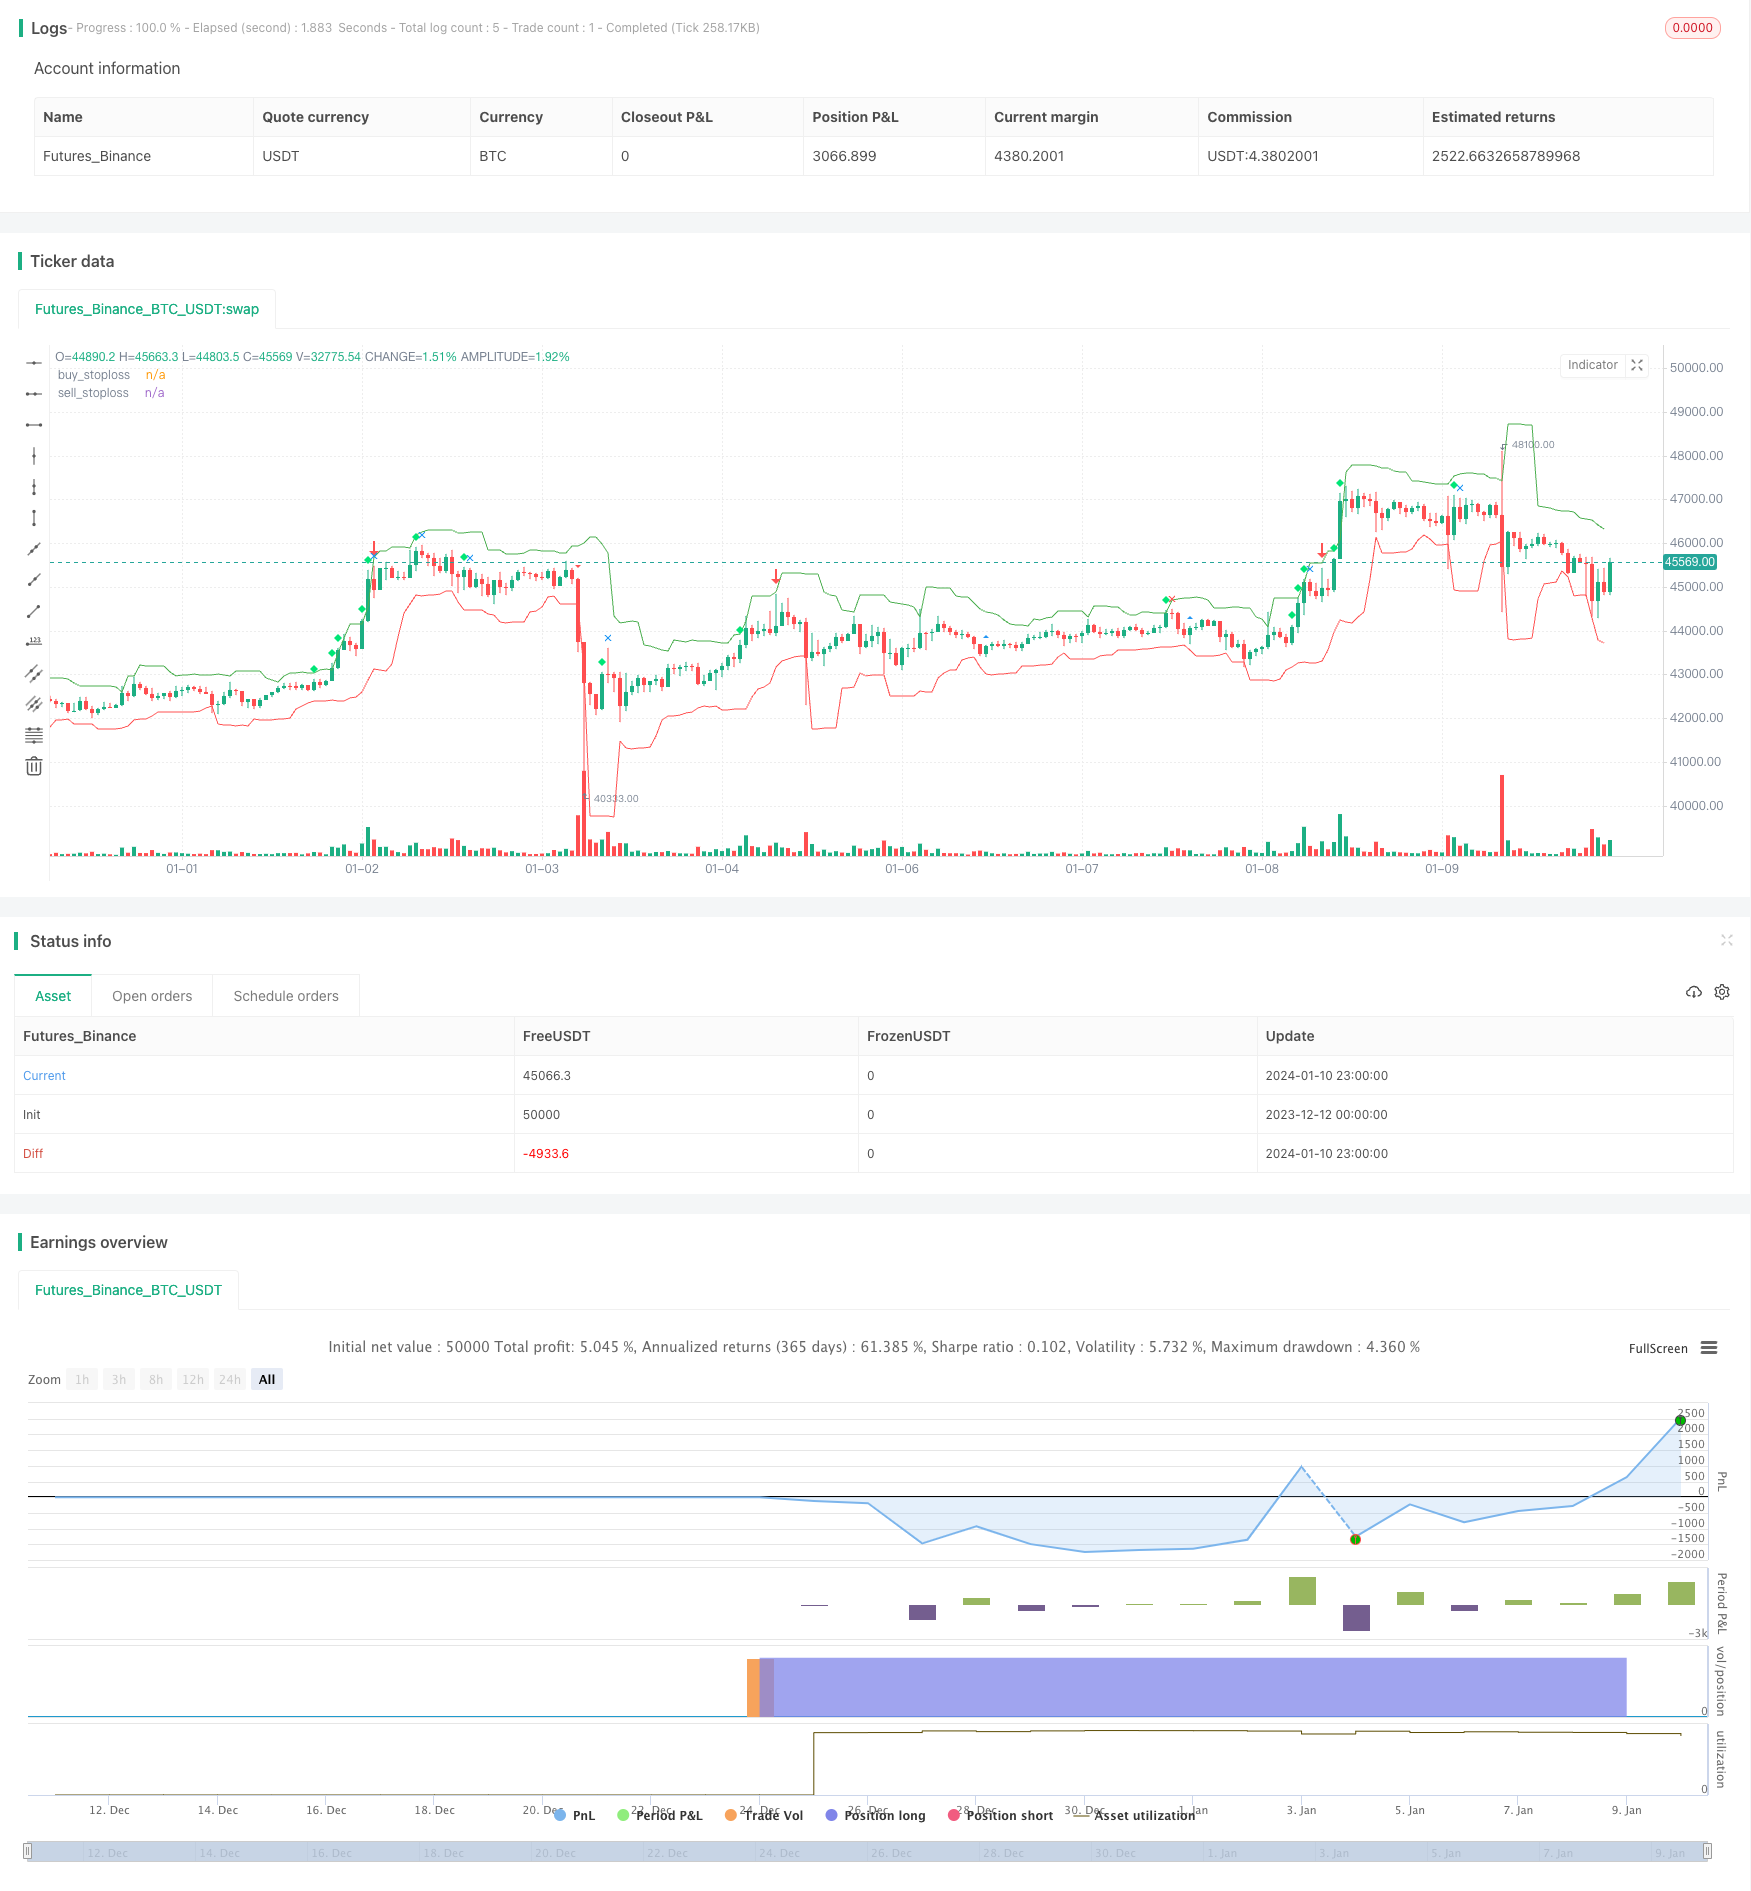
Diese Strategie berücksichtigt mehrere Faktoren wie die Menge der Transaktionen, die Schwankungen, die Schließungsposition, die Tendenz und identifiziert die Handelschancen. Sie gehört zu den typischen Multi-Faktor-Quantifizierungsstrategien.
Strategieprinzip
Die Kernidee dieser Strategie ist die Kombination von mehreren Faktoren wie außergewöhnlichen Durchbruch, Schlussposition und Schwankungsbreite, um Kauf- und Verkaufspunkte zu identifizieren.
Insbesondere berechnet die Strategie die durchschnittliche Handelsmenge in der vergangenen Zeit, und wenn die Handelsmenge in der aktuellen Zyklus einen offensichtlichen außergewöhnlichen Durchbruch aufweist, kann dies eine Trendwende anzeigen. Darüber hinaus bedeutet, dass der aktuelle Trend sich umkehren kann, wenn die Schließungskosten nahe an der Ober- oder Untergrenze der Schwankungsbreite liegen.
Um den Kauf- und Verkaufspunkt zu verifizieren, wird die Strategie auch in Kombination mit einem Indicator für die Schwankungsbreite beurteilt. Wenn die Schwankung den Durchschnitt der vergangenen Zeit überschreitet, wird die erste Bedingung für ein Kauf- und Verkaufssignal gebildet. Dann wird ein Verkaufssignal erzeugt, wenn der Schlusskurs des Aufwärtszyklus in der unteren Hälfte der Schwankungsbreite liegt und der Umsatz steigt.
Darüber hinaus wird die Strategie in Kombination mit dem Gleichgewichtsindikator verwendet, um den Gesamttrend zu bestimmen, und wenn sich der Trend auf der mittleren und langen Linie ändert, wird dies als Bedingung für die Erzeugung von Kauf- und Verkaufssignalen verwendet.
Durch die Kombination der oben genannten Indikatoren kann die Strategie die Kauf- und Verkaufsmomente des Marktes umfassend beurteilen.
Strategische Vorteile
Die wichtigsten Vorteile dieser Strategie bestehen darin, dass mehrere Faktoren berücksichtigt werden, um die Entscheidungen zu treffen und die Ergebnisse zuverlässiger zu machen. Insbesondere gibt es folgende Vorteile:
- Wenn man einen Ausbruch in der Verkehrsauslastung berücksichtigt, können Anzeichen für eine Trendwende frühzeitig erkannt werden.
- Beurteilen Sie die tatsächlichen Trends anhand der Schwankungen und der Schließung, um nicht von dem Geräusch der kurzfristigen Märkte abzulenken.
- In Kombination mit den mittleren und langen Durchschnittskursen wird die Richtung des Gesamttrends beurteilt, um sicherzustellen, dass die Strategie mit den Trends der Großmärkte übereinstimmt.
- Mehrfaktorische und integrierte Beurteilung macht die Strategie stabiler und zuverlässiger, um große Verluste zu vermeiden.
Strategisches Risiko
Die Strategie birgt auch einige Risiken, die beachtet werden müssen:
- Die Kombination von mehreren Faktoren ist komplizierter und die Parameter-Tuning schwieriger.
- Es ist nicht möglich, unnötige Transaktionen durch falsche Durchbrüche zu vermeiden.
- Wenn man die Haupttrends falsch einschätzt, wird die Gesamtwirkung des Betriebs abgewertet.
- Die Einstellung der Volatilitätsparameter muss an die jeweiligen Marktbedingungen angepasst werden.
Optimierungsrichtung
Die Strategie beinhaltet folgende Optimierungsmöglichkeiten:
- Automatische Optimierung von Parametern mit Methoden wie Machine Learning.
- Einzug in die Stop Loss Strategie zur Risikomanagement.
- Die Haupttrends werden durch weitere Faktoren, wie z.B. die Finanzierungsströme, bestimmt.
- Das Design passt sich den Parametern der Schwankungen an.
Zusammenfassen
Die Strategie berücksichtigt mehrere Faktoren zur Identifizierung von Handelsmöglichkeiten. Die Strategie hat den Vorteil, dass sie umfassend und stabil zuverlässig beurteilt wird. Das Hauptrisiko liegt in der Parameterbestimmung und der Fehleinschätzung der Haupttrends.
/*backtest
start: 2023-12-12 00:00:00
end: 2024-01-11 00:00:00
period: 1h
basePeriod: 15m
exchanges: [{"eid":"Futures_Binance","currency":"BTC_USDT"}]
*/

//@version=3
strategy("volume spread analysis ", overlay=true)

volavg = sma(volume,40)
c= close
l=low
h=high
v=volume

volmean 			= 	stdev(volavg,30)
volupband3 			= 	volavg + 3*volmean
volupband2 			= 	volavg + 2*volmean
volupband1 			= 	volavg + 1*volmean
voldnband1 			= 	volavg -1*volmean
voldnband2 			= 	volavg -2*volmean
midprice			=	(high+low)/2
spread				=	(high-low)
avgspread			=	sma(spread,80)
avgspreadbar     	=   spread > avgspread
widerangebar		=	spread>(1.5*avgspread)
narrowrangebar	    =	spread<(0.7*avgspread)
lowvolume			=	volume<volume[1] and volume<volume[2]
upbar				=	close>close[1]
downbar			    =	close<close[1]
highvolume			=	volume>volume[1] and volume[1]>volume[2]
closefactor		    =	close-low
clsposition 		=	spread/closefactor

closeposition		=	iff(closefactor==0,avgspread,clsposition)
vb					=	volume>volavg or volume>volume[1]
upclose			    =	close>=((spread*0.7)+low)// close is above 70% of the bar
downclose			=	close<=((spread*0.3)+low)// close is below the 30% of the bar
aboveclose			=	close>((spread*0.5)+low)// close is between 50% and 70% of the bar
belowclose			=	close<((spread*0.5)+low)// close is between 50% and 30% of the bar
midclose			=	close>((spread*0.3)+low) and c<((spread*0.7)+l)// close is between 30% and 70% of the bar
verylowclose		=	closeposition>4//close is below 25% of the bar
veryhighclose		=	closeposition<1.35// close is above 80% of the bar
closepos			= 	iff(close<=((spread*0.2)+low),1,iff(close<=((spread*0.4)+low),2,iff(close<=((spread*0.6)+low),3,iff(close<=((spread*0.8)+low),4,5))))
                    // 1 = downclose, 2 = belowclose, 3 = midclose, 4 = aboveclose, 5 = upclose
volpos				=  	iff(volume>volavg*2,1,iff(volume>volavg*1.3,2,iff(volume>volavg,3,iff(volume<volavg and volume>volavg*0.7,4,5))))
                    //// 1 = very high, 2 = high, 3 = above average, 4 = less than average, 5 = low
freshgndhi          =  close > highestbars(h,5)
freshgndlo          =  close < lowestbars(l,5)


//========================trend estimation =========================
//jtrend=sma(close,5)
//trendlongterm     =  linreg(jtrend,40)
//trendmediumterm   =  linreg(jtrend,10)
//trendshortterm    =  linreg(jtrend,3)
//tls=linreg(jtrend,3)

minperiodsrwist = input(title="short term min periods",  defval=2, minval=1)
maxperiodsrwist = input(title="short term max periods",  defval=8, minval=1)


minperiodsrwilt = input(title="long term min periods",  defval=10, minval=1)
maxperiodsrwilt = input(title="long term max periods",  defval=40, minval=1)

rwhmins = (high - nz(low[minperiodsrwist])) / (atr(minperiodsrwist) * sqrt(minperiodsrwist))
rwhmaxs = (high - nz(low[maxperiodsrwist])) / (atr(maxperiodsrwist) * sqrt(maxperiodsrwist))
rwhs = max( rwhmins, rwhmaxs )

rwlmins = (nz(high[minperiodsrwist]) - low) / (atr(minperiodsrwist) * sqrt(minperiodsrwist))
rwlmaxs = (nz(high[maxperiodsrwist]) - low) / (atr(maxperiodsrwist) * sqrt(maxperiodsrwist))
rwls = max( rwlmins, rwlmaxs )


rwhminl = (high - nz(low[minperiodsrwilt])) / (atr(minperiodsrwilt) * sqrt(minperiodsrwilt))
rwhmaxl = (high - nz(low[maxperiodsrwilt])) / (atr(maxperiodsrwilt) * sqrt(maxperiodsrwilt))
rwhl = max( rwhminl, rwhmaxl )

rwlminl = (nz(high[minperiodsrwilt]) - low) / (atr(minperiodsrwilt) * sqrt(minperiodsrwilt))
rwlmaxl = (nz(high[maxperiodsrwilt]) - low) / (atr(maxperiodsrwilt) * sqrt(maxperiodsrwilt))
rwll = max( rwlminl, rwlmaxl )


ground = rwhs
sky    = rwls
j      = rwhs-rwls
k      = rwhl-rwll
j2     = rwhl
k2     = rwll
ja     = cross(j,1)
jb     = cross(1,j)
jc     = cross(-1,j)
jd     = cross(j,-1)
j2a    = cross(j2,1)
j2b    = cross(1,j2)
k2a    = cross(k2,1)
k2b    = cross(1,k2)
upmajoron   = j > 1 and ja[1]
upmajoroff  = j < 1 and jb[1]
upminoron   = j2 > 1 and j2a[1]
upminoroff  = j2 < 1 and j2b[1]
dnmajoron   = j < -1 and jc[1]
dnmajoroff  = j > -1 and jd[1]
dnminoron   = k2 > 1 and k2a[1]
dnminoroff  = k2 < 1 and k2b[1]
upimd       = iff(ground > 1, 1,0)
dnimd       = iff(sky > 1, 1, 0)
upmajor     = iff(j>1,1,iff(j<(-1),-1,0))
upminor     = iff(j2>1,1,-1)
dnminor     = iff(k2>1,1,-1)
//======================================================================|

Buy_stop = lowest(low[1],5) - atr(20)[1]
plot(Buy_stop, color=red, title="buy_stoploss")
Sell_stop = highest(high[1],5) + atr(20)[1]
plot(Sell_stop, color=green, title="sell_stoploss")

//======================================================================|

//upthrustbar		=	widerangebar and downclose  and upimd==1 and high>high[1]  //wrb and uhs and fresh ground
nut              	=       widerangebar and downclose  and freshgndhi and highvolume // new signal
bc               	=       widerangebar and aboveclose and volume == highest(volume,60) and upmajor==1  // new signal
upthrustbar		=	widerangebar and (closepos==1 or closepos==2) and upminor>0 and high>high[1] and (upimd>0or upmajor>0) and volpos <4// after minor up trend
upthrustbartrue		=	widerangebar and closepos==1 and upmajor>0 and high>high[1] and volpos <4//occurs after a major uptrend
upthrustcond1		=	upthrustbar[1] and downbar and not narrowrangebar
upthrustcond2		=	upthrustbar[1] and downbar and volpos == 2
upthrustcond3		=	upthrustbar and volpos ==1
toprevbar		=	volume[1]>volavg  and upbar[1] and widerangebar[1] and downbar and downclose and widerangebar and upmajor>0 and high==highest(high,10)
pseudoupthrust		=	upbar[1] and high>high[1] and volume[1]>1.5*volavg and downbar and downclose and  not upthrustbar
pseudoutcond		=	pseudoupthrust[1] and downbar and downclose and not upthrustbar
trendchange		=	upbar[1] and high==highest(high,5) and downbar and (downclose or midclose) and volume>volavg and upmajor>0 and upimd>0 and not widerangebar and not pseudoupthrust
nodemandbarut		=	upbar and narrowrangebar and lowvolume and closepos> 3 and ((upminor>0 and upimd>0)or (upminor<0 and upminor>0))//in a up market
nodemandbardt		=	upbar and narrowrangebar and lowvolume and closepos> 3 and (upminor<=0or upimd<=0)// in a down or sidewayss market
nosupplybar		=	downbar and narrowrangebar and lowvolume  and closepos<3 and ((upminor<1 and upimd<1)or (upminor>0 and upimd<1))
lowvoltest		=   	low==lowest(low,5) and upclose and lowvolume//lowvolume and l<low[1] and upclose
lowvoltest1		= 	low==lowest(low,5) and volume<volavg and low<low[1] and upclose and upminor>0 and upmajor>0// and widerangebar
lowvoltest2		= 	lowvoltest[1] and upbar and upclose
sellcond1		=	(upthrustcond1 or upthrustcond2 or upthrustcond3)
sellcond2		=	sellcond1[1]==0
sellcond		=	sellcond1 and sellcond2
strengthdown0		= 	upmajor<0 and volpos<4 and downbar[1] and upbar and closepos>3 and upminor<0 and upimd<=0// strength after a long down trend
strengthdown		= 	volpos<4 and downbar[1] and upbar and closepos>3 and upimd<=00 and upminor<0// strength after a down trend
strengthdown1		= 	upmajor<0 and volume>(volavg*1.5) and downbar[1] and upbar and closepos>3 and upminor<0 and upimd<=0//strength after downtrend . high volume
strengthdown2		=	upimd<=0 and volume[1]<volavg  and upbar and veryhighclose and volpos<4
buycond1		= 	strengthdown or strengthdown1
buycond			= 	upbar  and buycond1[1]
stopvolume		= 	low==lowest(low,5)  and (upclose or midclose) and v>1.5*volavg and upmajor<0
revupthrust		=	upmajor<0 and upbar and upclose and volume>volume[1] and volume>volavg and  widerangebar and downbar[1] and downclose[1] and upminor<0
effortup		=	high>high[1] and low>low[1] and close>close[1] and close>=((high-low)*0.7+low) and spread>avgspread and volpos<4//and open<=((high-low)*0.3+low)
effortupfail		=	effortup[1] and (upthrustbar or upthrustcond1 or upthrustcond2 or upthrustcond3 or (downbar and avgspreadbar))
effortdown		=	high<high[1] and low<low[1] and close<close[1] and  close<=((high-low)*0.25+low) and widerangebar and volume>volume[1]//o>=((high-low)*0.75+
effortdownfail  	=  	effortdown[1] and ((upbar and avgspreadbar)or revupthrust or buycond1)
upflag           	=  	(sellcond or buycond or effortup or effortupfail or stopvolume or effortdown or effortdownfail or revupthrust or nodemandbardt or nodemandbarut or nosupplybar or lowvoltest	or lowvoltest1 or lowvoltest2 or bc)
bullbar			=	(volume>volavg or volume>volume[1]) and closeposition <2 and upbar and not upflag
bearbar			=	vb  and downclose and downbar and spread>avgspread and not upflag
buy =	(upbar and revupthrust[1])or lowvoltest2
burely				=	strengthdown1 and stopvolume[1]or (upbar and revupthrust[1])or lowvoltest2
//buy				=	effortup and lowvoltest2[1]
//sell			=	upthrustbartrue
sell			=	effortup[1] and effortupfail and upthrustcond3 and upthrustbartrue and toprevbar

strategy.entry("simpleBuy", strategy.long, when= (upbar and revupthrust[1])or lowvoltest2 )
strategy.close("simpleBuy",when=upthrustbartrue )

//strategy.entry("simpleSell", strategy.short,when= upthrustbartrue )
//strategy.close("simpleSell",when= (upbar and revupthrust[1])or lowvoltest2)


//|============================================================================================|
//data = close >= open
//plotshape(true, style=shape.flag, color=data ? green : red)

plotshape((upthrustbar or upthrustbartrue)	,title="upthrustbaro"	,style=shape.arrowdown		,size=size.huge,color=red	)
//plotshape(toprevbar					        ,title="toprevbar"  	,style=shape.flag		,size=size.small,color=blue	)
//plotshape((pseudoupthrust)			    	,title="(pseudoupthrus"	,style=shape.circle		,size=size.small,color=blue	)
//plotshape((upthrustcond1 or upthrustcond2)	,title="upthrustcond1"	,style=shape.triangleup		,size=size.small,color=red	)
plotshape(trendchange		    			,title="trendchange"	,style=shape.xcross		,size=size.small,color=red	)
//plotshape((nodemandbardt)		    		,title="(nodemandbardt"	,style=shape.square		,size=size.small,color=orange	)
//plotshape(nosupplybar				    	,title="nosupplybar"	,style=shape.cross		,size=size.small,color=blue)
plotshape(revupthrust				    	,title="revupthrust"	,style=shape.arrowup		,size=size.huge,color=green	)
//plotshape((upthrustbar	or	upthrustbartrue)	,title="upthrustbaro"	,style=shape.cross		,size=size.small,color=red	)
//plotshape((upthrustcond1	or	upthrustcond2)	,title="upthrustcond1"	,style=shape.triangledown	,size=size.small,color=white	)
//plotshape((pseudoupthrust)				,title="(pseudoupthrus"	,style=shape.arrowup		,size=size.small,color=blue	)
//plotshape(nodemandbarut					,title="nodemandbarut"	,style=shape.labelup		,size=size.small,color=orange	)
//plotshape(nodemandbarut					,title="nodemandbarut"	,style=shape.labeldown		,size=size.small,color=yellow	)
//plotshape(nodemandbardt					,title="nodemandbardt"	,style=shape.diamond      	,size=size.small,color=yellow	)
//plotshape(nosupplybar					,title="nosupplybar"	,style=shape.xcross		,size=size.small,color=blue	)
plotshape(lowvoltest					,title="lowvoltest"	,style=shape.triangleup		,size=size.small,color=blue	)
//plotshape(lowvoltest2					,title="lowvoltest2"	,style=shape.triangledown	,size=size.small,color=yellow	)
//plotshape(strengthdown					,title="strengthdown"	,style=shape.flag		,size=size.small,color=green)
//plotshape(strengthdown					,title="strengthdown"	,style=shape.circle		,size=size.small,color=lime	)
//plotshape(strengthdown2					,title="strengthdown2"	,style=shape.arrowup		,size=size.small,color=silver	)
//plotshape(strengthdown2					,title="strengthdown2"	,style=shape.arrowdown		,size=size.small,color=red	)
//plotshape(stopvolume					,title="stopvolume"	,style=shape.labelup		,size=size.small,color=green	)
//plotshape(stopvolume					,title="stopvolume"	,style=shape.labeldown		,size=size.small,color=yellow	)
plotshape(effortup					,title="effortup"	,style=shape.diamond      	,size=size.small,color=lime	)
plotshape(effortupfail					,title="effortupfail"	,style=shape.xcross		,size=size.small,color=blue	)
//plotshape(effortupfail					,title="effortupfail"	,style=shape.cross		,size=size.small,color=white	)
plotshape(effortdown					,title="effortdown"	,style=shape.triangledown		,size=size.small,color=red	)
plotshape(effortdownfail				,title="effortdownfail"	,style=shape.xcross	,size=size.small,color=green	)
//plotshape(effortdownfail				,title="effortdownfail"	,style=shape.flag		,size=size.small,color=white	)
//plotshape(buycond					,title="buycond"	,style=shape.circle		,size=size.small,color=green	)
//plotshape(sellcond					,title="sellcond"	,style=shape.arrowup		,size=size.small,color=orange	)
//plotshape((nut)						,title="(nut)"		,style=shape.arrowdown		,size=size.small,color=lime	)
//plotshape((bc	)					,title="(bc"		,style=shape.labelup		,size=size.small,color=red	)
//plotshape(buy						,title="buy"		,style=shape.labeldown		,size=size.small,color=white	)