Bidirektionale adaptive Bereichsfilterung und Momentenverfolgungsstrategie
Erstellungsdatum:
2024-01-24 11:31:51
zuletzt geändert:
2024-01-24 11:32:23
Kopie:
1
Klicks:
705
1
konzentrieren Sie sich auf
1750
Anhänger
Überblick
Die Strategie ist eine zweiseitige, selbst adaptierte Range-Filter-Strategie, die Preisschwankungen verfolgt. Sie nutzt einen selbst adaptierten Range-Filter, um Preisschwankungen zu verfolgen, und kombiniert die Quantität mit der Fähigkeit, die Wertrichtung zu bestimmen, um einen niedrigen Kauf zu erzielen.
Strategieprinzip
- Die Filtergröße wird entsprechend der vom Benutzer festgelegten Reichweite, Anzahl und Größe angepasst.
- Es gibt zwei Arten von Filtern: Typen 1 und 2. Typ 1 ist der Standard-Bereichs-Tracking-Filter und Typ 2 ist der Stufen-Rundung-Filter.
- Die Richtung der Kursbewegung wird anhand der Größe des Filters und der Schlusskosten bestimmt. Die Preise sind oberhalb der oberen Bahn bullish und unterhalb der unteren Bahn bearish.
- Die Kursrichtung wird in Verbindung mit dem Kursrückgang des Vortags bestimmt. Der Kurs steigt als Mehrkopf und sinkt als Leerkopf.
- Ein Kaufsignal wird ausgesendet, wenn der Preis die Bahn überschreitet und der Wert steigt. Ein Verkaufsignal wird ausgesendet, wenn der Preis die Bahn überschreitet und der Wert sinkt.
Analyse der Stärken
- Der Adaptive-Range-Filter kann die Marktschwankungen genau erfassen.
- Zwei Arten von Filtern können unterschiedliche Handelspräferenzen erfüllen.
- Die kombinierte Quantität kann die Wertrichtung wirksam erkennen.
- Die Strategie ist flexibel und kann an die Parameter des Marktes angepasst werden.
- Customize: Wählen Sie die entsprechenden Transaktionsbedingungen und Logik.
Risikoanalyse
- Die falsche Einstellung der Parameter kann zu übermäßigen Transaktionen oder fehlenden Einträgen führen.
- Das Durchbruchsignal ist etwas zurückgeblieben.
- Das Risiko für die Quanten-Indikatoren liegt in der Größenordnung von etwa 1 Kilo.
- Die Grenzüberschreitung ist leicht zu erwischen.
Risiken:
- Wählen Sie die richtige Parameterkombination und passen Sie sie an.
- In Kombination mit anderen Indikatoren werden Trends identifiziert.
- Vorsicht beim Handel in der Nähe von Schlüsselpositionen und bei Trendwende.
Optimierungsrichtung
- Verschiedene Kombinationen von Reichweiten und Gleitzyklusparametern werden getestet, um die optimale Kombination zu finden.
- Probieren Sie verschiedene Filtertypen aus und wählen Sie die von Ihnen bevorzugte aus.
- Versuche mit anderen quantitativen Indikatoren oder mit technischen Hilfsmitteln
- Optimierung und Anpassung der Logik der Transaktionsbedingungen, um unvernünftige Transaktionen zu reduzieren.
- In Kombination mit der Theorie der Marktspezifizierung wird ein anpassungsfähiger Positionsverhältnis festgelegt.
Strategiequellcode
/*backtest
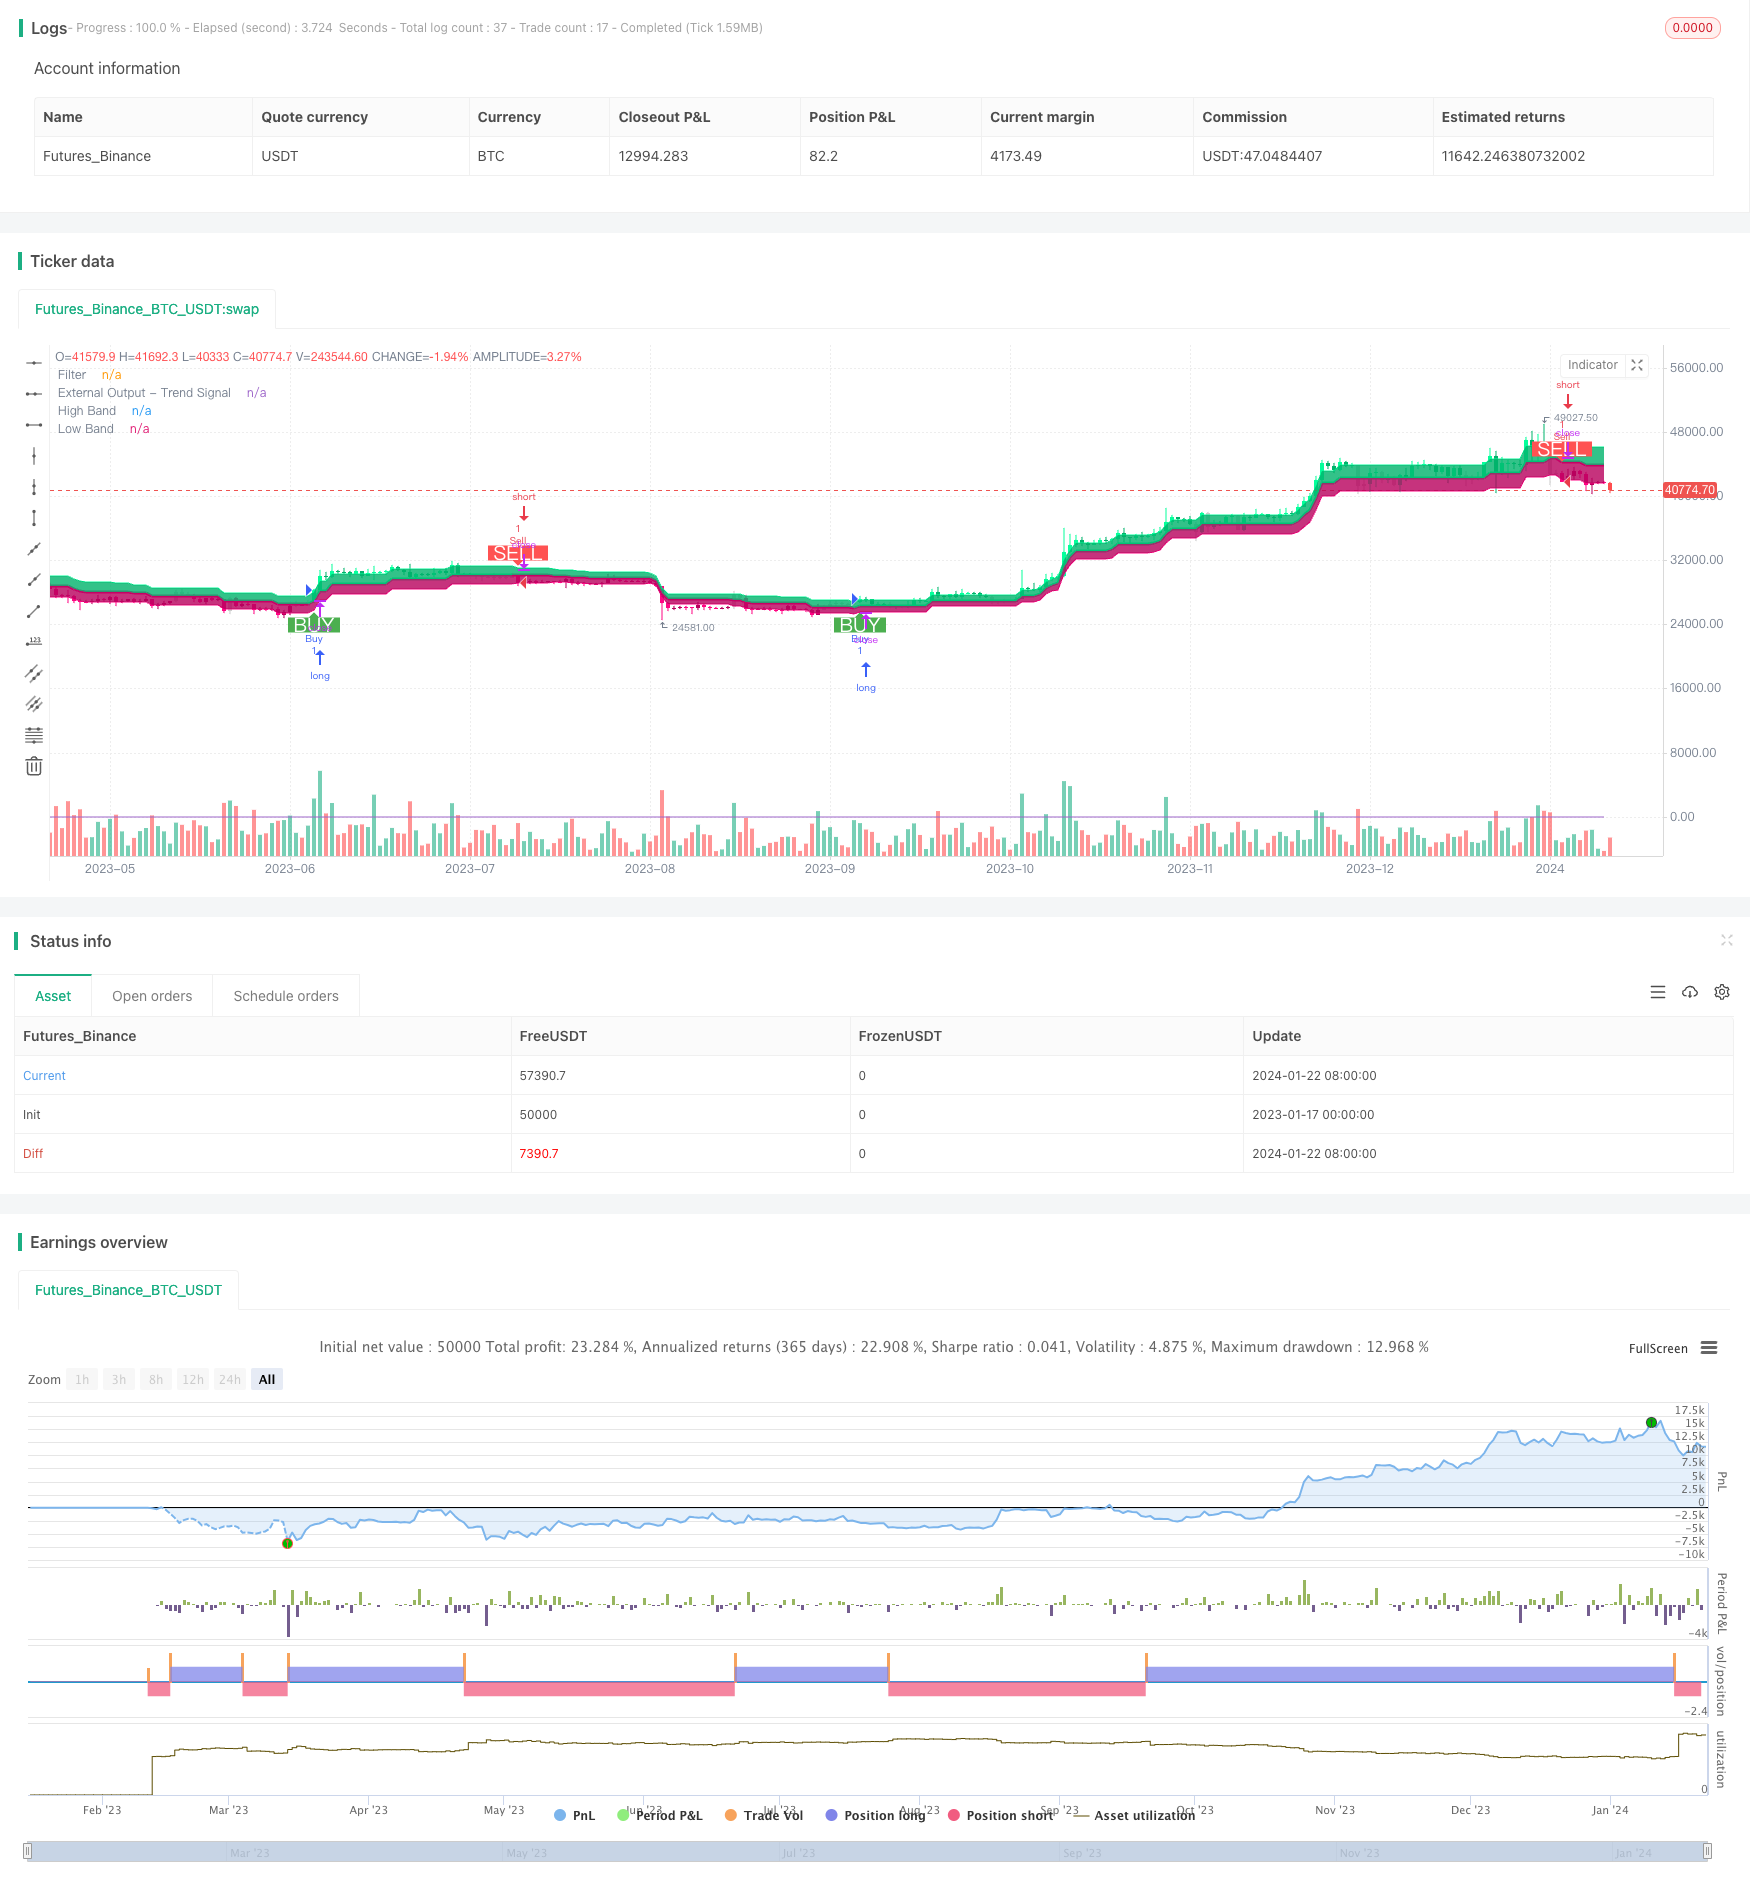
start: 2023-01-17 00:00:00
end: 2024-01-23 00:00:00
period: 1d
basePeriod: 1h
exchanges: [{"eid":"Futures_Binance","currency":"BTC_USDT"}]
*/
//@version=4
strategy("Range Filter [DW] & Labels", shorttitle="RF [DW] & Labels", overlay=true)
//Conditional Sampling EMA Function
Cond_EMA(x, cond, n)=>
var val = array.new_float(0)
var ema_val = array.new_float(1)
if cond
array.push(val, x)
if array.size(val) > 1
array.remove(val, 0)
if na(array.get(ema_val, 0))
array.fill(ema_val, array.get(val, 0))
array.set(ema_val, 0, (array.get(val, 0) - array.get(ema_val, 0))*(2/(n + 1)) + array.get(ema_val, 0))
EMA = array.get(ema_val, 0)
EMA
//Conditional Sampling SMA Function
Cond_SMA(x, cond, n)=>
var vals = array.new_float(0)
if cond
array.push(vals, x)
if array.size(vals) > n
array.remove(vals, 0)
SMA = array.avg(vals)
SMA
//Standard Deviation Function
Stdev(x, n)=>
sqrt(Cond_SMA(pow(x, 2), 1, n) - pow(Cond_SMA(x, 1, n), 2))
//Range Size Function
rng_size(x, scale, qty, n)=>
ATR = Cond_EMA(tr(true), 1, n)
AC = Cond_EMA(abs(x - x[1]), 1, n)
SD = Stdev(x, n)
rng_size = scale=="Pips" ? qty*0.0001 : scale=="Points" ? qty*syminfo.pointvalue : scale=="% of Price" ? close*qty/100 : scale=="ATR" ? qty*ATR :
scale=="Average Change" ? qty*AC : scale=="Standard Deviation" ? qty*SD : scale=="Ticks" ? qty*syminfo.mintick : qty
//Two Type Range Filter Function
rng_filt(h, l, rng_, n, type, smooth, sn, av_rf, av_n)=>
rng_smooth = Cond_EMA(rng_, 1, sn)
r = smooth ? rng_smooth : rng_
var rfilt = array.new_float(2, (h + l)/2)
array.set(rfilt, 1, array.get(rfilt, 0))
if type=="Type 1"
if h - r > array.get(rfilt, 1)
array.set(rfilt, 0, h - r)
if l + r < array.get(rfilt, 1)
array.set(rfilt, 0, l + r)
if type=="Type 2"
if h >= array.get(rfilt, 1) + r
array.set(rfilt, 0, array.get(rfilt, 1) + floor(abs(h - array.get(rfilt, 1))/r)*r)
if l <= array.get(rfilt, 1) - r
array.set(rfilt, 0, array.get(rfilt, 1) - floor(abs(l - array.get(rfilt, 1))/r)*r)
rng_filt1 = array.get(rfilt, 0)
hi_band1 = rng_filt1 + r
lo_band1 = rng_filt1 - r
rng_filt2 = Cond_EMA(rng_filt1, rng_filt1 != rng_filt1[1], av_n)
hi_band2 = Cond_EMA(hi_band1, rng_filt1 != rng_filt1[1], av_n)
lo_band2 = Cond_EMA(lo_band1, rng_filt1 != rng_filt1[1], av_n)
rng_filt = av_rf ? rng_filt2 : rng_filt1
hi_band = av_rf ? hi_band2 : hi_band1
lo_band = av_rf ? lo_band2 : lo_band1
[hi_band, lo_band, rng_filt]
//-----------------------------------------------------------------------------------------------------------------------------------------------------------------
//Inputs
//-----------------------------------------------------------------------------------------------------------------------------------------------------------------
//Filter Type
f_type = input(defval="Type 1", options=["Type 1", "Type 2"], title="Filter Type")
//Movement Source
mov_src = input(defval="Close", options=["Wicks", "Close"], title="Movement Source")
//Range Size Inputs
rng_qty = input(defval=2.618, minval=0.0000001, title="Range Size")
rng_scale = input(defval="Average Change", options=["Points", "Pips", "Ticks", "% of Price", "ATR", "Average Change", "Standard Deviation", "Absolute"], title="Range Scale")
//Range Period
rng_per = input(defval=14, minval=1, title="Range Period (for ATR, Average Change, and Standard Deviation)")
//Range Smoothing Inputs
smooth_range = input(defval=true, title="Smooth Range")
smooth_per = input(defval=27, minval=1, title="Smoothing Period")
//Filter Value Averaging Inputs
av_vals = input(defval=true, title="Average Filter Changes")
av_samples = input(defval=2, minval=1, title="Number Of Changes To Average")
//-----------------------------------------------------------------------------------------------------------------------------------------------------------------
//Definitions
//-----------------------------------------------------------------------------------------------------------------------------------------------------------------
//High And Low Values
h_val = mov_src=="Wicks" ? high : close
l_val = mov_src=="Wicks" ? low : close
//Range Filter Values
[h_band, l_band, filt] = rng_filt(h_val, l_val, rng_size((h_val + l_val)/2, rng_scale, rng_qty, rng_per), rng_per, f_type, smooth_range, smooth_per, av_vals, av_samples)
//Direction Conditions
var fdir = 0.0
fdir := filt > filt[1] ? 1 : filt < filt[1] ? -1 : fdir
upward = fdir==1 ? 1 : 0
downward = fdir==-1 ? 1 : 0
//Colors
filt_color = upward ? #05ff9b : downward ? #ff0583 : #cccccc
bar_color = upward and (close > filt) ? (close > close[1] ? #05ff9b : #00b36b) :
downward and (close < filt) ? (close < close[1] ? #ff0583 : #b8005d) : #cccccc
//-----------------------------------------------------------------------------------------------------------------------------------------------------------------
//Outputs
//-----------------------------------------------------------------------------------------------------------------------------------------------------------------
//Filter Plot
filt_plot = plot(filt, color=filt_color, transp=0, linewidth=3, title="Filter")
//Band Plots
h_band_plot = plot(h_band, color=#05ff9b, transp=100, title="High Band")
l_band_plot = plot(l_band, color=#ff0583, transp=100, title="Low Band")
//Band Fills
fill(h_band_plot, filt_plot, color=#00b36b, transp=85, title="High Band Fill")
fill(l_band_plot, filt_plot, color=#b8005d, transp=85, title="Low Band Fill")
//Bar Color
barcolor(bar_color)
//External Trend Output
plot(fdir, transp=100, editable=false, display=display.none, title="External Output - Trend Signal")
// Trading Conditions Logic
longCond = close > filt and close > close[1] and upward > 0 or close > filt and close < close[1] and upward > 0
shortCond = close < filt and close < close[1] and downward > 0 or close < filt and close > close[1] and downward > 0
CondIni = 0
CondIni := longCond ? 1 : shortCond ? -1 : CondIni[1]
longCondition = longCond and CondIni[1] == -1
shortCondition = shortCond and CondIni[1] == 1
// Strategy Entry and Exit
strategy.entry("Buy", strategy.long, when = longCondition)
strategy.entry("Sell", strategy.short, when = shortCondition)
strategy.close("Buy", when = shortCondition)
strategy.close("Sell", when = longCondition)
// Plot Buy and Sell Labels
plotshape(longCondition, title = "Buy Signal", text ="BUY", textcolor = color.white, style=shape.labelup, size = size.normal, location=location.belowbar, color = color.green, transp = 0)
plotshape(shortCondition, title = "Sell Signal", text ="SELL", textcolor = color.white, style=shape.labeldown, size = size.normal, location=location.abovebar, color = color.red, transp = 0)
// Alerts
alertcondition(longCondition, title="Buy Alert", message = "BUY")
alertcondition(shortCondition, title="Sell Alert", message = "SELL")