Zweiseitige Schock-Durchbruchsstrategie
Überblick
Diese Strategie ist eine quantitative Handelsstrategie, die auf einem zweiseitigen Preis-Schock-Break basiert. Sie verwendet Pivot-High-Low-Punkte als wichtige Resistenzpositionen für die Preise und überschreitet die Pivot-High-Punkte, während die Pivot-Low-Punkte aufgelöst werden, um eine zweiseitige Operation durchzuführen.
Strategieprinzip
Die Kernlogik der Strategie basiert auf einem Zwei-Wege-Preis-Key-Point-Breakthrough. Konkret gibt es folgende Schritte:
Berechnen Sie die Pivot-Hoch-Low-Punkte für die angegebene Periode. Die Funktionen ta.pivothigh () und ta.pivotlow () werden verwendet, um die höchsten Preise der letzten 2 Tage als Hoch und die niedrigsten Preise der letzten 1 Tage als Tief zu berechnen.
Wenn der Preis die oben berechneten kritischen Höchststände überschreitet, wird ein Plus eingetragen. Wenn der Preis die kritischen Tiefststände überschreitet, wird ein Defizit eingetragen.
Verwenden Sie die Stop-Loss-Einheit Stop-Loss. Wenn Sie mehr tun, ist der Stop-Loss-Preis der Höchstpunkt + die kleinste Preisänderungseinheit.
Es ist wichtig, die Höhe und die Tiefe der Schlüsselfunktionen zu erfassen, um eine intuitive Einschätzung zu ermöglichen.
Auf diese Weise können Sie bei Preisbewegungen in der Lage sein, rechtzeitig zu brechen und schnell zu verlieren, um einen Gewinn zu erzielen. Wenn der Preis immer wieder neue Höhen oder neue Tiefen durchbricht, kann die Strategie mehrere Akkumulationsgewinne erzielen.
Analyse der Stärken
Diese Strategie der Zwei-Wege-Durchbruch hat folgende Vorteile:
Einfach zu verstehen und zu implementieren. Die Strategie ist sehr einfach, wenn man nur die Pivot-Hoch-Tiefpunkte durchbricht.
Einfache Einstellung von Stop-Losses. Mehrere Positionen mit Höhe und Tiefe + Mindestwechsel-Distanz als Stop-Loss-Stelle, um schnell zu stoppen und das Risiko effektiv zu kontrollieren.
Die Strategie kann in beide Richtungen betrieben werden.
Die Strategie kann in den Markt eingegeben werden, um einen Gewinn zu erzielen, wenn die Preise häufig steigen und fallen.
Risikoanalyse
Obwohl diese Strategie die oben genannten Vorteile hat, gibt es einige Risiken, die beachtet werden müssen:
Die falsche Bestimmung der Schlüsselpunkte kann die Verluste erhöhen. Wenn die Schlüsselhöhen und -tiefpunkte falsch eingestellt sind, kann es in extremen Fällen zu Höhen- und Abstürzen kommen.
Die Strategie kann nach dem Ende der Erschütterung zu Verlusten führen. Es ist schwierig, zu profitieren, wenn die Preise beginnen, einseitig zu brechen, anstatt zu erschüttern.
Ein Durchbruch kann ein kurzfristiger Falsch-Durchbruch sein. Es kann auch ein Falsch-Durchbruch in der kurzfristigen Periode sein, der die Strategie zu falschen Transaktionen führt.
Insgesamt ist die Strategie besser geeignet für den Einsatz in einem wackligen Umfeld. Anleger müssen darauf achten, die Trends zu beurteilen und diese Strategie nicht in einem trendmäßigen Umfeld zu verwenden.
Optimierungsrichtung
Angesichts der oben genannten Risiken besteht für die Strategie Raum für Optimierungen, insbesondere in folgenden Bereichen:
Intelligente Auswahl von Schlüssel-Hoch-Low-Parametern. So kann das System automatisch optimieren, um geeignete Schlüssel-Parametern zu vergleichen.
Kombination mit Trendbeurteilung. Auf der Basis der Strategie erhöhen Sie die Trendbeurteilungslogik, verwenden Sie die Strategie bei einem Erschütterungsfall und schließen Sie die Strategie bei einem einseitigen Trend aus, um den Verlust zu verringern.
Erhöhung der Stop-Strategie. Es können noch feinere Stop-Strategien, wie beispielsweise Moving Stop, Interval Break Stop, entwickelt werden, um das Risiko weiter zu kontrollieren.
Zusammenfassen
Diese Strategie ist eine einfache, praktische, zweiseitige Breakout-Strategie. Sie basiert auf einem Preis-Key-Point-Breakthrough, um in den Markt einzusteigen, und stellt ein kontrolliertes Stop-Loss-Risiko dar. Die Strategie ist für ein bewegliches Geschäft geeignet, um einen zweiseitigen Handel zu gewinnen.
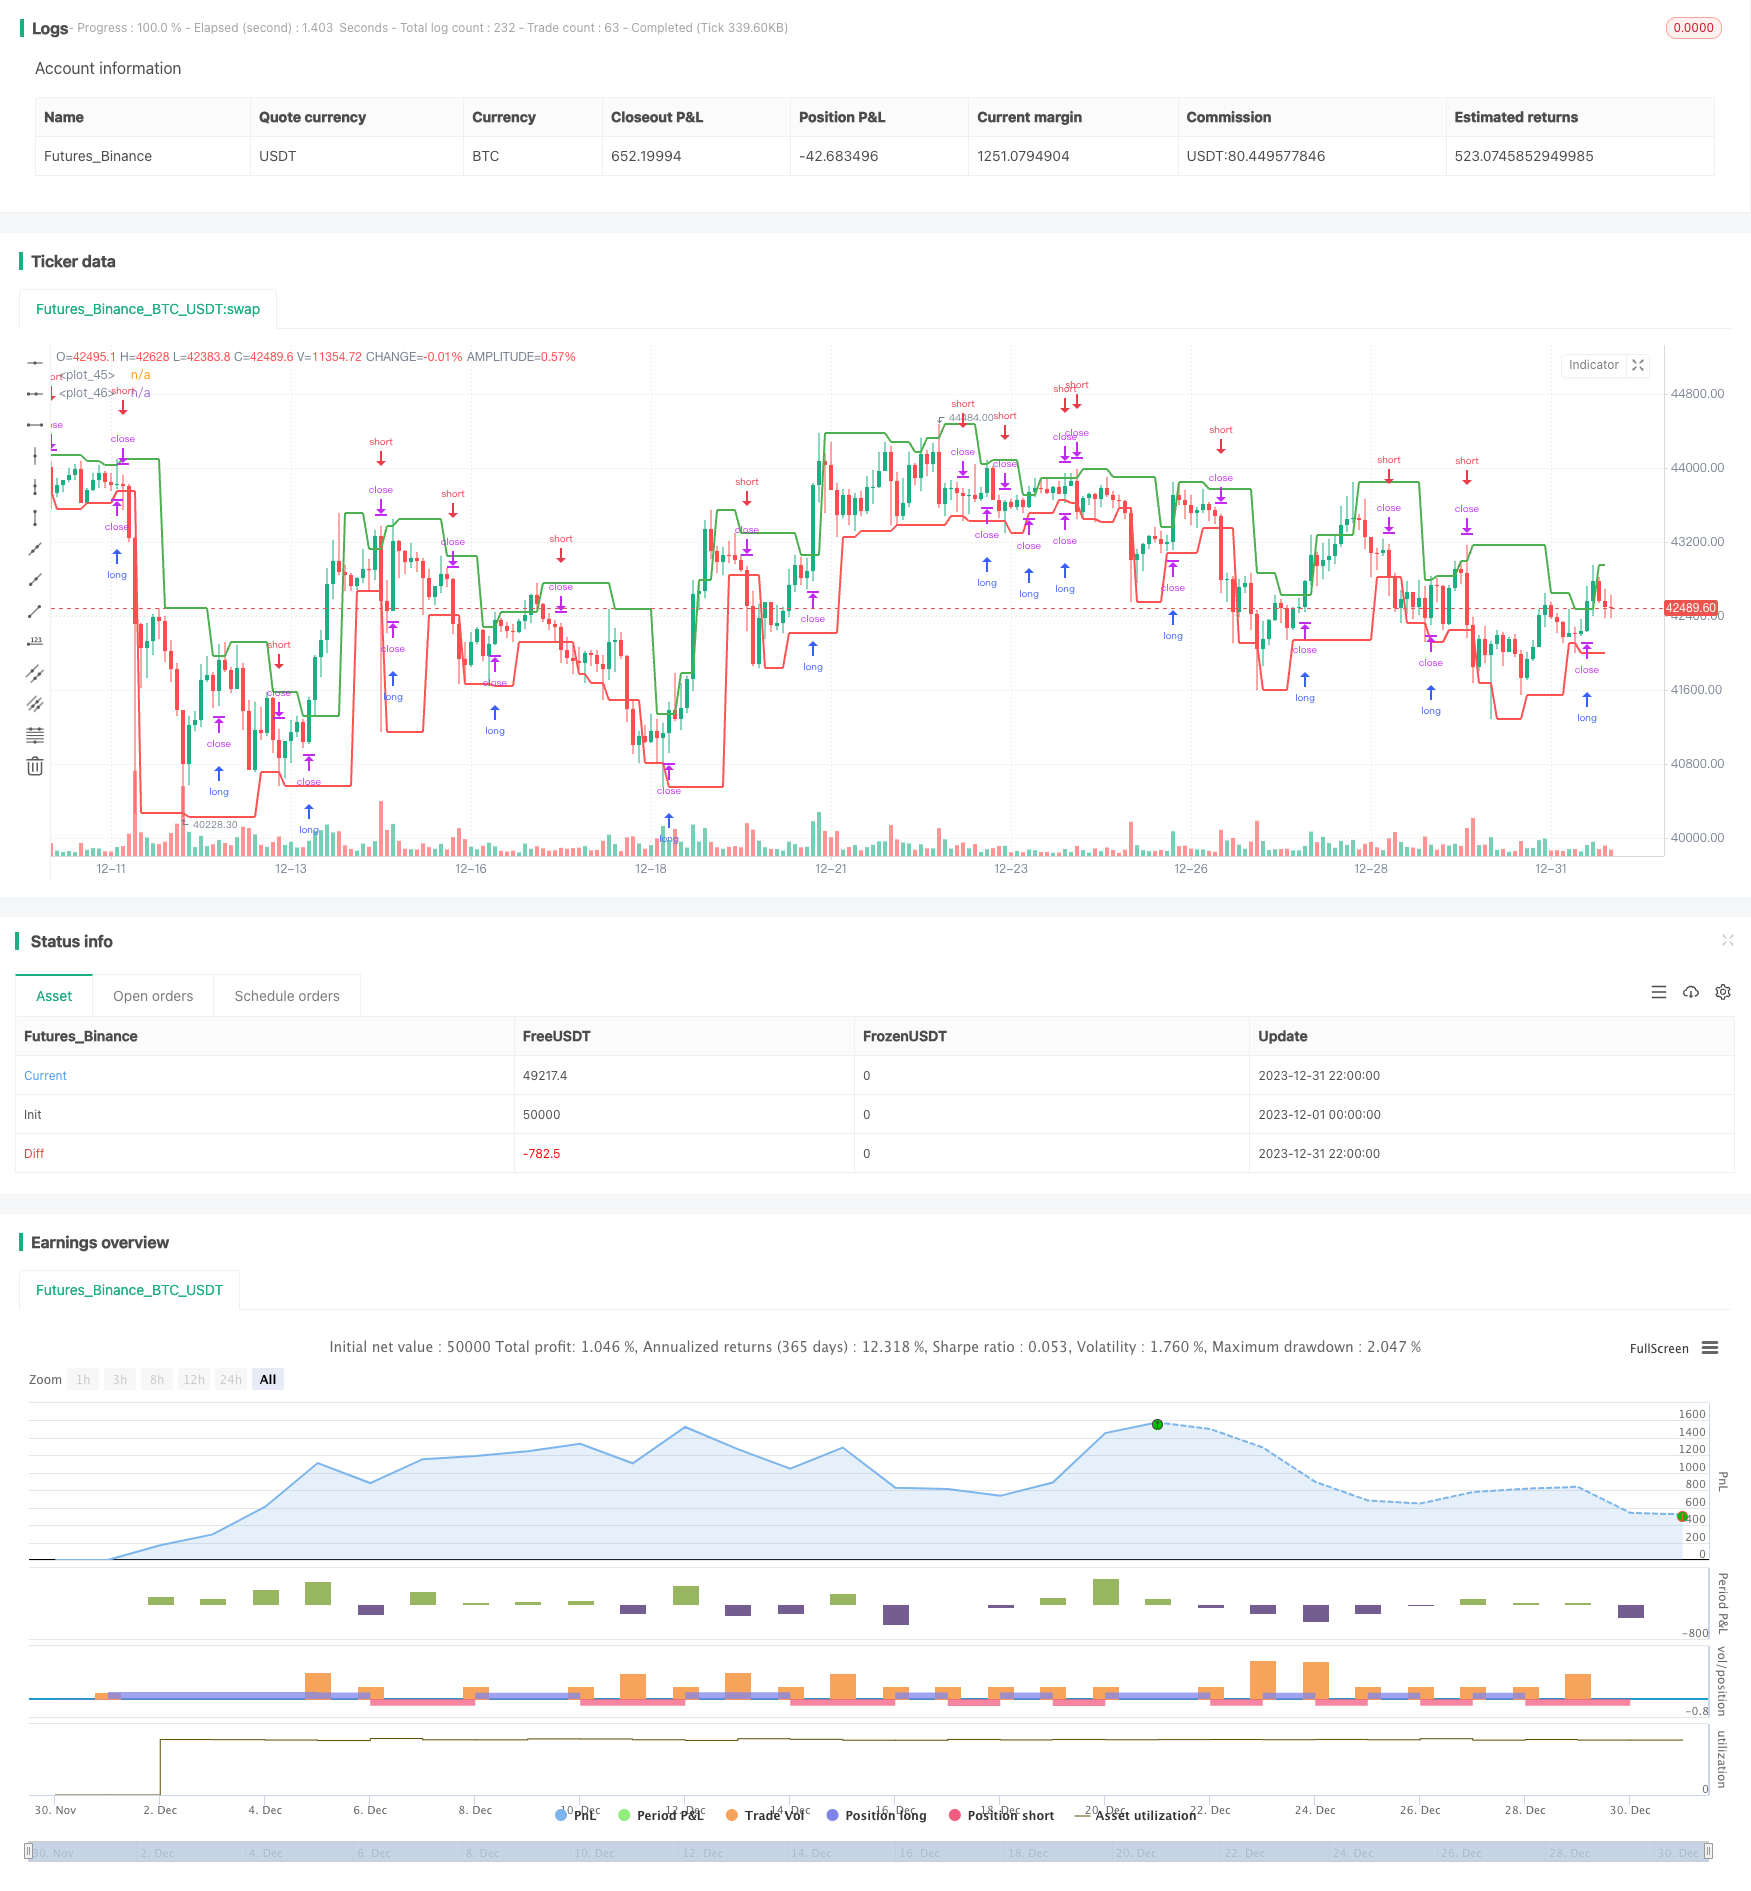
/*backtest
start: 2023-12-01 00:00:00
end: 2023-12-31 23:59:59
period: 2h
basePeriod: 15m
exchanges: [{"eid":"Futures_Binance","currency":"BTC_USDT"}]
*/

//@version=5
strategy('Monthly Returns with Benchmark', overlay=true, default_qty_type=strategy.percent_of_equity, default_qty_value=25, commission_type=strategy.commission.percent, commission_value=0.1)

////////////
// Inputs //

// Pivot points inputs
leftBars   = input(2, group = "Pivot Points")
rightBars  = input(1, group = "Pivot Points")

// Styling inputs
prec       = input(2, title='Return Precision',                            group = "Monthly Table")
from_date  = input(timestamp("01 Jan 2000 00:00 +0000"), "From Date", group = "Monthly Table")
prof_color = input.color(color.green, title = "Gradient Colors", group = "Monthly Table", inline = "colors")
loss_color = input.color(color.red,   title = "",                group = "Monthly Table", inline = "colors")

// Benchmark inputs
use_cur    = input.bool(true,        title = "Use current Symbol for Benchmark", group = "Benchmark")
symb_bench = input('BTC_USDT:swap', title = "Benchmark",                        group = "Benchmark")
disp_bench = input.bool(true,        title = "Display Benchmark?",               group = "Benchmark")
disp_alpha = input.bool(true,        title = "Display Alpha?",                   group = "Benchmark")

// Pivot Points Strategy
swh = ta.pivothigh(leftBars, rightBars)
swl = ta.pivotlow(leftBars, rightBars)

hprice = 0.0
hprice := not na(swh) ? swh : hprice[1]

lprice = 0.0
lprice := not na(swl) ? swl : lprice[1]

le = false
le := not na(swh) ? true : le[1] and high > hprice ? false : le[1]

se = false
se := not na(swl) ? true : se[1] and low < lprice ? false : se[1]

if le
    strategy.entry('PivRevLE', strategy.long, comment='PivRevLE', stop=hprice + syminfo.mintick)

if se
    strategy.entry('PivRevSE', strategy.short, comment='PivRevSE', stop=lprice - syminfo.mintick)

plot(hprice, color=color.new(color.green, 0), linewidth=2)
plot(lprice, color=color.new(color.red, 0), linewidth=2)

///////////////////
// MONTHLY TABLE //

new_month = month(time) != month(time[1])
new_year  = year(time)  != year(time[1])

eq       = strategy.equity
bench_eq = close

// benchmark eq
bench_eq_htf = request.security(symb_bench, timeframe.period, close)

if (not use_cur)
    bench_eq := bench_eq_htf

bar_pnl   = eq / eq[1] - 1
bench_pnl = bench_eq / bench_eq[1] - 1

cur_month_pnl = 0.0
cur_year_pnl  = 0.0

// Current Monthly P&L
cur_month_pnl := bar_index == 0 ? 0 :
                 time >= from_date and (time[1] < from_date or new_month) ? bar_pnl :
                 (1 + cur_month_pnl[1]) * (1 + bar_pnl) - 1

// Current Yearly P&L
cur_year_pnl  := bar_index == 0 ? 0 :
                 time >= from_date and (time[1] < from_date or new_year) ? bar_pnl :
                 (1 + cur_year_pnl[1]) * (1 + bar_pnl) - 1

bench_cur_month_pnl = 0.0
bench_cur_year_pnl  = 0.0

// Current Monthly P&L - Bench
bench_cur_month_pnl := bar_index == 0 or (time[1] < from_date and time >= from_date) ? 0 :
                       time >= from_date and new_month ? bench_pnl :
                       (1 + bench_cur_month_pnl[1]) * (1 + bench_pnl) - 1

// Current Yearly P&L - Bench
bench_cur_year_pnl :=  bar_index == 0 ? 0 :
                       time >= from_date and (time[1] < from_date  or new_year) ? bench_pnl :
                       (1 + bench_cur_year_pnl[1]) * (1 + bench_pnl) - 1

var month_time = array.new_int(0)
var year_time  = array.new_int(0)

var month_pnl = array.new_float(0)
var year_pnl  = array.new_float(0)

var bench_month_pnl = array.new_float(0)
var bench_year_pnl  = array.new_float(0)

// Filling monthly / yearly pnl arrays
if array.size(month_time) > 0
    if month(time) == month(array.get(month_time, array.size(month_time) - 1))
        array.pop(month_pnl)
        array.pop(bench_month_pnl)
        array.pop(month_time)

if array.size(year_time) > 0
    if year(time) == year(array.get(year_time, array.size(year_time) - 1))
        array.pop(year_pnl)
        array.pop(bench_year_pnl)
        array.pop(year_time)

if (time >= from_date)
    array.push(month_time, time)
    array.push(year_time,  time)

    array.push(month_pnl, cur_month_pnl)
    array.push(year_pnl,  cur_year_pnl)

    array.push(bench_year_pnl,  bench_cur_year_pnl)
    array.push(bench_month_pnl, bench_cur_month_pnl)

// Monthly P&L Table
var monthly_table = table(na)

if array.size(year_pnl) > 0 and barstate.islastconfirmedhistory

    monthly_table := table.new(position.bottom_right, columns=15, rows=array.size(year_pnl) * 3 + 5, border_width=1)

    // Fill monthly performance

    table.cell(monthly_table, 0, 0,  'Perf', bgcolor = #999999)
    table.cell(monthly_table, 1, 0,  'Jan',  bgcolor = #999999)
    table.cell(monthly_table, 2, 0,  'Feb',  bgcolor = #999999)
    table.cell(monthly_table, 3, 0,  'Mar',  bgcolor = #999999)
    table.cell(monthly_table, 4, 0,  'Apr',  bgcolor = #999999)
    table.cell(monthly_table, 5, 0,  'May',  bgcolor = #999999)
    table.cell(monthly_table, 6, 0,  'Jun',  bgcolor = #999999)
    table.cell(monthly_table, 7, 0,  'Jul',  bgcolor = #999999)
    table.cell(monthly_table, 8, 0,  'Aug',  bgcolor = #999999)
    table.cell(monthly_table, 9, 0,  'Sep',  bgcolor = #999999)
    table.cell(monthly_table, 10, 0, 'Oct',  bgcolor = #999999)
    table.cell(monthly_table, 11, 0, 'Nov',  bgcolor = #999999)
    table.cell(monthly_table, 12, 0, 'Dec',  bgcolor = #999999)
    table.cell(monthly_table, 13, 0, ' ', bgcolor = #999999)
    table.cell(monthly_table, 14, 0, 'Year', bgcolor = #999999)

    max_abs_y = math.max(math.abs(array.max(year_pnl)),  math.abs(array.min(year_pnl)))
    max_abs_m = math.max(math.abs(array.max(month_pnl)), math.abs(array.min(month_pnl)))

    for yi = 0 to array.size(year_pnl) - 1 by 1
        table.cell(monthly_table, 0,  yi + 1, str.tostring(year(array.get(year_time, yi))), bgcolor=#cccccc)
        table.cell(monthly_table, 13, yi + 1, ' ',   bgcolor=#999999)
        y_color = color.from_gradient(array.get(year_pnl, yi), -max_abs_y, max_abs_y, loss_color, prof_color)
        table.cell(monthly_table, 14, yi + 1, str.tostring(math.round(array.get(year_pnl, yi) * 100, prec)), bgcolor=y_color)

    for mi = 0 to array.size(month_time) - 1 by 1
        m_row = year(array.get(month_time, mi)) - year(array.get(year_time, 0)) + 1
        m_col = month(array.get(month_time, mi))
        m_color = color.from_gradient(array.get(month_pnl, mi), -max_abs_m, max_abs_m, loss_color, prof_color)

        table.cell(monthly_table, m_col, m_row, str.tostring(math.round(array.get(month_pnl, mi) * 100, prec)), bgcolor=m_color)

    // Fill benchmark performance
    next_row =  array.size(year_pnl) + 1

    if (disp_bench)

        table.cell(monthly_table, 0,  next_row, 'Bench', bgcolor=#999999)
        table.cell(monthly_table, 1,  next_row, 'Jan',   bgcolor=#999999)
        table.cell(monthly_table, 2,  next_row, 'Feb',   bgcolor=#999999)
        table.cell(monthly_table, 3,  next_row, 'Mar',   bgcolor=#999999)
        table.cell(monthly_table, 4,  next_row, 'Apr',   bgcolor=#999999)
        table.cell(monthly_table, 5,  next_row, 'May',   bgcolor=#999999)
        table.cell(monthly_table, 6,  next_row, 'Jun',   bgcolor=#999999)
        table.cell(monthly_table, 7,  next_row, 'Jul',   bgcolor=#999999)
        table.cell(monthly_table, 8,  next_row, 'Aug',   bgcolor=#999999)
        table.cell(monthly_table, 9,  next_row, 'Sep',   bgcolor=#999999)
        table.cell(monthly_table, 10, next_row, 'Oct',   bgcolor=#999999)
        table.cell(monthly_table, 11, next_row, 'Nov',   bgcolor=#999999)
        table.cell(monthly_table, 12, next_row, 'Dec',   bgcolor=#999999)
        table.cell(monthly_table, 13, next_row, ' ',     bgcolor = #999999)
        table.cell(monthly_table, 14, next_row, 'Year',  bgcolor=#999999)

        max_bench_abs_y = math.max(math.abs(array.max(bench_year_pnl)),  math.abs(array.min(bench_year_pnl)))
        max_bench_abs_m = math.max(math.abs(array.max(bench_month_pnl)), math.abs(array.min(bench_month_pnl)))

        for yi = 0 to array.size(year_time) - 1 by 1
            table.cell(monthly_table, 0,  yi + 1 + next_row + 1, str.tostring(year(array.get(year_time, yi))), bgcolor=#cccccc)
            table.cell(monthly_table, 13, yi + 1 + next_row + 1, ' ',   bgcolor=#999999)
            y_color = color.from_gradient(array.get(bench_year_pnl, yi), -max_bench_abs_y, max_bench_abs_y, loss_color, prof_color)
            table.cell(monthly_table, 14, yi + 1 + next_row + 1, str.tostring(math.round(array.get(bench_year_pnl, yi) * 100, prec)), bgcolor=y_color)

        for mi = 0 to array.size(month_time) - 1 by 1
            m_row = year(array.get(month_time, mi)) - year(array.get(year_time, 0)) + 1
            m_col = month(array.get(month_time, mi))
            m_color = color.from_gradient(array.get(bench_month_pnl, mi), -max_bench_abs_m, max_bench_abs_m, loss_color, prof_color)

            table.cell(monthly_table, m_col, m_row  + next_row + 1, str.tostring(math.round(array.get(bench_month_pnl, mi) * 100, prec)), bgcolor=m_color)

    // Fill Alpha
    if (disp_alpha)

        next_row :=  array.size(year_pnl) * 2 + 3
        table.cell(monthly_table, 0,  next_row, 'Alpha', bgcolor=#999999)
        table.cell(monthly_table, 1,  next_row, 'Jan',   bgcolor=#999999)
        table.cell(monthly_table, 2,  next_row, 'Feb',   bgcolor=#999999)
        table.cell(monthly_table, 3,  next_row, 'Mar',   bgcolor=#999999)
        table.cell(monthly_table, 4,  next_row, 'Apr',   bgcolor=#999999)
        table.cell(monthly_table, 5,  next_row, 'May',   bgcolor=#999999)
        table.cell(monthly_table, 6,  next_row, 'Jun',   bgcolor=#999999)
        table.cell(monthly_table, 7,  next_row, 'Jul',   bgcolor=#999999)
        table.cell(monthly_table, 8,  next_row, 'Aug',   bgcolor=#999999)
        table.cell(monthly_table, 9,  next_row, 'Sep',   bgcolor=#999999)
        table.cell(monthly_table, 10, next_row, 'Oct',   bgcolor=#999999)
        table.cell(monthly_table, 11, next_row, 'Nov',   bgcolor=#999999)
        table.cell(monthly_table, 12, next_row, 'Dec',   bgcolor=#999999)
        table.cell(monthly_table, 13, next_row, '',      bgcolor=#999999)
        table.cell(monthly_table, 14, next_row, 'Year',  bgcolor=#999999)

        max_alpha_abs_y = 0.0
        for yi = 0 to array.size(year_time) - 1 by 1
            if (math.abs(array.get(year_pnl, yi)  - array.get(bench_year_pnl, yi)) > max_alpha_abs_y)
                max_alpha_abs_y := math.abs(array.get(year_pnl, yi)  - array.get(bench_year_pnl, yi))

        max_alpha_abs_m = 0.0
        for mi = 0 to array.size(month_pnl) - 1 by 1
            if (math.abs(array.get(month_pnl, mi) - array.get(bench_month_pnl, mi)) > max_alpha_abs_m)
                max_alpha_abs_m := math.abs(array.get(month_pnl, mi) - array.get(bench_month_pnl, mi))

        for yi = 0 to array.size(year_time) - 1 by 1
            table.cell(monthly_table, 0,  yi + 1 + next_row + 1, str.tostring(year(array.get(year_time, yi))), bgcolor=#cccccc)
            table.cell(monthly_table, 13, yi + 1 + next_row + 1, ' ',   bgcolor=#999999)
            y_color = color.from_gradient(array.get(year_pnl, yi)  - array.get(bench_year_pnl, yi), -max_alpha_abs_y, max_alpha_abs_y, loss_color, prof_color)
            table.cell(monthly_table, 14, yi + 1 + next_row + 1, str.tostring(math.round((array.get(year_pnl, yi)  - array.get(bench_year_pnl, yi)) * 100, prec)), bgcolor=y_color)

        for mi = 0 to array.size(month_time) - 1 by 1
            m_row = year(array.get(month_time, mi)) - year(array.get(year_time, 0)) + 1
            m_col = month(array.get(month_time, mi))
            m_color = color.from_gradient(array.get(month_pnl, mi) - array.get(bench_month_pnl, mi), -max_alpha_abs_m, max_alpha_abs_m, loss_color, prof_color)

            table.cell(monthly_table, m_col, m_row  + next_row + 1, str.tostring(math.round((array.get(month_pnl, mi) - array.get(bench_month_pnl, mi)) * 100, prec)), bgcolor=m_color)