Bullische Ausbruchsstrategie basierend auf Bollinger Bands und VWAP

1
Follow
1782
Followers
Überblick
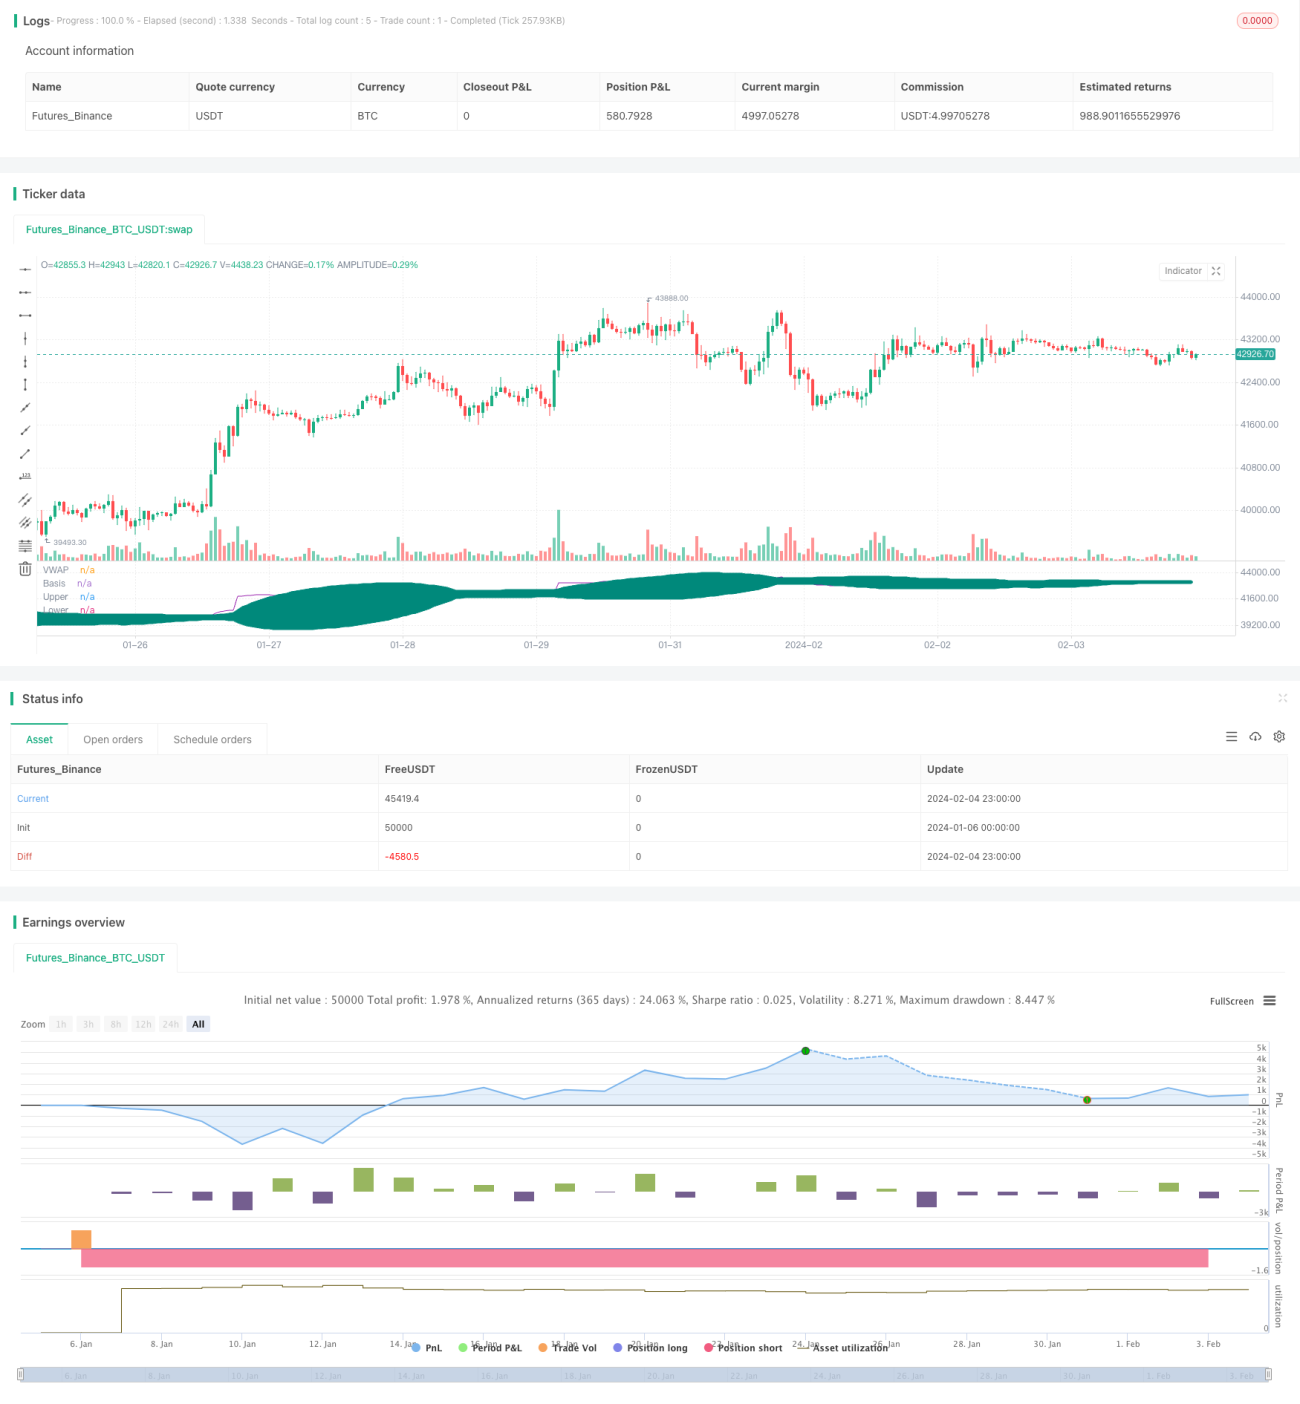
Die Strategie nutzt die Brin-Band-Indikatoren, um den VWAP zu verfolgen. Wenn der VWAP nach oben durch den Brin-Band geht, wird er als mehrköpfiger Durchbruch beurteilt. Wenn der VWAP nach unten durch den Brin-Band geht, wird er als leerer Durchbruch beurteilt.
Strategieprinzip
- Berechnung des VWAP.
- Berechnen Sie die Brin-Band für VWAP, die Oberbahn, Mittelbahn und Unterbahn umfasst.
- Beurteilen Sie, ob VWAP den Brin-Band-Mittelkurs nach oben durchbrechen wird, und wenn ja, gehen Sie mit einer Mehrkopfstrategie ein, wenn der Preis über dem Hauptstützpunkt Pivot Point liegt.
- Der Stop-Loss wurde auf 5% festgelegt.
- Wenn der VWAP nach unten durch die Brin-Band-Abfahrt geht, wird die Luftwaffe als bestätigt angesehen und die Position aufgelöst; wenn der Stoppschaden ausgelöst wird, wird auch die Position aufgelöst.
Analyse der Stärken
- VWAP verfügt über eine starke Trend-Tracking-Fähigkeit, kombiniert mit einem Brin-Band, der Trends präzise bestimmen kann.
- Das Hinzufügen von Pivot Points als zusätzliche Bedingung filtert viele falsche Durchbrüche und verhindert unnötige Verluste.
- Mit einer partiellen Ausstiegsstrategie können Sie einen Teil der Gewinne sperren und die Risiken kontrollieren.
- Die Rückmeldung ergab, dass die Strategie in den Bullenmärkten hervorragend funktioniert und eine hohe Stabilität aufweist.
Risikoanalyse
- In einem Schock kann es zu False Breaks kommen, die zu Verlusten führen.
- Pivot Points können nicht vollständig vor False Breaks bewahrt werden, sondern müssen mit weiteren Indikatoren kombiniert werden, um Filtersignale zu filtern.
- Ein Teil der Abwanderung erhöht die Häufigkeit der Operationen und erhöht die Transaktionskosten.
- In einem Bärenmarkt ist die Wirkung nicht optimal und es ist notwendig, die Risiken zu kontrollieren.
Optimierungsrichtung
- In Kombination mit anderen Indikatoren wie MACD, KDJ und anderen, kann die Filterung von Ein- und Ausstiegssignalen unterstützt werden.
- Die optimale Kombination von Parametern kann durch Optimierung der Längen und der Standardabweichung der Brin-Bänder gefunden werden.
- Eine dynamische Optimierung der Brin-Band-Parameter kann durch die Einführung von Machine-Learning-Algorithmen erreicht werden.
- Es ist möglich, verschiedene Stop-Loss-Levels zu testen, um die optimale Stop-Loss-Punkt zu finden.
- Es ist möglich, sich an einen Anpassungsmechanismus anzupassen, um die Zielgewinnspanne an die Marktschwankungen anzupassen.
Zusammenfassen
Diese Strategie ist insgesamt ein stabiles Durchbruchssystem. Die Standardisierungsmethode, die Optimierung der Parameter sind groß und eignen sich für quantitative Transaktionen. Gleichzeitig muss auf die Risikokontrolle und die Vermeidung von Verlusten durch außergewöhnliche Verhaltensweisen geachtet werden. Insgesamt ist es eine Strategie der Durchbruchart, die es wert ist, eingehend untersucht und kontinuierlich optimiert zu werden.
Source
Pine
Strategy parameters
Related strategies
Comment
All comments (0)
No data
- 1