Eine neue quantitative Handelsstrategie basierend auf dem ABCD-Muster mit Stop-Loss und Take-Profit-Trailing
1. Überblick über die Strategie
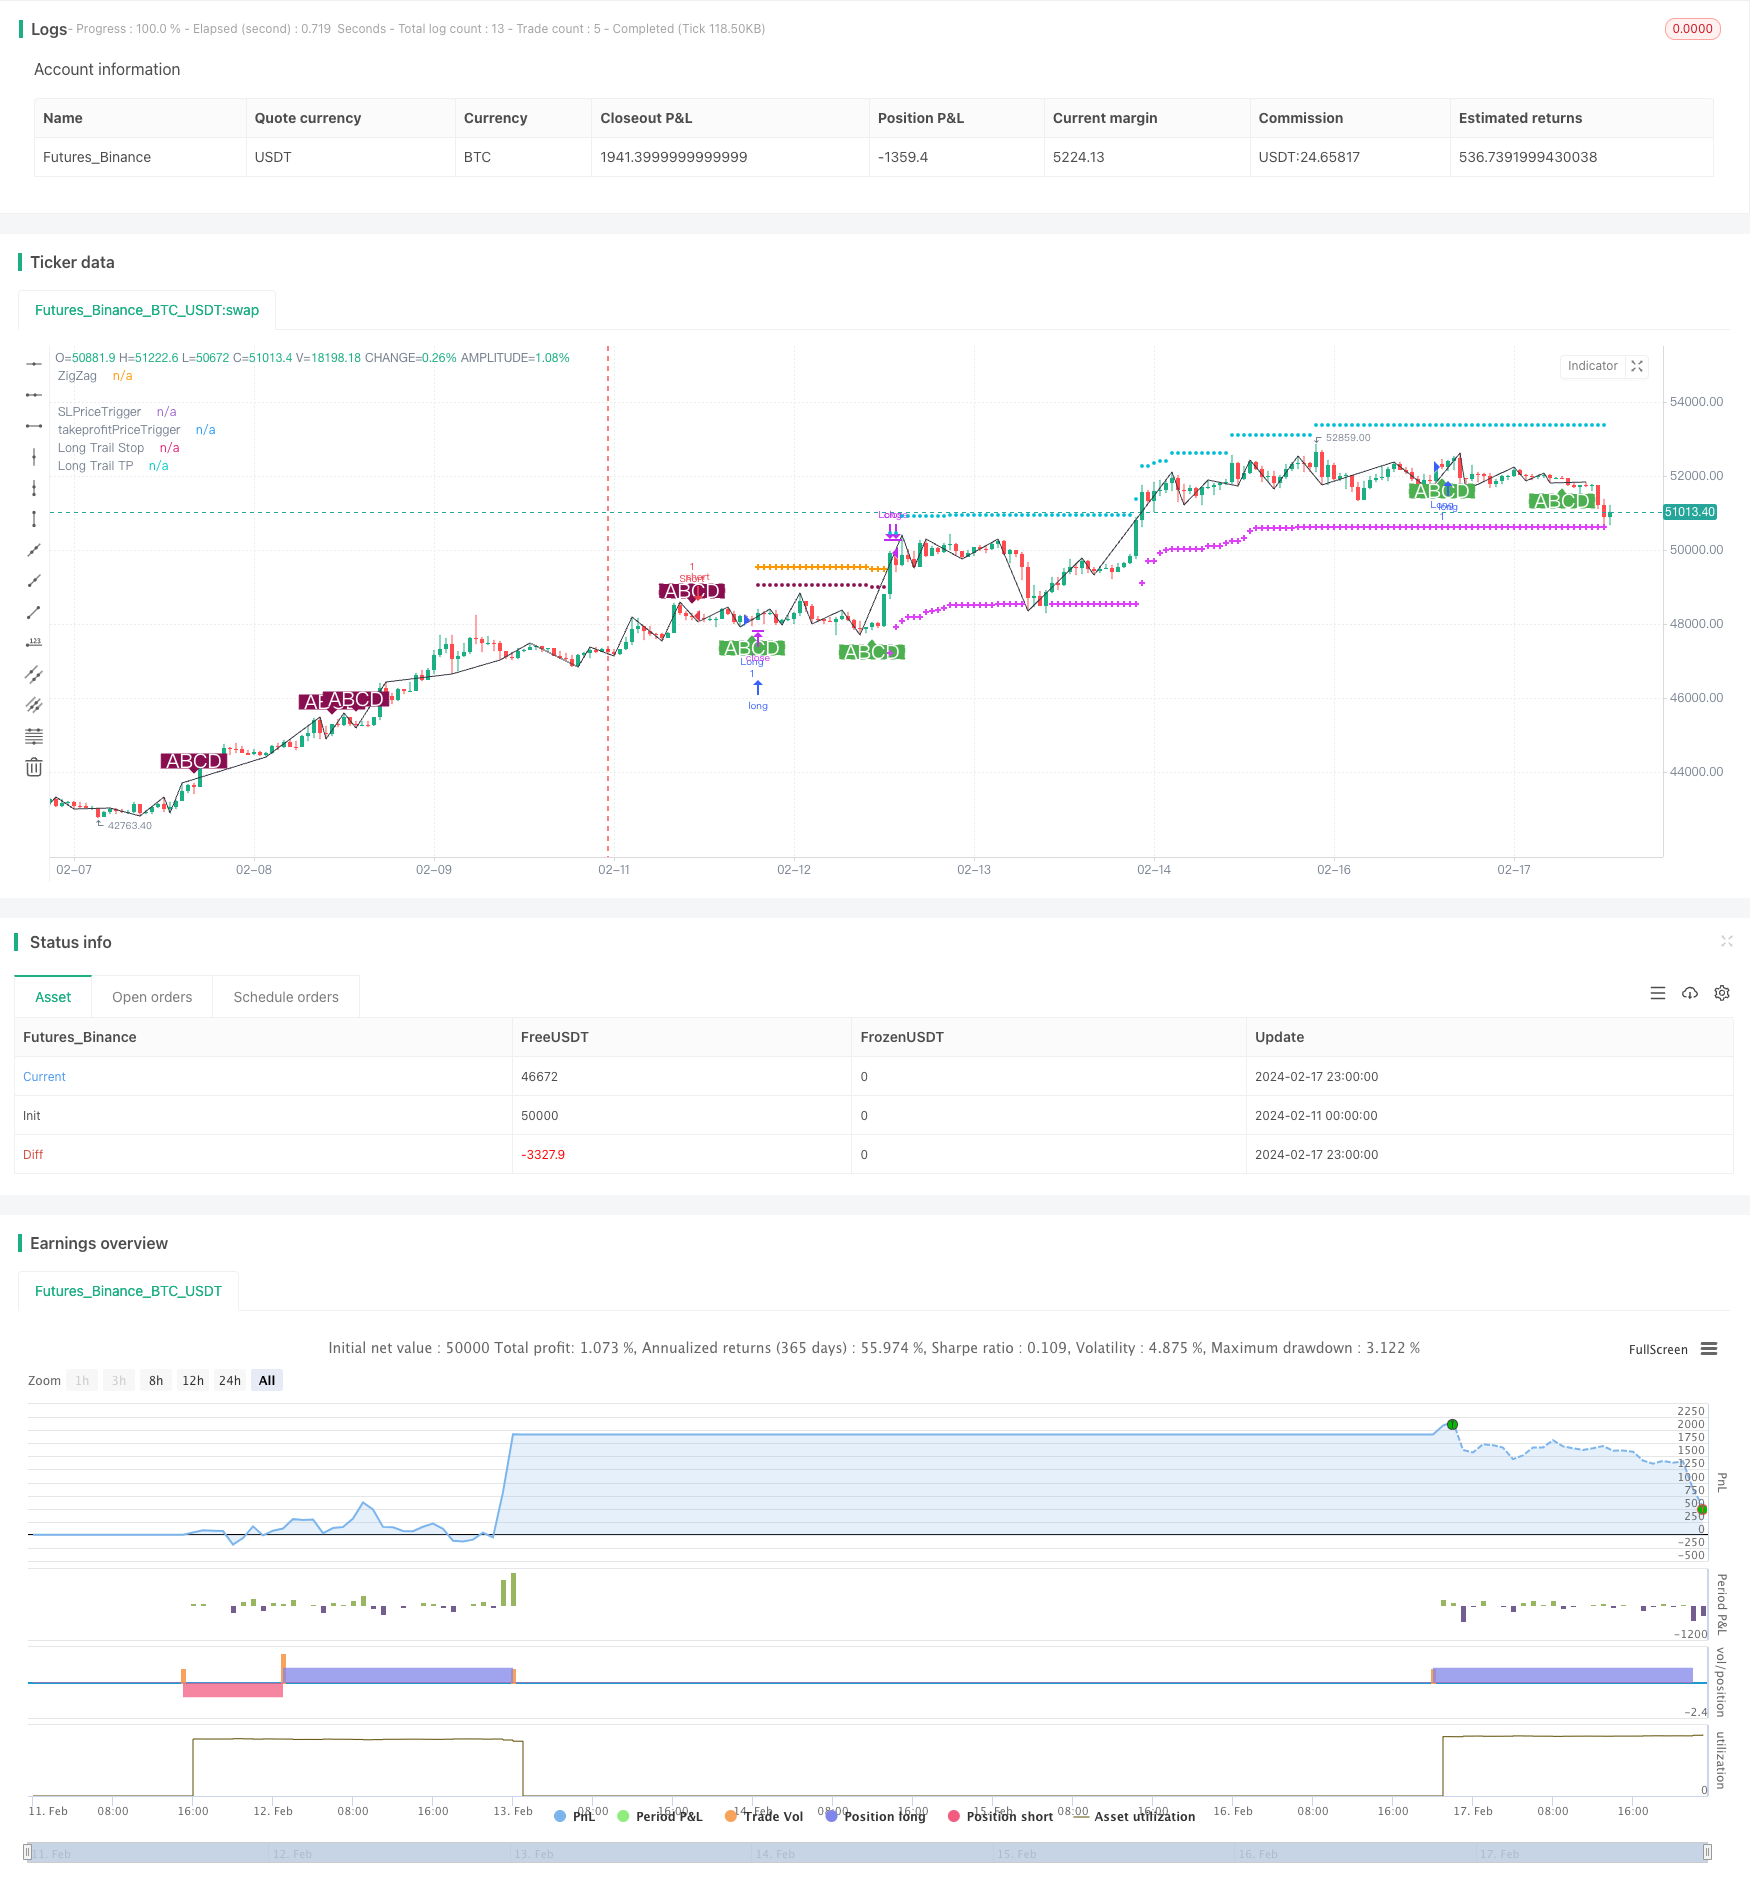
Die Strategie heißt Best ABCD-Form Trading Strategy (mit Stop-Loss-Tracking und Stop-Stop-Tracking). Es ist eine quantitative Strategie, bei der man auf Basis eines klaren ABCD-Preis-Form-Modells handeln kann. Die Hauptidee ist, nach der Identifizierung des vollständigen ABCD-Form-Modells, nach der Richtung der Form mehr Leerstellen zu machen und Stop-Loss- und Stop-Stop-Tracking einzurichten, um die Position zu verwalten.
2. Strategieprinzipien
Mit Hilfe der Brin-Hilfsentscheidung identifiziert man die oberen und unteren Trennpunkte des Preises und erhält die ZigZag-Kurve des Preises.
Um ein vollständiges ABCD-Form-Modell auf einer ZigZag-Kurve zu identifizieren, müssen die vier Punkte A, B, C und D eine bestimmte Proportionsbeziehung erfüllen. Nach der Identifizierung eines geeigneten ABCD-Forms wird über- oder unterholt.
Setzen Sie nach mehreren Leerlässen eine Stop-Loss-Verfolgung ein, um das Risiko zu kontrollieren. Der Stop-Loss wird zu Beginn des Stopps verwendet, und wenn der Gewinn einen bestimmten Prozentsatz erreicht, wird er in einen mobilen Stop-Loss umgewandelt, um einen Teil des Gewinns zu sperren.
Ebenso gibt es eine Tracking-Einstellung für die Stop-Stop-Linie, um eine rechtzeitige Stop-Stop zu vermeiden, wenn genügend Profit erzielt wurde. Die Stop-Stop-Verfolgung ist auch in zwei Phasen unterteilt, zuerst mit einem festen Stop-Stop, um einen Teil des Profits zu erzielen, und dann zu einem mobilen Stop, um den Preis weiter zu verfolgen.
Wenn der Preis einen beweglichen Stop-Loss oder einen Stop-Stop auslöst, platzieren Sie die Position und beenden Sie einen Handelszyklus.
Drei: Analyse der strategischen Stärken
Die Verwendung von Brin-unterstützten Beurteilungsmethoden zur Identifizierung von ZigZag-Kurven vermeidet die Rückwärtsprobleme der traditionellen ZigZag-Kurve und macht die Handelssignale zuverlässiger.
Die ABCD-Form-Trading-Modelle ist ausgereift und stabil, die Handelsmöglichkeiten sind reichlich vorhanden. Die ABCD-Form-Richtung ist klar und leicht zu beurteilen, in welche Richtung die Markteinführung geht.
Die Einrichtung eines zweistufigen Stop-Loss-Trackers ermöglicht eine bessere Risikokontrolle und Gewinngewinnung. Die mobile Stop-Loss-Strap ermöglicht eine flexiblere Anpassung der Strategie.
Die Strategieparameter sind vernünftig ausgelegt, die Stop-Loss-Stop-Prozentsätze und die Mobile-Start-Prozentsätze können individuell angepasst werden und sind flexibel zu bedienen.
Die Strategie kann für jede Sorte verwendet werden, einschließlich Devisen, Kryptowährungen und Aktienindizes.
4. Strategische Risikoanalyse
Die ABCD-Form ist zwar eindeutiger, aber die Handelsmöglichkeiten sind relativ begrenzt und garantieren keine ausreichende Handelsfrequenz.
In einem Erschütterungsfall kann es zu einer häufigen Auslösung des Schadensstopps kommen. In diesem Fall müssen die Parameter entsprechend angepasst und der Schadensstoppspanne erweitert werden.
Es ist wichtig, die Liquidität der Handelsvarianten selbst zu beachten. Bei schlechter Liquidität sind die Stop-Loss-Stopps schwierig, genau umzusetzen.
Die Strategie ist auf die Transaktionskosten empfindlich und erfordert die Auswahl von Brokern und Konten mit niedrigen Gebühren.
Einige Parameter können weiter optimiert werden, z. B. die Startbedingungen für die Bewegung von Stop-and-Stop-Stufen können mehr getestet werden, um die optimale Punktposition zu finden.
Fünftens: Strategische Optimierung
Es können weitere Filterbedingungen in Verbindung mit anderen Kennzahlen eingerichtet werden, um einen Teil der HW-Form zu vermeiden. Dies kann die Invalidität von Geschäften verringern.
Erhöhung der Beurteilung der dreisegmentalen Struktur des Marktes und Suche nach Handelsmöglichkeiten nur im dritten Segment. Dies erhöht die Strategiegewinnquote.
Tests zur Optimierung der Größe des Startkapitals, um die optimale Größe des Startkapitals zu finden.
Es ist notwendig, die langfristige Stabilität der Strategie zu beherrschen.
Weiterhin optimieren Sie die mobilen Stop/Stop-Beginn-Bedingungen und die Größe der Schiebepunkte, um die Effizienz der Strategie-Ausführung zu verbessern. SETTINGS-Optimierung ist endlos.
6. Zusammenfassung der Strategie
Die Strategie beruht hauptsächlich auf der Preisform ABCD für die Beurteilung und Markteinführung. Es wurde ein zweistufiger Stop-Loss-Tracking eingerichtet, um Risiken und Gewinne zu verwalten. Die Strategie ist stabil, aber die Handelsfrequenz ist möglicherweise niedrig.
/*backtest
start: 2024-02-11 00:00:00
end: 2024-02-18 00:00:00
period: 1h
basePeriod: 15m
exchanges: [{"eid":"Futures_Binance","currency":"BTC_USDT"}]
*/

// @version=4
// @author=Daveatt - BEST

// ABCD Pattern Strat

StrategyName        = "BEST ABCD Pattern Strategy (Trailing SL + TP)"
ShortStrategyName   = "BEST ABCD Strategy (Trailing)"

strategy(title=StrategyName, shorttitle=ShortStrategyName, overlay=true )

filterBW = input(false, title="filter Bill Williams Fractals?")

///////////////////////////////////////////////////////////////////////////////
///////////////////////////////////////////////////////////////////////////////
///////////////////////////////// UTILITIES ///////////////////////////////////
///////////////////////////////////////////////////////////////////////////////
///////////////////////////////////////////////////////////////////////////////

//  ||-----------------------------------------------------------------------------------------------------||
//  ||---   Fractal Recognition Functions:  ---------------------------------------------------------------||
isRegularFractal(mode, _high, _low) =>
    ret = mode == 1 ? _high[4] < _high[3] and _high[3] < _high[2] and _high[2] > _high[1] and _high[1] > _high[0] :
     mode == -1 ? _low[4] > _low[3] and _low[3] > _low[2] and _low[2] < _low[1] and _low[1] < _low[0] : false

isBWFractal(mode, _high, _low) =>
    ret = mode == 1 ? _high[4] < _high[2] and _high[3] <= _high[2] and _high[2] >= _high[1] and _high[2] > _high[0] :
     mode == -1 ? _low[4] > _low[2] and _low[3] >= _low[2] and _low[2] <= _low[1] and _low[2] < _low[0] : false

///////////////////////////////////////////////////////////////////////////////
///////////////////////////////////////////////////////////////////////////////
////////////////////////////// ABCD PATTERN ///////////////////////////////////
///////////////////////////////////////////////////////////////////////////////
///////////////////////////////////////////////////////////////////////////////

f_abcd()=>

    _r = timeframe.period
    _g = barmerge.gaps_off
    _l = barmerge.lookahead_on

    _high = high
    _low = low

    filteredtopf = filterBW ? isRegularFractal(1, _high, _low) : isBWFractal(1, _high, _low)
    filteredbotf = filterBW ? isRegularFractal(-1, _high, _low) : isBWFractal(-1, _high, _low)

    //  ||---   ZigZag:
    istop = filteredtopf
    isbot = filteredbotf
    topcount = barssince(istop)
    botcount = barssince(isbot)

    zigzag = (istop and topcount[1] > botcount[1] ? _high[2] :
     isbot and topcount[1] < botcount[1] ? _low[2] : na)

    x = valuewhen(zigzag, zigzag, 4)
    a = valuewhen(zigzag, zigzag, 3)
    b = valuewhen(zigzag, zigzag, 2)
    c = valuewhen(zigzag, zigzag, 1)
    d = valuewhen(zigzag, zigzag, 0)

    xab = (abs(b-a)/abs(x-a))
    xad = (abs(a-d)/abs(x-a))
    abc = (abs(b-c)/abs(a-b))
    bcd = (abs(c-d)/abs(b-c))

    // ABCD Part
    _abc = abc >= 0.382 and abc <= 0.886
    _bcd = bcd >= 1.13 and bcd <= 2.618

    _bull_abcd = _abc and _bcd and d < c
    _bear_abcd = _abc and _bcd and d > c

    _bull   = _bull_abcd and not _bull_abcd[1]
    _bear   = _bear_abcd and not _bear_abcd[1]

    [_bull, _bear, zigzag]

lapos_x = timenow + round(change(time)*12)

[isLong, isShort, zigzag]  = f_abcd()

plot(zigzag, title= 'ZigZag', color=color.black, offset=-2)
plotshape(isLong, style=shape.labelup, location=location.belowbar, color=color.new(color.green, 0), size=size.normal, text="ABCD", textcolor=color.white)
plotshape(isShort, style=shape.labeldown, location=location.abovebar, color=color.new(color.maroon, 0), size=size.normal, text="ABCD", textcolor=color.white)


long_entry_price    = valuewhen(isLong, close, 0)
short_entry_price   = valuewhen(isShort, close, 0)

sinceNUP = barssince(isLong)
sinceNDN = barssince(isShort)

buy_trend   = sinceNDN > sinceNUP
sell_trend  = sinceNDN < sinceNUP

change_trend = (buy_trend and sell_trend[1]) or (sell_trend and buy_trend[1])

entry_price  = buy_trend ? long_entry_price : short_entry_price

///////////////////////////////
//======[ Trailing STOP ]======//
///////////////////////////////

// use SL?
useSL = input(true, "Use stop Loss")
// Configure trail stop level with input
StopTrailPerc = input(title="Trail Loss (%)", type=input.float, minval=0.0, step=0.1, defval=3) * 0.01
// Will trigger the take profit trailing once reached
use_SL_Trigger = input(true, "Use stop Loss Trigger")
StopTrailTrigger   = input(2.0, "SL Trigger (%)",minval=0,step=0.5,type=input.float) * 0.01


StopLossPriceTrigger = 0.0
StopLossPriceTrigger := if (use_SL_Trigger)
    if buy_trend
        entry_price * (1 + StopTrailTrigger)
    else
        entry_price * (1 - StopTrailTrigger)
else
    -1


var SL_Trigger_Long_HIT = false
SL_Trigger_Long_HIT := useSL and use_SL_Trigger and buy_trend and high >= StopLossPriceTrigger
 ? true : SL_Trigger_Long_HIT[1]


var SL_Trigger_Short_HIT = false
SL_Trigger_Short_HIT := useSL and use_SL_Trigger and sell_trend and low <= StopLossPriceTrigger
 ? true : SL_Trigger_Short_HIT[1]


display_long_SL_trigger     = useSL and buy_trend  and use_SL_Trigger
 and SL_Trigger_Long_HIT == false and StopLossPriceTrigger != -1
display_short_SL_trigger    = useSL and sell_trend and use_SL_Trigger
 and SL_Trigger_Short_HIT == false and StopLossPriceTrigger != -1
display_SL_trigger          = display_long_SL_trigger or display_short_SL_trigger

plot(display_SL_trigger ? StopLossPriceTrigger : na, title='SLPriceTrigger', transp=0,
 color=color.maroon, style=plot.style_circles, linewidth=3)


// Determine trail stop loss prices
longStopPrice = 0.0, shortStopPrice = 0.0

longStopPrice := if useSL and buy_trend
    stopValue = low * (1 - StopTrailPerc)
    max(stopValue, longStopPrice[1])
else
    0

shortStopPrice := if useSL and sell_trend
    stopValue = high * (1 + StopTrailPerc)
    min(stopValue, shortStopPrice[1])
else
    999999

//////////////////////////////////////////////////////////////////////////////////////////
//*** STOP LOSS HIT CONDITIONS  ***//
//////////////////////////////////////////////////////////////////////////////////////////

cond_long_stop_loss_hit  = useSL and buy_trend and crossunder(low, longStopPrice[1])
 and (SL_Trigger_Long_HIT or use_SL_Trigger == false)
cond_short_stop_loss_hit = useSL and sell_trend and crossover(high, shortStopPrice[1])
 and (SL_Trigger_Short_HIT or use_SL_Trigger == false)


// Plot stop loss values for confirmation
plot(series=useSL and buy_trend and low >= longStopPrice
 and (SL_Trigger_Long_HIT or use_SL_Trigger == false)
 ? longStopPrice : na,
 color=color.fuchsia, style=plot.style_cross,
 linewidth=2, title="Long Trail Stop")

plot(series=useSL and sell_trend and high <= shortStopPrice
 and (SL_Trigger_Short_HIT or use_SL_Trigger == false)
 ? shortStopPrice : na,
 color=color.fuchsia, style=plot.style_cross,
 linewidth=2, title="Short Trail Stop")


///////////////////////////////
//======[ Take Profit ]======//
///////////////////////////////

// Use TP?
useTP = input(true, "Use take profit")
// TP trailing
ProfitTrailPerc     = input(1.0, "Trailing Profit (%)",minval=0,step=0.5,type=input.float) * 0.01

use_TP_Trigger = input(true, "Use Take Profit Trigger")
// Will trigger the take profit trailing once reached
takeProfitTrigger   = input(3.0, "Take Profit Trigger (%)",minval=0,step=0.5,type=input.float) * 0.01


// ttp := ttp>tp ? tp : ttp

takeprofitPriceTrigger = 0.0
takeprofitPriceTrigger := if (use_TP_Trigger)
    if (buy_trend)
        entry_price * (1 + takeProfitTrigger)
    else
        entry_price * (1 - takeProfitTrigger)
else
    -1

//plot(entry_price, title='entry_price', transp=100)

var TP_Trigger_Long_HIT = false
TP_Trigger_Long_HIT := useTP and use_TP_Trigger and buy_trend and high >= takeprofitPriceTrigger
 ? true : TP_Trigger_Long_HIT[1]


var TP_Trigger_Short_HIT = false
TP_Trigger_Short_HIT := useTP and use_TP_Trigger and sell_trend and low <= takeprofitPriceTrigger
 ? true : TP_Trigger_Short_HIT[1]


display_long_TP_trigger     = useTP and buy_trend  and TP_Trigger_Long_HIT == false
 and takeprofitPriceTrigger != -1
display_short_TP_trigger    = useTP and sell_trend and TP_Trigger_Short_HIT == false
 and takeprofitPriceTrigger != -1
display_TP_trigger          = display_long_TP_trigger or display_short_TP_trigger


//🔷🔷🔷
// @hugo: Will display the TP trigger as long as not hit
// once the TP trigger is hit, the TP trailing will activate
plot(display_TP_trigger ? takeprofitPriceTrigger : na, title='takeprofitPriceTrigger', transp=0, color=color.orange,
 style=plot.style_cross, linewidth=3)

longTrailTP= 0.0, shortTrailTP = 0.0

// Trailing Profit
// Start trailing once trigger is reached
longTrailTP := if useTP and buy_trend
    tpValue = high * (1 + ProfitTrailPerc)
    max(tpValue, longTrailTP[1])
else
    0

shortTrailTP := if useTP and sell_trend
    tpValue = low * (1 - ProfitTrailPerc)
    min(tpValue, shortTrailTP[1])
else
    999999

//plot(longTrailTP, title='debug longTrailTP', transp=100)
//plot(shortTrailTP, title='debug shortTrailTP', transp=100)

//////////////////////////////////////////////////////////////////////////////////////////
//*** TRAILING TAKE PROFIT HIT CONDITIONS TO BE USED IN ALERTS  ***//
//////////////////////////////////////////////////////////////////////////////////////////


//🔷🔷🔷
// @hugo: I use crossover/crossunder for the alerts to trigger the events only once
cond_long_trail_tp_hit      = useTP and buy_trend   and crossover(high, longTrailTP[1])
 and (TP_Trigger_Long_HIT or use_TP_Trigger == false)
cond_short_trail_tp_hit     = useTP and sell_trend  and crossunder(low, shortTrailTP[1])
 and (TP_Trigger_Short_HIT or use_TP_Trigger == false)
// 🔷🔷🔷


// Plot take profits values for confirmation
// Display the trailing TP until not hit
plot(series= useTP and buy_trend and high <= longTrailTP and
 (TP_Trigger_Long_HIT or use_TP_Trigger == false) ? longTrailTP : na,
 color=color.aqua, style=plot.style_circles,
 linewidth=2, title="Long Trail TP")

plot(series= useTP and sell_trend and low >= shortTrailTP and
 (TP_Trigger_Short_HIT or use_TP_Trigger == false) ? shortTrailTP : na,
 color=color.aqua, style=plot.style_circles,
 linewidth=2, title="Short Trail TP")

close_long  = cond_long_trail_tp_hit or cond_long_stop_loss_hit
close_short = cond_short_trail_tp_hit or cond_short_stop_loss_hit


strategy.entry("Long", 1, when=isLong)
strategy.close("Long", when=close_long)

strategy.entry("Short", 0,  when=isShort)
strategy.close("Short", when=close_short)

if change_trend
    SL_Trigger_Long_HIT := false
    SL_Trigger_Short_HIT := false
    TP_Trigger_Long_HIT := false
    TP_Trigger_Short_HIT := false