Ichimoku Kinko Hyo + Shift Trend Superposition Quantitative Strategie
Überblick
Die Strategie verwendet eine Kombination aus einem Gleichgewichts- und einem Bewegungs-Überlagerungs-Indikator, um potenzielle Trends in den Aktienpreisen zu erkennen und zu entscheiden, wann man kaufen und verkaufen soll. Die Strategie bestimmt die Trendrichtung und sendet Handelssignale durch die Berechnung einer Gleichgewichtslinie in Kombination mit einem Bewegungs-Überlagerungs-Indikator, während der RSI-Indikator verwendet wird, um das Handelsrisiko zu kontrollieren.
Strategieprinzip
Die Strategie besteht aus drei Teilen:
Einseitige Gleichgewichtslinie: Einseitige Gleichgewichtslinie besteht hauptsächlich aus zwei Linien, die den Wechselpunkt ((Tenkan-Sen) und den Bezugspunkt ((Kijun-sen) bilden, um eine Form von Gleichgewichtslinie zu bilden. Die Wechselpunktlinie stellt die kurzfristige Tendenz des Preises dar, die Bezugspunktlinie die mittelfristige Tendenz des Preises.
Die Bewegungsüberschneidung: Die Bewegungsüberschneidung beurteilt die Richtung des Trends durch die Berechnung der Abweichung der Relativitätsbandbreite und der Relativität des Gleitens. Es wird ein Handelssignal erzeugt, wenn der Preis aus dem äußeren Bereich in den mittleren Bereich eintritt.
RSI-Indikator: Der RSI-Indikator wird verwendet, um zu bestimmen, ob der Preis überschritten oder überverkauft ist. Er setzt eine Überkauflinie und einen Überverkaufsraum ein, um in Verbindung mit einem Überschneidungsindikator ein Kauf- und Verkaufssignal zu ermitteln.
Konkret überwacht die Strategie, ob eine Gold- und eine Dead-Fork zwischen der Trend- und der Benchmark-Punktlinie auftritt, um zu entscheiden, ob ein Kauf oder ein Verkauf stattfindet. In Kombination mit einer Überlagerung der Bewegung wird die Gesamttrendrichtung bestimmt. Wenn beide Indikatoren gleichzeitig signalisieren, wird ein Handelssignal ausgegeben, wenn der RSI-Indikator zeigt, dass kein Überkauf oder Überverkauf stattfindet.
Strategische Vorteile
Diese Strategie kombiniert die Verwendung verschiedener Indikatoren, um die Richtung der Trends zu bestimmen und die Zeit des Handels zu bestimmen, um die Genauigkeit der Beurteilung zu verbessern und die Kompensationsvorteile zwischen den Indikatoren zu nutzen, um die Wahrscheinlichkeit einer Fehleinschätzung durch einen einzelnen Indikator zu vermeiden. Die konkreten Vorteile sind wie folgt:
Die Verwendung von Wendepunkten und Referenzpunkten als Gleichgewichtsindikatoren kann sowohl kurzfristige als auch mittelfristige Trends widerspiegeln und die Genauigkeit eines einzelnen MA-Indikators erhöhen.
Die Bewegungsüberschneidung ist ein sehr zuverlässiges Mittel zur Bestimmung der Gesamttrendrichtung und ergänzt die Gleichgewichtsindikatoren.
Der RSI-Indikator setzt Filterbedingungen, die Falschbrüche wirksam filtern und Handelsrisiken vermeiden.
Die Strategie ist einfach zu verstehen und zu implementieren und eignet sich für quantitative Transaktionen.
Strategisches Risiko
Obwohl die Strategie mit mehreren Indikatoren zusammenarbeitet, um die Wahrscheinlichkeit von Fehleinschätzungen zu reduzieren, bestehen folgende Hauptrisiken:
Risiken bei der Parameter-Einstellung. Fehleinstellung von Parametern für Indikatoren wie die Verlagungs- und die Benchmark-Punktlinie führt zu falschen Handelssignalen. Die Parameter müssen optimiert werden, um sie an die verschiedenen Sorten anzupassen.
Trendwechselrisiko. Bei einer Verschiebung kann ein falsches Signal erzeugt werden. Ein Trendwechselsignal muss mit mehr Indikatoren kombiniert werden.
Die RSI-Filterbedingungen sind zu streng. Es besteht die Gefahr, dass mehr Handelsmöglichkeiten ausgeschaltet werden. Die Parameter des RSI können entsprechend gelockert werden.
Entsprechende Lösungen:
Die Parameter werden mit mehr historischen Daten für verschiedene Sorten optimiert, um sicherzustellen, dass die Parameter angemessen eingestellt werden.
Ein Stop-Loss-Mechanismus in die Strategie aufzunehmen. Beenden Sie Ihre Position, wenn der Preis die Stop-Loss-Linie in die entgegengesetzte Richtung durchbricht.
Optimierung der Parameter des RSI, angemessene Lockerung der Filterbedingungen, um mehr Handelsmöglichkeiten zu erhalten, unter der Voraussetzung, dass die Risiken kontrolliert werden.
Richtung der Strategieoptimierung
Es gibt weitere Optimierungsmöglichkeiten für diese Strategie:
Die Erweiterung der Algorithmen des maschinellen Lernens, um die Strategieparameter dynamisch an Marktveränderungen anzupassen und die Strategieadaptivität zu verbessern.
Das Paketieren von Strategie-Komponenten in Module zur modularen Verwaltung, um die Komponenten schnell zu ersetzen oder einzeln zu testen und zu optimieren, verbessert die Entwicklungseffizienz.
Erhöhung der Datenintegrationsmodule, Markteinflüsse aus mehreren Datenquellen, Bildung von qualitativ hochwertigen Trainingssets und Verbesserung der Effekte des maschinellen Lernens
Die Entwicklung von Rückmeldungstools zur umfassenden Rückmeldung der Strategie, zur Erfassung verschiedener Bewertungsindikatoren, zur Unterstützung der Optimierung von Parameteranpassungen und der Modellwahl.
Strategie-Systeme mit Cloud-Plattformen, schnelle parallele Rückmeldung mit flexiblen Rechenressourcen, beschleunigte Parameter-Optimierung und reduzierte Kosten für die Strategieentwicklung.
Zusammenfassen
Die Strategie nutzt ein Gleichgewichtsindikator und einen Bewegungsüberlagerungsindikator, um die Preisentwicklung und die Handelszeit zu bestimmen. Die RSI-Indikatoren werden zur Filterung und zur Kontrolle des Handelsrisikos verwendet. Diese Form der Strategie mit mehreren Indikatoren kann die Richtigkeit der Beurteilung verbessern und bessere Strategieeffekte erzielen.
/*backtest
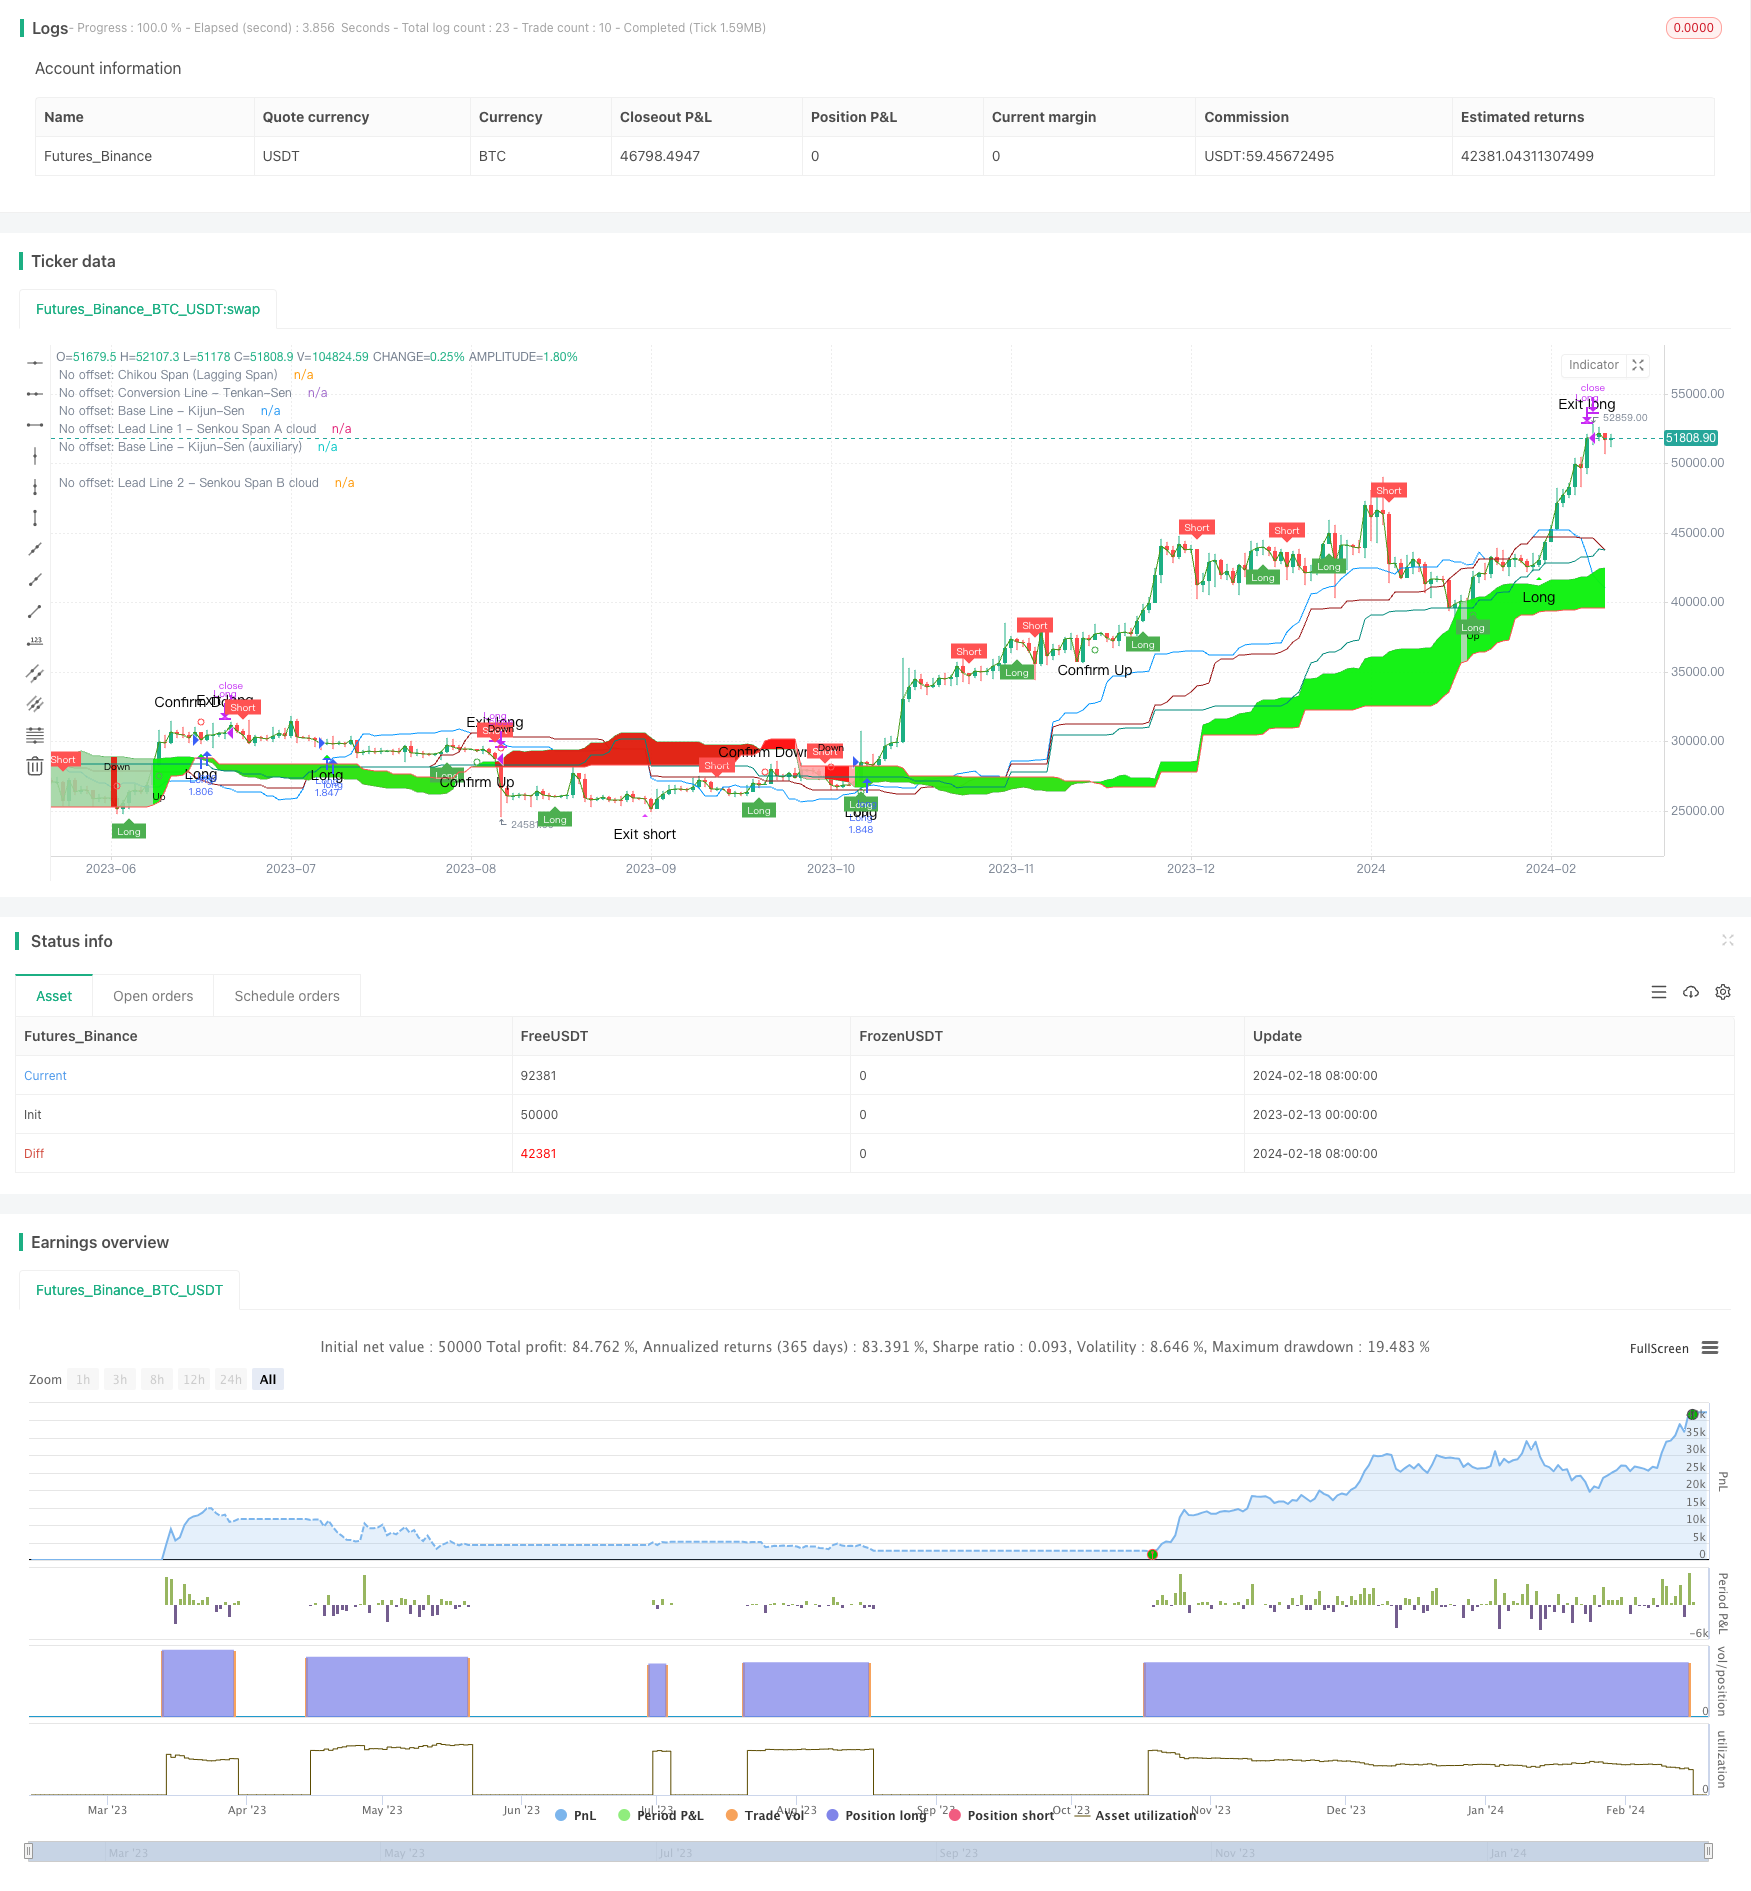
start: 2023-02-13 00:00:00
end: 2024-02-19 00:00:00
period: 1d
basePeriod: 1h
exchanges: [{"eid":"Futures_Binance","currency":"BTC_USDT"}]
*/
// This source code is subject to the terms of the Mozilla Public License 2.0 at https://mozilla.org/MPL/2.0/
// © KryptoNight
//@version=4
// comment/uncomment Study/Strategy to easily switch modes
// study("Ichimoku Kinko Hyo Cloud - no offset - no repaint - RSI filter - alerts", shorttitle="IchiCloud + RSI - alerts", overlay=true)
// ============================================================================== Strategy mode - uncomment to activate
strategy("Ichimoku Kinko Hyo Cloud - no offset - no repaint - RSI filter - strategy", shorttitle="IchiCloud + RSI - Strategy Tester Mode", overlay=true, pyramiding = 0,
currency = currency.EUR, initial_capital = 2000, default_qty_type = strategy.percent_of_equity, default_qty_value = 100,
calc_on_every_tick = true, calc_on_order_fills = true, commission_type = strategy.commission.percent, commission_value = 0.15)
// ==============================================================================
// ------------------------------------------------------------------------------
ichiCloud_offset = input(false, title="Standard Ichimoku Cloud") // with the visual offset
ichiCloud_noOffset = input(true, title="Ichimoku Cloud - no offset - no repaint") // without the visual offset
conversion_prd = input(9, minval=1, title="Conversion Line Period - Tenkan-Sen")
baseline_prd = input(27, minval=1, title="Base Line Period - Kijun-Sen")
baselineA_prd = input(52, minval=1, title="Base Line Period - Kijun-Sen (auxiliary)")
leadingSpan_2prd = input(52, minval=1, title="Lagging Span 2 Periods - Senkou Span B")
displacement = input(26, minval=0, title="Displacement: (-) Chikou Span; (+) Senkou Span A")
extra_bars = input(1, minval=0, title="Displacement: additional bars")
laggingSpan_src = input(close, title="Lagging Span price source - Chikou-Span")
donchian(len) => avg(lowest(len), highest(len))
displ = displacement-extra_bars
// ------------------------------------------------------------------------------
// OFFSET:
conversion = donchian(conversion_prd) // Conversion Line - Tenkan-Sen (9 Period)
baseline = donchian(baseline_prd) // Base Line - Kijun-Sen (26 Period)
baselineA = donchian(baselineA_prd) // Base Line Period - Kijun-Sen (auxiliary)
leadingSpanA = avg(conversion, baseline)
leadingSpanB = donchian(leadingSpan_2prd)
laggingSpan = laggingSpan_src
// Color - bullish, bearish
col_cloud = leadingSpanA>=leadingSpanB ? color.green : color.red
// Cloud Lines
spanA = plot(ichiCloud_offset? leadingSpanA : na, offset=displ, title="Offset: Lead Line 1 - Senkou Span A cloud", color=color.green)
spanB = plot(ichiCloud_offset? leadingSpanB : na, offset=displ, title="Offset: Lead Line 2 - Senkou Span B cloud", color=color.red)
fill(spanA, spanB, color=col_cloud, transp=80, title="Offset: Ichimoku Cloud - Leading Span 1 & 2 based coloring")
// Other Lines
conversion_p = plot(ichiCloud_offset? conversion : na, title="Offset: Conversion Line - Tenkan-Sen", color=#0496ff)
standard_p = plot(ichiCloud_offset? baseline : na, title="Offset: Base Line - Kijun-Sen", color=#991515)
standardA_p = plot(ichiCloud_offset? baselineA : na, title="Offset: Base Line - Kijun-Sen (auxiliary)", color=color.teal)
lagging_Span_p = plot(ichiCloud_offset? laggingSpan : na, offset=-displ, title="Offset: Chikou Span (Lagging Span)", color=#459915)
// ------------------------------------------------------------------------------
// NO OFFSET:
conversion_noOffset = conversion[displ] // Conversion Line - Tenkan-Sen (9 Period)
baseline_noOffset = baseline[displ] // Base Line - Kijun-Sen (26 Period)
baselineA_noOffset = baselineA[displ] // Base Line Period - Kijun-Sen (auxiliary)
leadingSpanA_noOffset = leadingSpanA[displ*2]
leadingSpanB_noOffset = leadingSpanB[displ*2]
laggingSpan_noOffset = laggingSpan[0]
// Color - bullish, bearish
col_cloud_noOffset = leadingSpanA_noOffset>=leadingSpanB_noOffset ? color.green : color.red
// Cloud Lines
spanA_noOffset = plot(ichiCloud_noOffset? leadingSpanA_noOffset : na, title="No offset: Lead Line 1 - Senkou Span A cloud", color=color.green, transp=0)
spanB_noOffset = plot(ichiCloud_noOffset? leadingSpanB_noOffset : na, title="No offset: Lead Line 2 - Senkou Span B cloud", color=color.red, transp=0)
fill(spanA_noOffset, spanB_noOffset, color=col_cloud_noOffset, transp=80, title="No offset: Ichimoku Cloud - Leading Span 1 & 2 based coloring")
// Other Lines
conversion_p_noOffset = plot(ichiCloud_noOffset? conversion_noOffset : na, title="No offset: Conversion Line - Tenkan-Sen", color=#0496ff, transp=0)
baseline_p_noOffset = plot(ichiCloud_noOffset? baseline_noOffset : na, title="No offset: Base Line - Kijun-Sen", color=#991515, transp=0)
baselineA_p_noOffset = plot(ichiCloud_noOffset? baselineA_noOffset : na, title="No offset: Base Line - Kijun-Sen (auxiliary)", color=color.teal, transp=0)
laggingSpan_p_noOffset = plot(ichiCloud_noOffset? laggingSpan_noOffset : na, title="No offset: Chikou Span (Lagging Span)", color=#459915, transp=0)
// ==============================================================================
// Conditions & Alerts (based on the lines without offset)
maxC = max(leadingSpanA_noOffset,leadingSpanB_noOffset)
minC = min(leadingSpanA_noOffset,leadingSpanB_noOffset)
// Trend start signals: crosses between Chikou Span (Lagging Span) and the Cloud (Senkou Span A, Senkou Span B)
uptrend_start = crossover(laggingSpan_noOffset,maxC)
downtrend_start = crossunder(laggingSpan_noOffset,minC)
// Trends
uptrend = laggingSpan_noOffset>maxC // Above Cloud
downtrend = laggingSpan_noOffset<minC // Below Cloud
// No trend: choppy trading - the price is in transition
notrend = maxC>=laggingSpan_noOffset and laggingSpan_noOffset>=minC
// Confirmations
uptrend_confirm = crossover(leadingSpanA_noOffset,leadingSpanB_noOffset)
downtrend_confirm = crossunder(leadingSpanA_noOffset,leadingSpanB_noOffset)
// Signals - crosses between Conversion Line (Tenkan-Sen) and Base Line (Kijun-Sen)
bullish_signal = crossover(conversion_noOffset,baseline_noOffset)
bearish_signal = crossunder(conversion_noOffset,baseline_noOffset)
// Various alerts
alertcondition(uptrend_start, title="Uptrend Started", message="Uptrend Started")
alertcondition(downtrend_start, title="Downtrend Started", message="Downtrend Started")
alertcondition(uptrend_confirm, title="Uptrend Confirmed", message="Uptrend Confirmed")
alertcondition(downtrend_confirm, title="Downtrend Confirmed", message="Downtrend Confirmed")
alertcondition(bullish_signal, title="Buy Signal", message="Buy Signal")
alertcondition(bearish_signal, title="Sell Signal", message="Sell Signal")
rsi_OBlevel = input(50, title="RSI Filter: Overbought level (0 = off)")
rsi_OSlevel = input(100,title="RSI Filter: Oversold level (100 = off)")
rsi_len = input(14,title="RSI Length")
rsi_src = input(close,title="RSI Price source")
rsi = rsi(rsi_src,rsi_len)
// Strategy -------------------------------
long_signal = bullish_signal and uptrend and rsi<=rsi_OSlevel // breakout filtered by the rsi
exit_long = bearish_signal and uptrend
short_signal = bearish_signal and downtrend and rsi>=rsi_OBlevel // breakout filtered by the rsi
exit_short = bullish_signal and downtrend
// Strategy alerts
alertcondition(long_signal, title="Long Signal - Uptrend", message="Long Signal - Uptrend")
alertcondition(exit_long, title="Long Exit Signal - Uptrend", message="Long Exit Signal - Uptrend")
alertcondition(short_signal, title="Long Signal - Downtrend", message="Long Signal - Downtrend")
alertcondition(exit_short, title="Short Exit Signal - Downtrend", message="Short Exit Signal - Downtrend")
// Plot areas for trend and transition
color_trend = uptrend? #00FF00 : downtrend? #FF0000 : notrend? color.new(#FFFFFF, 50) : na
fill(spanA_noOffset, spanB_noOffset, color=color_trend, transp=90, title="No offset: Ichimoku Cloud - Lagging Span & Cloud based coloring")
plotshape(ichiCloud_noOffset?uptrend_start:na, title="No offset: Uptrend Started", color=color.green, style=shape.circle, location=location.belowbar, size=size.tiny, text="Up")
plotshape(ichiCloud_noOffset?downtrend_start:na, title="No offset: Downtrend Started", color=color.red, style=shape.circle,location=location.abovebar, size=size.tiny, text="Down")
plotshape(ichiCloud_noOffset?uptrend_confirm:na, title="No offset: Uptrend Confirmed", color=color.green, style=shape.circle, location=location.belowbar, size=size.small, text="Confirm Up")
plotshape(ichiCloud_noOffset?downtrend_confirm:na, title="No offset: Downtrend Confirmed", color=color.red, style=shape.circle, location=location.abovebar, size=size.small, text="Confirm Down")
plotshape(ichiCloud_noOffset?long_signal:na, title="No offset: Long Signal", color=#00FF00, style=shape.triangleup, location=location.belowbar, size=size.small, text="Long")
plotshape(ichiCloud_noOffset?exit_long:na, title="No offset: Exit Long Signal", color=color.fuchsia, style=shape.triangledown, location=location.abovebar, size=size.small, text="Exit long")
plotshape(ichiCloud_noOffset?short_signal:na, title="No offset: Short Signal", color=#FF0000, style=shape.triangledown, location=location.abovebar, size=size.small, text="Short")
plotshape(ichiCloud_noOffset?exit_short:na, title="No offset: Exit Short Signal", color=color.fuchsia, style=shape.triangleup, location=location.belowbar, size=size.small, text="Exit short")
// ============================================================================== Strategy Component - uncomment to activate
if (long_signal)
strategy.entry("Long",strategy.long)
if (exit_long)
strategy.close("Long")
// if (short_signal)
// strategy.entry("Short",strategy.short)
// if (exit_short)
// strategy.close("Short")
// ==============================================================================
//@version=4
// This source code is subject to the terms of the Mozilla Public License 2.0 at https://mozilla.org/MPL/2.0/
// © colinmck
RSI_Period = input(10, title='RSI Length')
SF = input(5, title='RSI Smoothing')
QQE = input(2.438, title='Fast QQE Factor')
ThreshHold = input(10, title="Thresh-hold")
src = close
Wilders_Period = RSI_Period * 3 - 1
Rsi = rsi(src, RSI_Period)
RsiMa = ema(Rsi, SF)
AtrRsi = abs(RsiMa[1] - RsiMa)
MaAtrRsi = ema(AtrRsi, Wilders_Period)
dar = ema(MaAtrRsi, Wilders_Period) * QQE
longband = 0.0
shortband = 0.0
trend = 0
DeltaFastAtrRsi = dar
RSIndex = RsiMa
newshortband = RSIndex + DeltaFastAtrRsi
newlongband = RSIndex - DeltaFastAtrRsi
longband := RSIndex[1] > longband[1] and RSIndex > longband[1] ? max(longband[1], newlongband) : newlongband
shortband := RSIndex[1] < shortband[1] and RSIndex < shortband[1] ? min(shortband[1], newshortband) : newshortband
cross_1 = cross(longband[1], RSIndex)
trend := cross(RSIndex, shortband[1]) ? 1 : cross_1 ? -1 : nz(trend[1], 1)
FastAtrRsiTL = trend == 1 ? longband : shortband
// Find all the QQE Crosses
QQExlong = 0
QQExlong := nz(QQExlong[1])
QQExshort = 0
QQExshort := nz(QQExshort[1])
QQExlong := FastAtrRsiTL < RSIndex ? QQExlong + 1 : 0
QQExshort := FastAtrRsiTL > RSIndex ? QQExshort + 1 : 0
//Conditions
qqeLong = QQExlong == 1 ? FastAtrRsiTL[1] - 50 : na
qqeShort = QQExshort == 1 ? FastAtrRsiTL[1] - 50 : na
// Plotting
plotshape(qqeLong, title="QQE long", text="Long", textcolor=color.white, style=shape.labelup, location=location.belowbar, color=color.green, transp=0, size=size.tiny)
plotshape(qqeShort, title="QQE short", text="Short", textcolor=color.white, style=shape.labeldown, location=location.abovebar, color=color.red, transp=0, size=size.tiny)
// Alerts
alertcondition(qqeLong, title="Long", message="Long")
alertcondition(qqeShort, title="Short", message="Short")