Adaptive Grid-Trading-Strategie basierend auf einer quantitativen Handelsplattform
Überblick
Diese Strategie ist eine auf einer Quantifizierungs-Plattform basierende, anpassungsfähige Grid-Trading-Strategie. Die Strategie ermöglicht die Grid-Trading-Strategie, indem sie einen automatischen oder manuellen Grid-Trading-Bereich einrichtet, wobei die Kauf- und Verkaufsanweisungen in gleichem Abstand zwischen den Bereichen platziert werden.
Strategieprinzip
Sie können die historischen Höchst- und Tiefstpreise innerhalb eines bestimmten Bereichs automatisch als Obergrenze berechnen oder manuell eine feste Obergrenze festlegen.
Der Preisintervall für jedes Raster wird berechnet, basierend auf den oberen und unteren Preisen und der Anzahl der Netze.
In einer Grille werden mehrere Kauf- und Verkaufspunkte in gleichem Abstand zwischen den oberen und unteren Grenzpreisen angeordnet.
Wenn der Marktpreis die untere Grenze des Rasters überschreitet, wird ein Kauf in das nächste Raster des Rasters platziert, in dem der neueste ungleichgewichtete Lagerbestellung liegt. Wenn der Marktpreis die obere Grenze des Rasters überschreitet, wird ein Verkauf in das letzte Raster des Rasters platziert, in dem der neueste ungleichgewichtete Lagerbestellung liegt.
Auf diese Weise wird zwischen den unteren Grenzen des Gittermarktes eine kontinuierliche Kauf- und Verkaufsaktion durchgeführt. Die vorherigen Bestellungen werden nach und nach gestoppt oder gestoppt, wenn sich der Kursumkehr vollzieht.
Strategische Vorteile
Grid-Trading kann in schwankenden und schwankenden Zeiten profitieren.
Die Grid-Spanne kann automatisch an Marktschwankungen angepasst werden, ohne menschliche Intervention.
Es ist möglich, die eingesetzte Kapitalmenge prozentual auf die einzelnen Gitter zu verteilen, um jedes Risiko zu kontrollieren.
Einfache Logik, leicht verständlich, flexibel in der Parameteranpassung.
Risiken und Gegenmaßnahmen
Überschreitung der Obergrenze
- Lösung: Setzen Sie die Stop-Loss-Position vernünftigerweise.
Trend zu wiederholten Verlusten
- Die Lösung: Trends erkennen und den Handel zeitnah einstellen.
Die Parameter sind falsch eingestellt.
- Lösung: Anpassung der Grid-Anzahl und der Preis-Intervall-Parameter.
Optimierungsrichtung
Mit Hilfe von maschinellem Lernen können Preisschwankungen und -trends vorhergesagt und die Grid-Parameter dynamisch angepasst werden.
In einer Trend-Situation sollte man auf Trend-Trading umsteigen, um Verluste beim Gitterhandel zu vermeiden.
Risikokontrolle in Verbindung mit Indikatoren wie Kapitalnutzung und Rendite.
Es gibt viele verschiedene Arten, um die Mittel auszuweiten.
Zusammenfassen
Diese Strategie ist eine automatisch anpassbare Parameter-Adaptions-Gitter-Strategie, die für Aktien, digitale Währungen und Forex-Varianten mit schwankenden Horizontalen geeignet ist, die sich an die verschiedenen Marktsituationen anpassen können, wenn die Parameter-Parameter angepasst werden. Sie hat einen gewissen praktischen Wert.
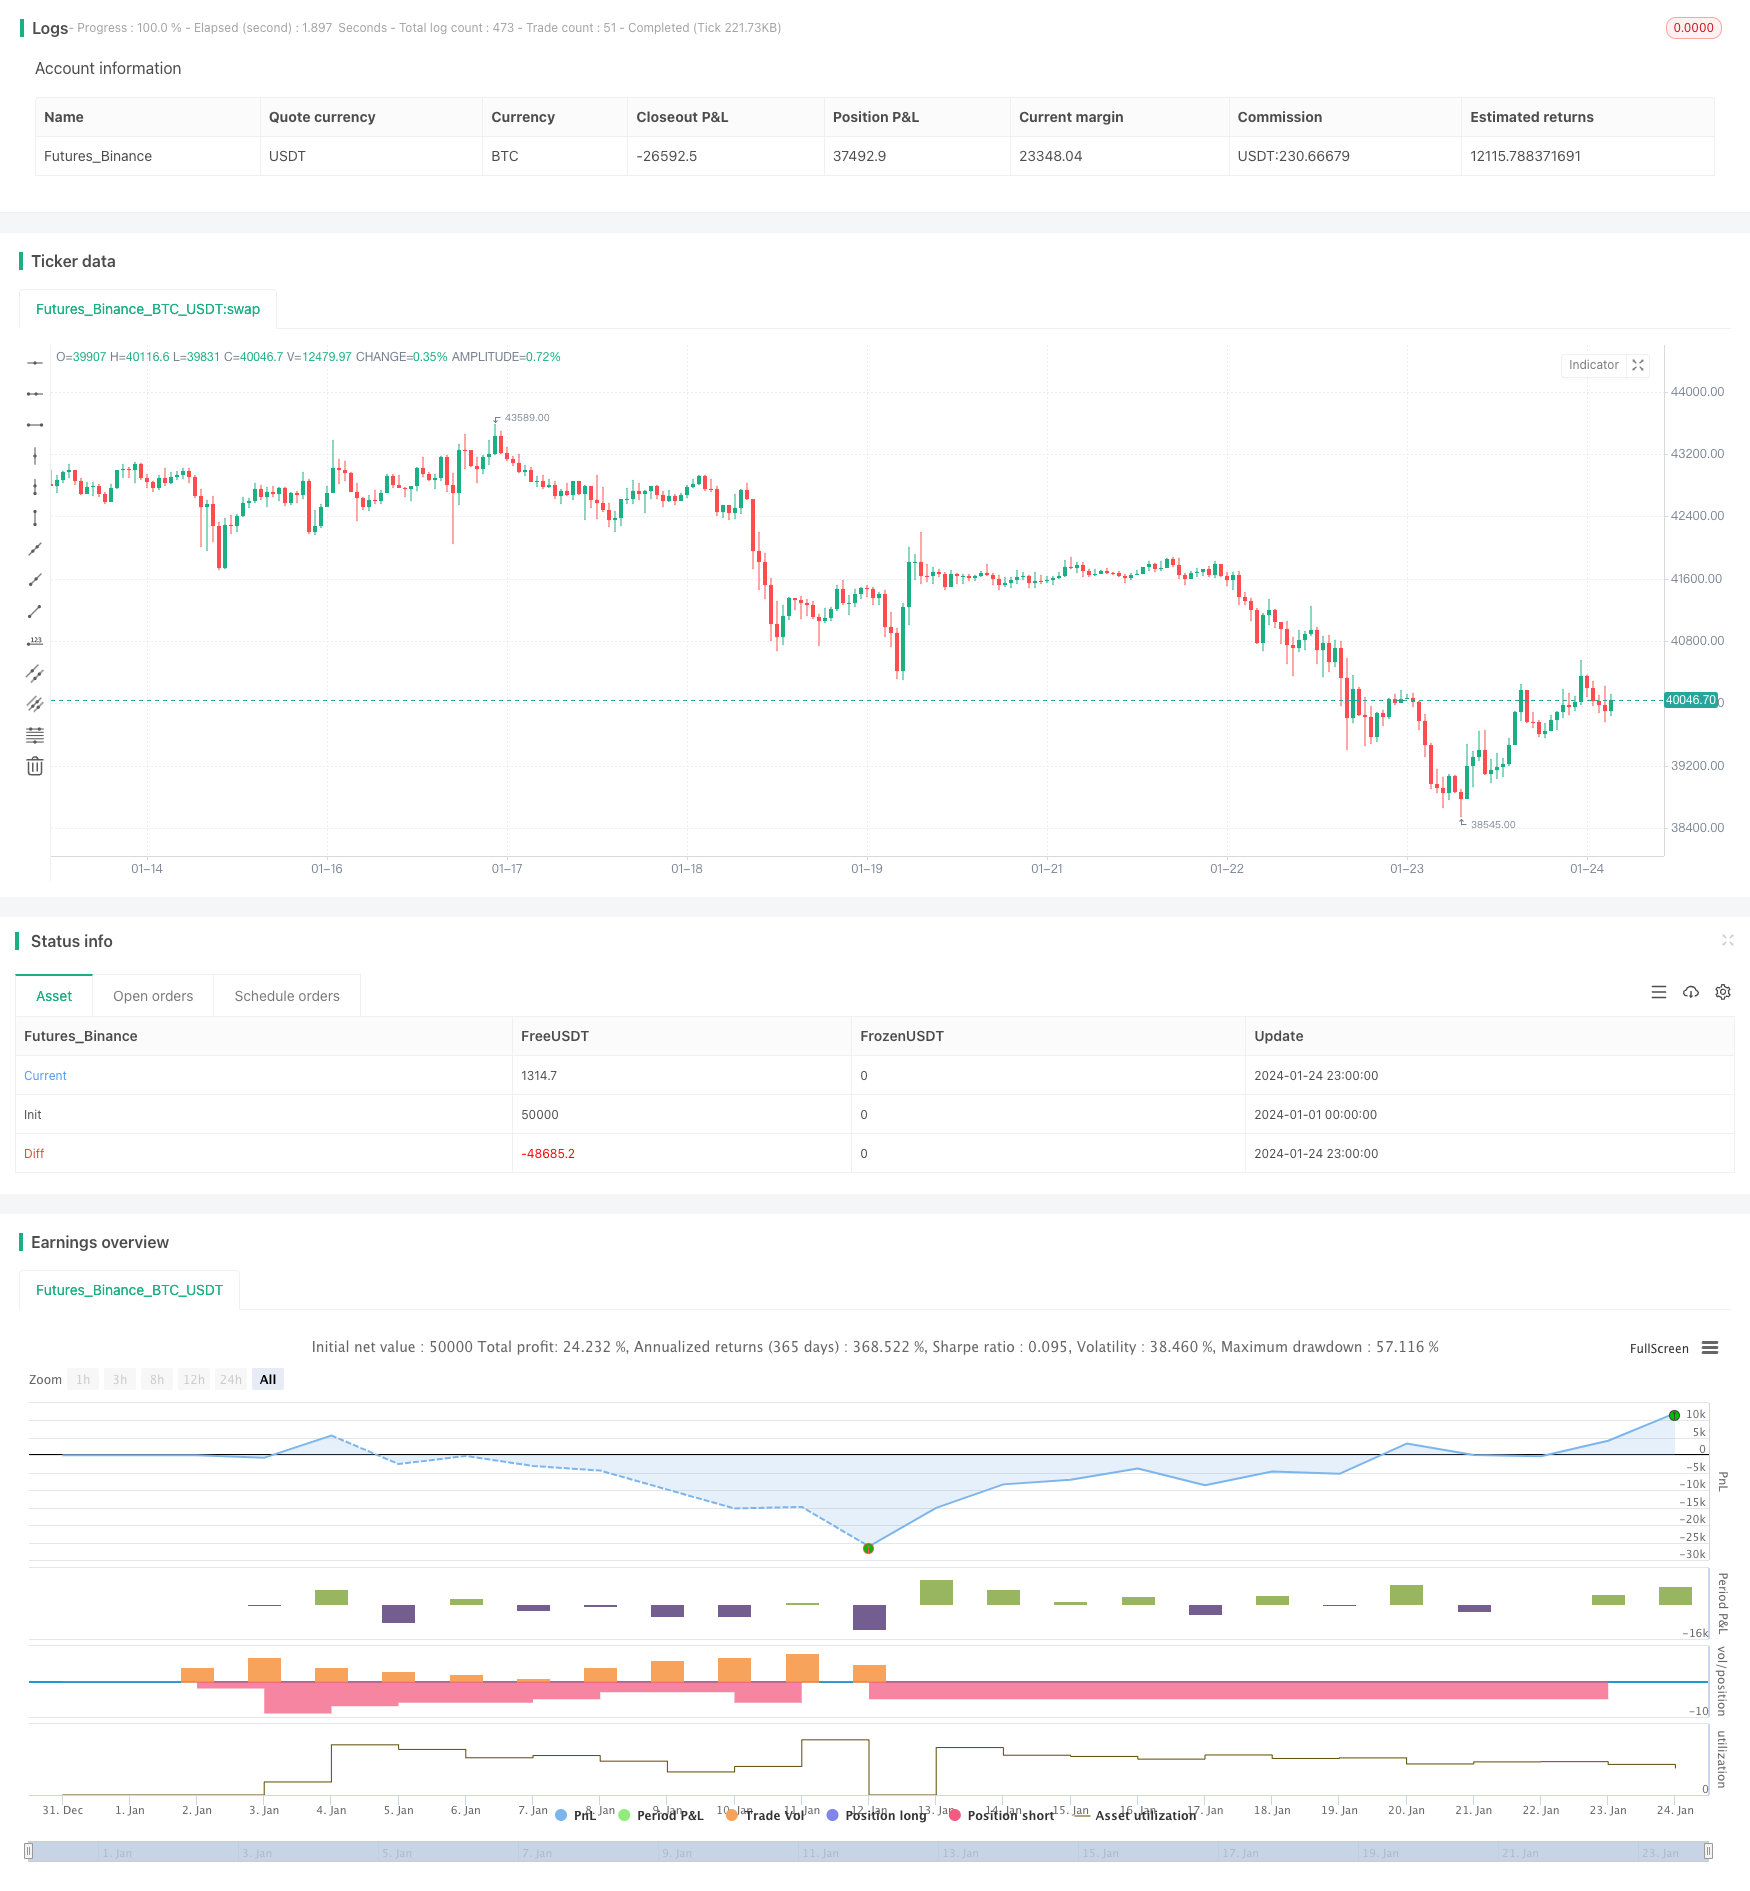
/*backtest
start: 2024-01-01 00:00:00
end: 2024-01-24 23:59:59
period: 1h
basePeriod: 15m
exchanges: [{"eid":"Futures_Binance","currency":"BTC_USDT"}]
*/

//@version=4
//hk4jerry

strategy("Grid Bot Backtesting", overlay=false, pyramiding=3000, close_entries_rule="ANY", default_qty_type=strategy.cash, initial_capital=100.0, currency="USD", commission_type=strategy.commission.percent, commission_value=0.025)
i_autoBounds    = input(group="Grid Bounds", title="Use Auto Bounds?", defval=true, type=input.bool)                             // calculate upper and lower bound of the grid automatically? This will theorhetically be less profitable, but will certainly require less attention
i_boundSrc      = input(group="Grid Bounds", title="(Auto) Bound Source", defval="Hi & Low", options=["Hi & Low", "Average"])     // should bounds of the auto grid be calculated from recent High & Low, or from a Simple Moving Average
i_boundLookback = input(group="Grid Bounds", title="(Auto) Bound Lookback", defval=250, type=input.integer, maxval=500, minval=0) // when calculating auto grid bounds, how far back should we look for a High & Low, or what should the length be of our sma
i_boundDev      = input(group="Grid Bounds", title="(Auto) Bound Deviation", defval=0.10, type=input.float, maxval=1, minval=-1)  // if sourcing auto bounds from High & Low, this percentage will (positive) widen or (negative) narrow the bound limits. If sourcing from Average, this is the deviation (up and down) from the sma, and CANNOT be negative.
i_upperBound    = input(group="Grid Bounds", title="(Manual) Upper Boundry(상단 가격)", defval=0.285, type=input.float)                      // for manual grid bounds only. The upperbound price of your grid
i_lowerBound    = input(group="Grid Bounds", title="(Manual) Lower Boundry(하단 가격)", defval=0.225, type=input.float)                      // for manual grid bounds only. The lowerbound price of your grid.
i_gridQty       = input(group="Grid Lines",  title="Grid Line Quantity(그리드 수)", defval=30, maxval=999, minval=1, type=input.integer)       // how many grid lines are in your grid
initial_balance = input(group="Trading option", title="Initial balance(투자금액)", defval=100, step=0.01)


start_time = input(group="Trading option",defval=timestamp('15 March 2023 06:00'), title='Start Time', type = input.time)
end_time = input(group="Trading option",defval=timestamp('31 Dec 2035 20:00'), title='End Time', type = input.time)
isAfterStartDate = true

tradingtime= (timenow - start_time)/(86400000*30)
yeartime=tradingtime/12


f_getGridBounds(_bs, _bl, _bd, _up) =>
    if _bs == "Hi & Low"
        _up ? highest(close, _bl) * (1 + _bd) : lowest(close, _bl)  * (1 - _bd)
    else
        avg = sma(close, _bl)
        _up ? avg * (1 + _bd) : avg * (1 - _bd)

f_buildGrid(_lb, _gw, _gq) =>
    gridArr = array.new_float(0)
    for i=0 to _gq-1
        array.push(gridArr, _lb+(_gw*i))
    gridArr

f_getNearGridLines(_gridArr, _price) =>
    arr = array.new_int(3)
    for i = 0 to array.size(_gridArr)-1
        if array.get(_gridArr, i) > _price
            array.set(arr, 0, i == array.size(_gridArr)-1 ? i : i+1)
            array.set(arr, 1, i == 0 ? i : i-1)
            break
    arr

var upperBound      = i_autoBounds ? f_getGridBounds(i_boundSrc, i_boundLookback, i_boundDev, true) : i_upperBound  // upperbound of our grid
var lowerBound      = i_autoBounds ? f_getGridBounds(i_boundSrc, i_boundLookback, i_boundDev, false) : i_lowerBound // lowerbound of our grid
var gridWidth       = (upperBound - lowerBound)/(i_gridQty-1)                                                       // space between lines in our grid
var gridLineArr     = f_buildGrid(lowerBound, gridWidth, i_gridQty)                                                 // an array of prices that correspond to our grid lines
var orderArr        = array.new_bool(i_gridQty, false)                                                              // a boolean array that indicates if there is an open order corresponding to each grid line

var closeLineArr    = f_getNearGridLines(gridLineArr, close)                                                        // for plotting purposes - an array of 2 indices that correspond to grid lines near price
var nearTopGridLine = array.get(closeLineArr, 0)                                                                    // for plotting purposes - the index (in our grid line array) of the closest grid line above current price
var nearBotGridLine = array.get(closeLineArr, 1)                                                                    // for plotting purposes - the index (in our grid line array) of the closest grid line below current price
if isAfterStartDate
    for i = 0 to (array.size(gridLineArr) - 1)
        if close < array.get(gridLineArr, i) and not array.get(orderArr, i) and i < (array.size(gridLineArr) - 1)
            buyId = i
            array.set(orderArr, buyId, true)
            strategy.entry(id=tostring(buyId), long=true, qty=(initial_balance/(i_gridQty-1))/close, comment="#"+tostring(buyId))
        if close > array.get(gridLineArr, i) and i != 0
            if array.get(orderArr, i-1)
                sellId = i-1
                array.set(orderArr, sellId, false)
                strategy.close(id=tostring(sellId), comment="#"+tostring(sellId))

    if i_autoBounds
        upperBound  := f_getGridBounds(i_boundSrc, i_boundLookback, i_boundDev, true)
        lowerBound  := f_getGridBounds(i_boundSrc, i_boundLookback, i_boundDev, false)
        gridWidth   := (upperBound - lowerBound)/(i_gridQty-1)
        gridLineArr := f_buildGrid(lowerBound, gridWidth, i_gridQty)

    closeLineArr    := f_getNearGridLines(gridLineArr, close)
    nearTopGridLine := array.get(closeLineArr, 0)
    nearBotGridLine := array.get(closeLineArr, 1)


var table table = table.new(position.top_right,6,8, frame_color = color.rgb(255, 255, 255),frame_width = 2,border_width = 2, border_color=color.rgb(255, 255, 255))


//제목
table.cell(table,0,0,"상단 라인 :", bgcolor=color.new(color.black,0),text_color =color.white)
table.cell(table,0,1,"하단 라인 :",bgcolor=color.new(color.black,0),text_color =color.white)
table.cell(table,0,2,"그리드 수 :",bgcolor=color.new(color.black,0),text_color =color.white)
table.cell(table,0,3,"투자금액 :",text_color =color.white,bgcolor=color.new(color.black,0))
table.cell(table,0,4,"그리드당 투자금액 :",text_color =color.white,bgcolor=color.new(color.black,0))
//수치
table.cell(table,1,0, tostring(upperBound, '###.#####')+ "  USDT", bgcolor=color.new(#5a637e, 0),text_color =color.white)
table.cell(table,1,1, tostring(lowerBound, '###.#####')+ "  USDT", bgcolor=color.new(#5a637e, 0),text_color =color.white)
table.cell(table,1,2, tostring(i_gridQty, '###'), bgcolor=color.new(#5a637e, 0),text_color =color.white)
table.cell(table,1,3, tostring(initial_balance,'###.##')+ "  USDT", bgcolor=color.new(#5a637e, 0),text_color =color.white)
table.cell(table,1,4, tostring(initial_balance/i_gridQty,'###.##')+ "  USDT", bgcolor=color.new(#5a637e, 0),text_color =color.white)

//제목
table.cell(table,2,0,"현재 포지션 :",text_color =color.white,bgcolor=color.new(color.black,0))
table.cell(table,2,1,"현재 포지션 평단가 :",text_color =color.white,bgcolor=color.new(color.black,0))
table.cell(table,2,2,"현재 포지션 수익 :",bgcolor=color.new(color.black,0),text_color =color.white)
table.cell(table,2,3,"현재 포지션 수익 % :",bgcolor=color.new(color.black,0),text_color =color.white)
table.cell(table,2,4,"현재 포지션 수수료 :",text_color =color.white,bgcolor=color.new(color.black,0))

//수치
table.cell(table,3,0, tostring(strategy.position_size) +   syminfo.basecurrency + "\n"  + tostring(strategy.position_size*strategy.position_avg_price/1, '###.##') + "USDT" ,text_color =color.white,bgcolor=color.new(#5a637e, 0))
table.cell(table,3,1, text=strategy.position_size>0 ? tostring(strategy.position_avg_price,'###.####')+ "  USDT" : "NOT TRADING",text_color =color.white,bgcolor=color.new(#5a637e, 0))
table.cell(table,3,2, tostring(strategy.openprofit, '###.##')+ "  USDT",text_color =color.white,bgcolor=strategy.openprofit > 0 ? color.teal : color.maroon)
table.cell(table,3,3, tostring(strategy.openprofit/initial_balance*100, '###.##')+ "%",text_color =color.white,bgcolor=strategy.openprofit > 0 ? color.teal : color.maroon)
table.cell(table,3,4, "-" + tostring(strategy.position_avg_price*strategy.position_size*0.025/100,'###.##')+ "  USDT",text_color =color.white,bgcolor=color.new(#5a637e, 0))

//제목
table.cell(table,4,0,"그리드 수익 :",text_color =color.white,bgcolor=color.new(color.black,0))
table.cell(table,4,1,"그리드 수익률 :",text_color =color.white,bgcolor=color.new(color.black,0))
table.cell(table,4,2,"총 수익 :", bgcolor=color.new(color.black,0),text_color =color.white)
table.cell(table,4,3,"총 수익률 :",bgcolor=color.new(color.black,0),text_color =color.white)
table.cell(table,4,4,"현재 자산 :",bgcolor=color.new(color.black,0),text_color =color.white)


//수치
table.cell(table,5,0, tostring(strategy.netprofit, '###.#####')+ "USDT", text_color =color.white,bgcolor=strategy.netprofit > 0 ? color.teal : color.maroon)
table.cell(table,5,1, tostring((strategy.netprofit)/initial_balance*100/tradingtime, '####.##') + "%",text_color =color.white,bgcolor=strategy.netprofit > 0 ? color.teal : color.maroon)
table.cell(table,5,2, tostring(strategy.netprofit+strategy.openprofit, '###.##') + "  USDT",text_color =color.white,bgcolor=strategy.netprofit+strategy.openprofit > 0 ? color.teal : color.maroon)
table.cell(table,5,3, tostring((strategy.netprofit+strategy.openprofit)/initial_balance*100, '####.##') + "%",text_color =color.white,bgcolor=strategy.netprofit+strategy.openprofit > 0 ? color.teal : color.maroon)
table.cell(table,5,4, tostring(initial_balance+strategy.netprofit+strategy.openprofit, '###.##')+ "  USDT", text_color =color.white,bgcolor=color.new(#3d4d7c, 0))


// plot(strategy.initial_capital+ strategy.netprofit+strategy.openprofit, "총 수익 USDT",color=color.rgb(81, 137, 128))
// plot(initial_balance, "투자금액",color=color.rgb(81, 137, 128))