Hein Ashu y la estrategia de la supertendencia

Descripción general
Una estrategia de seguimiento de tendencias que combina un gráfico de tendencias y un indicador de tendencias es una estrategia de seguimiento de tendencias que combina un gráfico de tendencias y un indicador de tendencias. La estrategia tiene como objetivo identificar la dirección de la tendencia, operar en zonas de tendencia y salir rápidamente cuando la tendencia se invierte, lo que minimiza las pérdidas de las operaciones no tendencia.
Principio de estrategia
El gráfico de tendencias de Heinrich Himmler es un gráfico de línea K especial que utiliza el precio de apertura, el precio de cierre, el precio más alto y el precio más bajo para trazar la entidad de tendencias, lo que permite filtrar el ruido del mercado y hacer que el gráfico sea más claro. El indicador de tendencias súper se compone de dos curvas que determinan la dirección de la tendencia a través de líneas de soporte y resistencia dinámicas.
La estrategia primero calcula el gráfico de Hines y luego calcula el indicador de supertrend basado en la línea K de Hines. Cuando el precio rompe el indicador de supertrend, genera una señal de transacción. Concretamente, la estrategia utiliza la línea K de Hines para calcular la amplitud real de la onda, y luego combina la amplitud de la onda y el precio promedio para obtener la subida y bajada de la supertrend.
La estrategia también optimiza los parámetros de los indicadores de tendencias súper, utilizando la combinación de parámetros óptimos para aumentar la sensibilidad de los indicadores. Además, la estrategia incorpora un mecanismo de stop loss que permite controlar el riesgo al tiempo que garantiza las ganancias.
Análisis de las ventajas
- El uso de mapas de Heinrich Himmler puede filtrar el ruido y hacer que la señal sea más clara.
- El indicador de tendencias súper puede capturar rápidamente los cambios de tendencia y enviar señales de comercio a tiempo.
- La optimización de parámetros mejora la fiabilidad de los indicadores.
- El mecanismo de suspensión de pérdidas integrado permite controlar el riesgo de manera efectiva.
- La combinación de seguimiento de tendencias y un sistema de comercio automático tiene un alto grado de automatización.
Análisis de riesgos
- El sistema de transacciones es altamente automatizado y debe ser vigilado de cerca para evitar anomalías.
- El mapa de Heine-Atheu puede filtrar el ruido, pero también puede perder una pequeña señal de retorno.
- Los indicadores de tendencia súper pueden generar señales erróneas, lo que puede conducir a una entrada prematura o a una pérdida.
- La configuración incorrecta de los puntos de parada también puede causar pérdidas innecesarias.
- La falta de datos de la detección puede causar una sobreconformidad. El disco duro puede tener una gran desviación de los resultados de la detección.
Dirección de optimización
- Prueba más combinaciones de parámetros para optimizar aún más el indicador de tendencias súper.
- Prueba con otros indicadores para confirmar la señal del indicador de tendencia súper y reduce la tasa de señales erróneas.
- Optimizar la estrategia de stop loss para reducir al máximo las pérdidas innecesarias, a la vez que se garantiza la obtención de beneficios.
- Aumentar la capacidad de los algoritmos de aprendizaje automático para determinar las tendencias reales mediante el entrenamiento de datos masivos.
- El uso de periodos de tiempo más largos y datos históricos de más mercados diferentes para hacer retrospectivas, aumenta la fiabilidad.
Resumir
Una estrategia de seguimiento de tendencias es una estrategia de seguimiento de tendencias que permite identificar la dirección de la tendencia, operar bajo una gran tendencia y detenerse rápidamente cuando se invierte. La estrategia integra el filtro de ruido de la gráfica de Hines y la capacidad de capturar rápidamente los cambios de tendencia de los indicadores de tendencias.
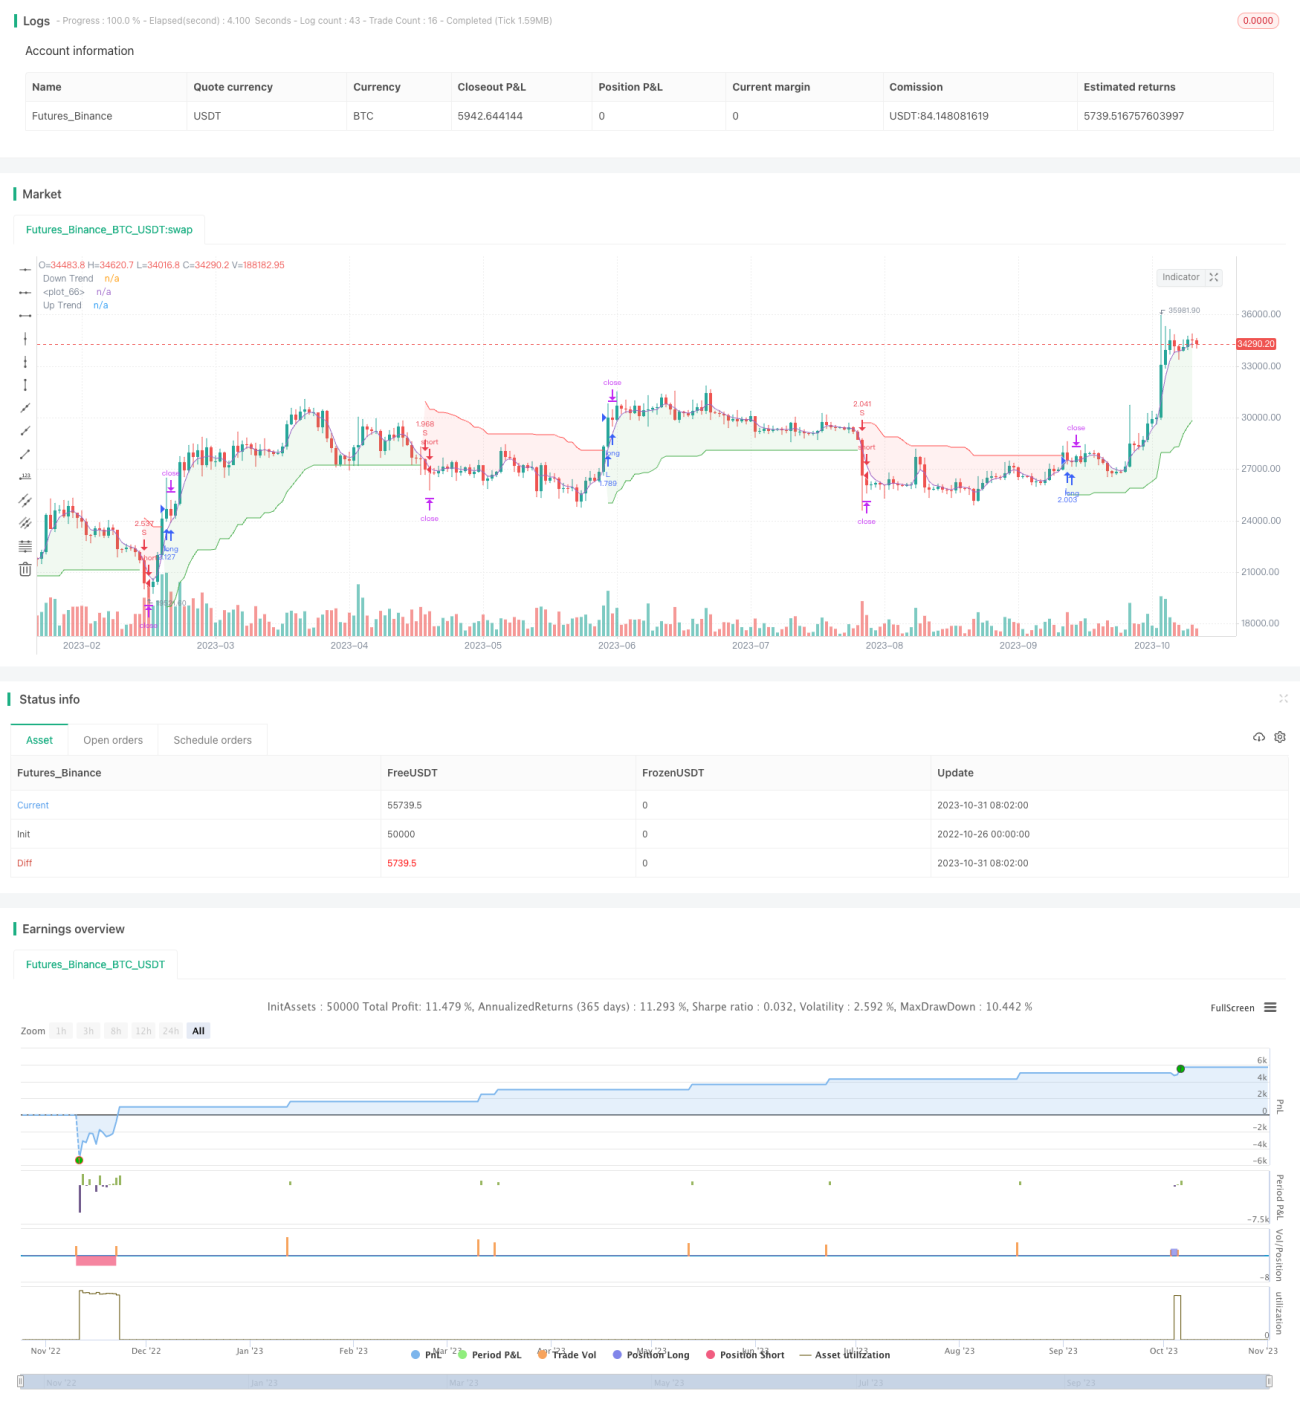
/*backtest
start: 2022-10-26 00:00:00
end: 2023-11-01 00:00:00
period: 1d
basePeriod: 1h
exchanges: [{"eid":"Futures_Binance","currency":"BTC_USDT"}]
*/

//@version=5

strategy("Heiken Ashi & Super Trend_ARM", overlay=true,  pyramiding=1,initial_capital = 10000, default_qty_type= strategy.percent_of_equity, default_qty_value = 100, calc_on_order_fills=false, slippage=0,commission_type=strategy.commission.percent,commission_value=0.02)
- 1