Estrategia cuantitativa de orden de reversión ATR de zona de impulso
Descripción general
La idea principal de esta estrategia es la combinación de la zona de energía dinámica y el indicador ATR, hacer más cuando aparece un tenedor de oro, hacer vacío cuando aparece un tenedor muerto. Al mismo tiempo, se establece un precio de stop loss y un precio de parada. Cuando se produce una señal de reversión del precio, se abre la posición al revés, para lograr la función de la orden de reversión.
El principio
- Se calcula la señal de pluralidad utilizando el EMA rápido y el EMA lento. Un EMA rápido que es más alto que un EMA lento es un alza, y el EMA lento es más bajo.
- Cuando no hay posición, el tenedor dorado hace más, el tenedor muerto hace vacío.
- Una vez abierta la posición, si aparece una señal de cambio, se borrará la posición actual y luego se abrirá una nueva posición en la dirección opuesta.
- Los indicadores ATR se utilizan para calcular el precio de parada y el precio de parada. El precio de parada se ajusta según el canal ATR para garantizar que el riesgo de parada sea bajo.
- Cuando el precio entra en la zona de sobreventa, se ajusta el precio de parada al precio más alto o más bajo de la última línea K para evitar que se encuentre en la zona de sobreventa.
Las ventajas
- La combinación de la zona de energía dinámica y el ATR, permite abrir posiciones en la tendencia con éxito, y también puede detener los paros de pérdida a tiempo.
- Implementar la función de orden inversa, que permite cambiar de dirección rápidamente cuando el precio se invierte, aprovechando las fluctuaciones bidireccionales del precio para obtener mayores ganancias.
- El mecanismo de detención de pérdidas ATR permite controlar eficazmente el riesgo de detención individual y lograr una alta tasa de ganancias en general.
- En el caso de las ventas, el precio de venta es el precio de venta, y el precio de venta es el precio de venta.
Riesgos y soluciones
- Los pedidos invertidos pueden operar con demasiada frecuencia en situaciones de crisis, aumentando los costos de operación y la probabilidad de pérdidas.
- Solución: Aumentar el período de tenencia mínima y reducir la reversión en situaciones de crisis.
- Los cambios en el ATR pueden hacer que el límite de pérdidas sea demasiado grande o demasiado pequeño.
- Solución: Ajuste la distancia de parada en tiempo real según el valor de ATR.
- La configuración incorrecta de los parámetros puede causar una frecuencia de transacción excesiva o una mala eficacia de la señal.
- Solución: Combinación de parámetros de selección razonable según las diferentes variedades.
Dirección de optimización
- Optimización de la configuración de los parámetros para encontrar la combinación óptima de parámetros.
- Se añaden filtros de indicadores de tecnología auxiliar para mejorar la calidad de la señal.
- Añadir un módulo de gestión de fondos para que las posiciones estén vinculadas a los activos totales de la cuenta.
- Aumentar el análisis a lo largo de períodos de tiempo y aprovechar más información para mejorar la eficacia de la estrategia.
Resumir
Esta estrategia integra las ventajas de las zonas de energía dinámica y los indicadores ATR para lograr una negociación bidireccional eficiente. El mecanismo de pedido inverso y el stop inteligente ATR pueden aprovechar al máximo las fluctuaciones de precios. La configuración de parámetros optimizados y la combinación de más indicadores pueden mejorar aún más la eficacia de la estrategia.
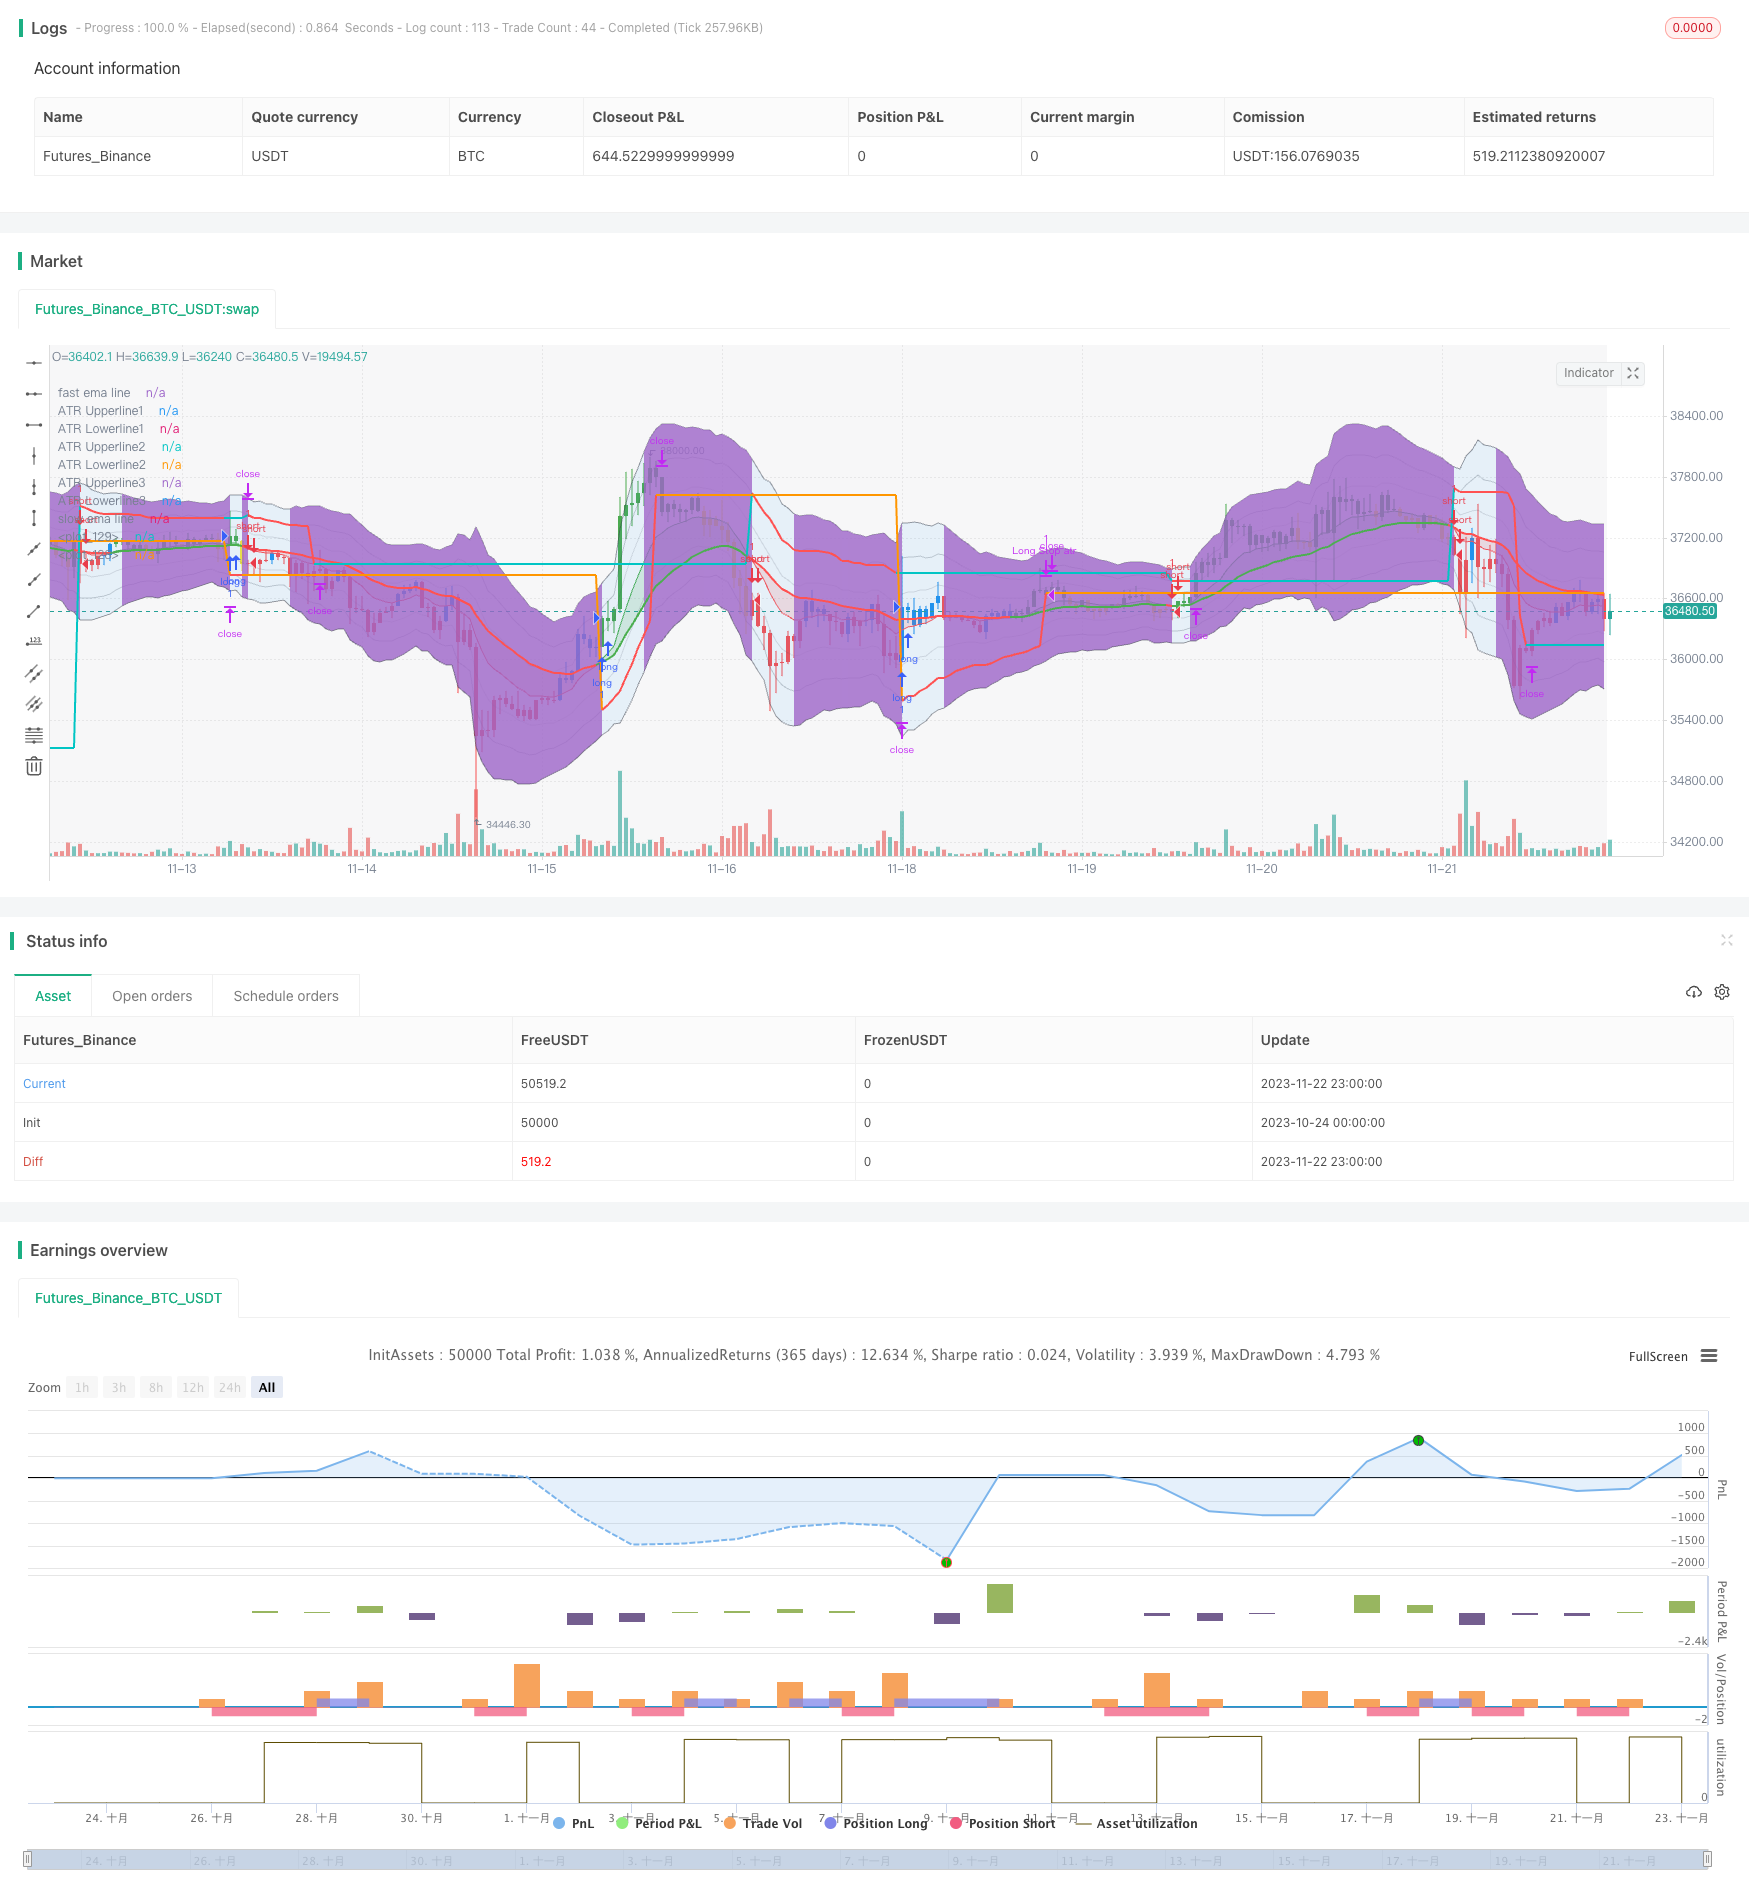
/*backtest
start: 2023-10-24 00:00:00
end: 2023-11-23 00:00:00
period: 1h
basePeriod: 15m
exchanges: [{"eid":"Futures_Binance","currency":"BTC_USDT"}]
*/

// This source code is subject to the terms of the Mozilla Public License 2.0 at https://mozilla.org/MPL/2.0/
// © fenirlix

//@version=5
// Strategy parameter incl. position size, commission and initial capital
strategy("ACTIONZONE-ATR REVERSEORDER STRATEGY", "ACTIONZONEATR-REVERSEORDER", overlay=true
     )

// User Input Variable
fastMaInput     = input.int(12, "Fast MA Period", minval=2, step=1)
slowMaInput     = input.int(26, "Fast MA Period", minval=2, step=1)

atrLengthInput  = input.int(14, "ATR length", minval=2,step=1)
atrInnerMultInput = input.float(1, "atr inner multiplier", minval=0.1, step=0.1)
atrMidMultInput = input.float(2, "atr inner multiplier", minval=0.1, step=0.1) //***** MOST OF RISK MANAGEMENT LOGIC BASE ON THIS INPUT *****//
atrOuterMultInput = input.float(3, "atr inner multiplier", minval=0.1, step=0.1)

// Backtesting Date range
startYearInput      = input.int(2021, "Start Year", minval=1900, maxval=2100, step=1)
startMonthInput     = input.int(12, "Start Month", minval=1, maxval=12, step=1)
startDateInput      = input.int(1, "Start Day", minval=1, maxval=31, step=1)
setEndRangeInput    = input.bool(false, "Using Specific End Test Date") //Set specific End date or use present(end of candle) data
endYearInput        = input.int(2022, "End Year", minval=1900, maxval=2100, step=1)
endMonthInput       = input.int(1, "End Month", minval=1, maxval=12, step=1)
endDateInput        = input.int(31, "End Day", minval=1, maxval=31, step=1)

startDate = timestamp(syminfo.timezone, startYearInput, startMonthInput, startDateInput)
endDate = timestamp(syminfo.timezone, endYearInput, endMonthInput, endDateInput)
inDateRange = time >= startDate //Set backtest date range to present data
if setEndRangeInput
    inDateRange and time <= endDate //set backtest date range to specific date

// minimum position hold period (to get rid of false signal in sideway trend)
minHoldInput = input.int(8, 'Minimum position Hold Limit', minval=1, maxval=365, step=1) // Set Minimum Position Hold

var bool reverseToLong = false // Assign reverse order operator
var bool reverseToShort = false // Assign reverse order operator

// Indicator Declaration
fastEma = ta.ema(close, fastMaInput)
slowEma = ta.ema(close, slowMaInput)
atr = ta.atr(atrLengthInput)

// Declare trend of asset
isBullish = fastEma > slowEma
isBearish = fastEma <= slowEma

// Record position hold length, to limit minimum hold period(candle)
var int hold_length = 0
if strategy.opentrades > 0 or strategy.opentrades < 0
    hold_length := hold_length + 1
else
    hold_length := 0

// create permanent variable of stop price
var float longStopPrice = na
var float shortStopPrice = na

// Chart-Indicator COLOR declaration
REDBEAR     = color.new(color.red, 80)
GREENBULL   = color.new(color.green, 80)

greenLong = isBullish and close > fastEma
yellowLong = isBullish and close < fastEma
blueShort = isBearish and close > fastEma
redShort = isBearish and close < fastEma

// assign oversold, overbought condition(in this case, price over middle atr plus/minus fastEma)
overBand = high[1] > fastEma + (2*atr)
underBand = low[1] < fastEma - (2*atr)

// Strategy

// Main Entry Condition
goLong = isBullish and isBullish[1] == 0
goShort = isBearish and isBearish[1] == 0

inPosition = strategy.position_size != 0
minHoldPeriod = hold_length > minHoldInput ? true : false

// Entry Condition
if not inPosition and inDateRange and barstate.isconfirmed == true //compute after close of the bar to avoid repainting
    if goLong or reverseToLong // Long if longcondition or reverse order receive.
        strategy.entry('long', strategy.long)
        longStopPrice := fastEma - (atr * 2) // Set stop loss price
        reverseToLong := false // Reset reverse order status

    else if goShort or reverseToShort
        strategy.entry('short', strategy.short)
        shortStopPrice := fastEma + (atr * 2)
        reverseToShort := false
// Take profit and Set Higher Stop
if inPosition and minHoldPeriod and barstate.isconfirmed == true // check if we're in position and pass minimum hold period, confirm no repainting
    if strategy.position_size > 0
        // if exit position by Sellcondition(which is the same as ShortCondition), Exit Long position and make Short order(by set reverse order to true)
        strategy.close('long', when=goShort, comment='exitLong(' + str.tostring(hold_length) + ')')
        reverseToShort := true
        if overBand //If overbought condition met, set Stop price to LAST LOW, and not reverse any position
            longStopPrice := low[1]
            reverseToShort := false
    else if strategy.position_size < 0
        strategy.close('short', when=goLong, comment='exitShort(' + str.tostring(hold_length) + ')')
        reverseToLong := true
        if underBand
            shortStopPrice := high[1]
            reverseToLong := false
// Stop Loss and Set calculate stop loss using Atr Channel
if inPosition
    if strategy.position_size > 0
        if fastEma - (atr * atrMidMultInput) > longStopPrice // set long stop price to the higher of latest long stop price and ATR lower channel
            longStopPrice := fastEma - (atr * atrMidMultInput)
        strategy.exit('Long Stop atr ', 'long', stop=longStopPrice)
    else if strategy.position_size < 0
        if fastEma + (atr * atrMidMultInput) < shortStopPrice
            shortStopPrice := fastEma + (atr * atrMidMultInput)
        strategy.exit('Short Stop atr ', 'short', stop=shortStopPrice)

// Plotting
fastLine = plot(fastEma, title='fast ema line', linewidth=1, color=isBullish ? color.green : color.red)
slowLine = plot(slowEma, title='slow ema line', linewidth=2, color= isBullish? color.green : color.red)
atrUpperLine1 = plot(fastEma + (atr * atrInnerMultInput), title='ATR Upperline1', color=color.new(color.black,85))
atrLowerLine1 = plot(fastEma - (atr * atrInnerMultInput), title='ATR Lowerline1', color=color.new(color.black,85))
atrUpperLine2 = plot(fastEma + (atr * atrMidMultInput), title='ATR Upperline2', color=color.new(color.black,75))
atrLowerLine2 = plot(fastEma - (atr * atrMidMultInput), title='ATR Lowerline2', color=color.new(color.black,75))
atrUpperLine3 = plot(fastEma + (atr * atrOuterMultInput), title='ATR Upperline3', color=color.new(color.black,50))
atrLowerLine3 = plot(fastEma - (atr * atrOuterMultInput), title='ATR Lowerline3', color=color.new(color.black,50))

plot(longStopPrice, color=strategy.position_size > 0 ? color.red : na, linewidth=2)
plot(shortStopPrice, color=strategy.position_size < 0 ? color.red : na, linewidth=2)

//  Filling
fill(fastLine, slowLine, color=isBullish ? GREENBULL : REDBEAR)
fill(atrUpperLine3, atrLowerLine3, color=inPosition and (minHoldInput - hold_length > 0) ? color.new(color.blue,90): na)

barColor = switch
    greenLong => color.green
    yellowLong =>  color.yellow
    blueShort => color.blue
    redShort => color.red
    => color.black
barcolor(color=barColor)

// Fill background to distinguish inactive time(Zulu time)
nightTime = time(timeframe.period, "1500-0100") ? color.new(color.black, 95): na
bgcolor(nightTime)