Estrategia de captura de volatilidad dinámica con bandas de Bollinger y RSI

Descripción general
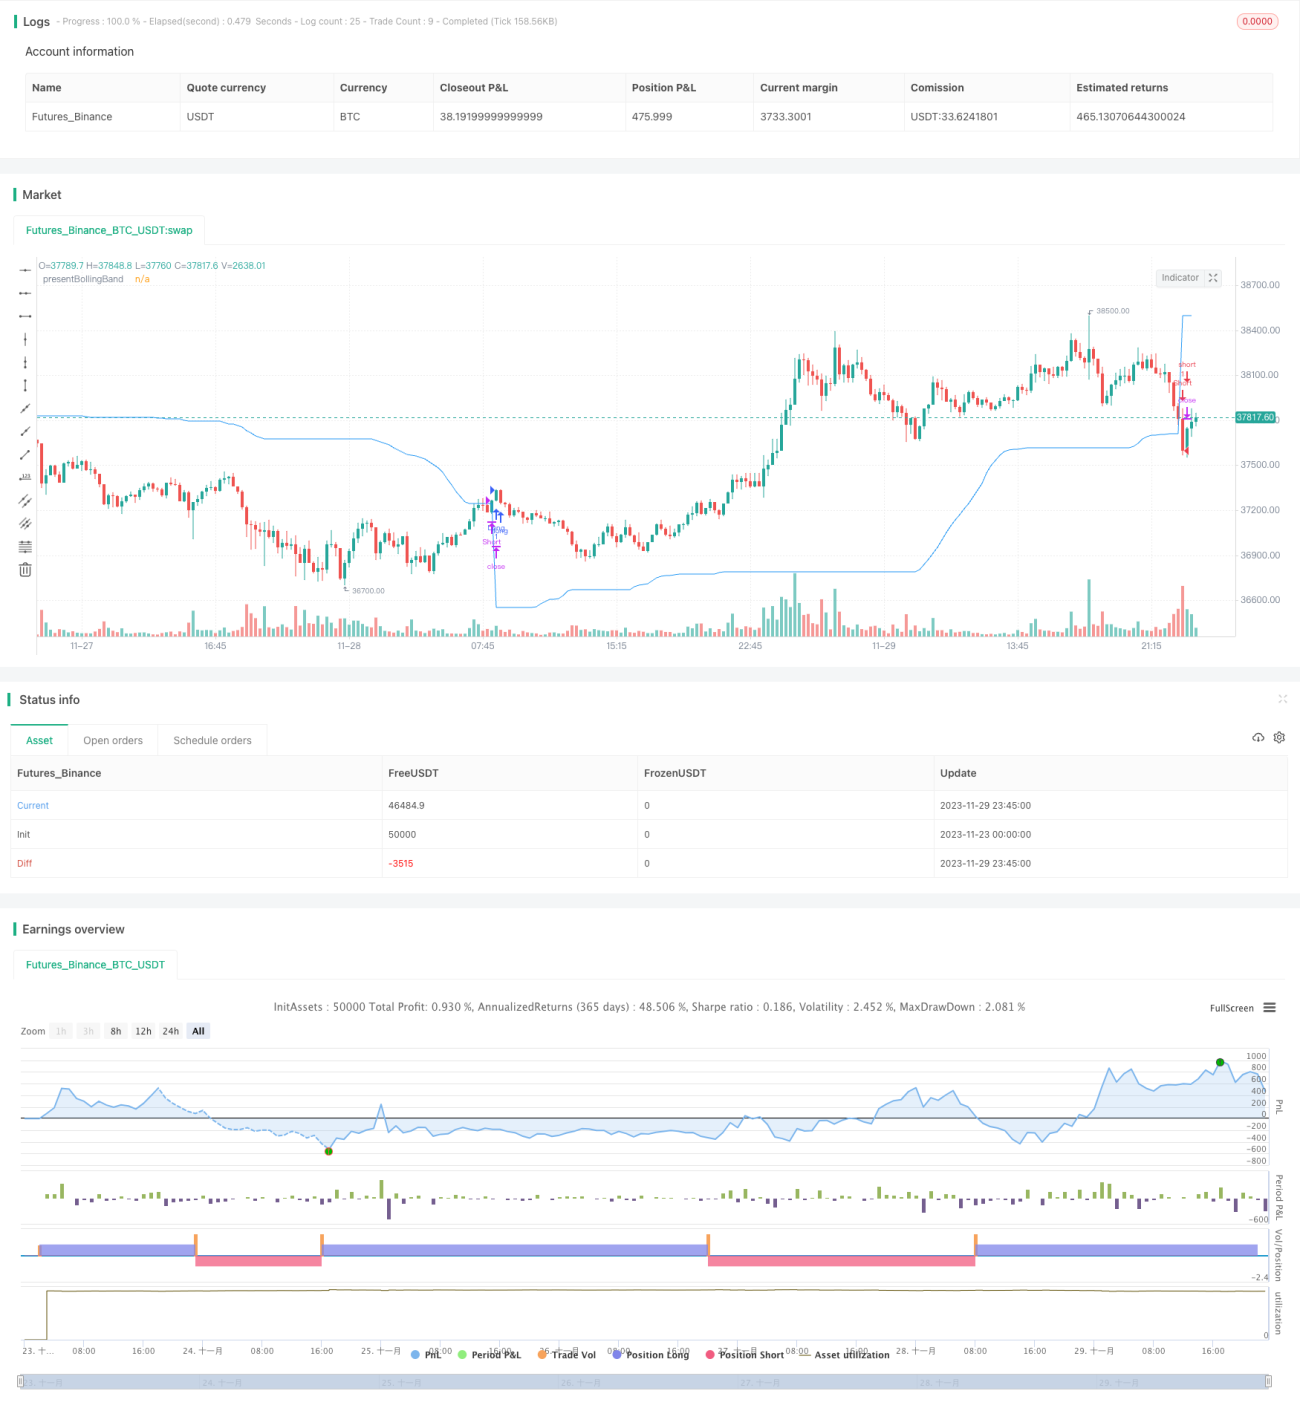
La estrategia RSI-Bulling Band es una estrategia de negociación que integra la idea de las bandas de Bulling (BB), el indicador de la fuerza relativa (RSI) y el promedio móvil simple (SMA). La estrategia se caracteriza por calcular un nivel dinámico entre el precio de cierre en el tren superior y el precio de cierre en el tren inferior. Esta característica única permite a la estrategia adaptarse a la volatilidad del mercado y a los cambios de precios.
Los mercados de criptomonedas y acciones son altamente volátiles, por lo que son ideales para aplicar la estrategia de las bandas de Brin. El RSI puede ayudar a identificar sobrecompras y sobreventas en este mercado, que suele ser especulativo.
Principio de estrategia
Las bandas de Bolling Dinámicas: La estrategia primero calcula las bandas de Bolling de subida y bajada de acuerdo con la longitud y el multiplicador definidos por el usuario. Luego, combina las bandas de Bolling y la dinámica de precios de cierre para ajustar el valor de las bandas de Bolling Presente. Finalmente, genera señales de más cuando los precios atraviesan las bandas de Bolling Presente y de menos cuando los precios atraviesan las bandas de Bolling Presente.
RSI: Si el usuario elige usar el RSI para generar señales, la estrategia también calcula el RSI y su SMA, y los usa para generar señales adicionales de venta y ventaja. La señal basada en el RSI solo se usa cuando el parche de generar señales con el RSI está configurado como verdadero.
Luego, la estrategia comprueba la dirección de la operación elegida y entra en posiciones de venta o venta corta, respectivamente. Si la dirección de la operación está configurada como un eje bidireccional, la estrategia puede entrar en posiciones de venta y venta corta al mismo tiempo.
Por último, cuando el precio de cierre atraviesa la banda de cambio actual, la posición se apaga y se abre; cuando el precio de cierre atraviesa la banda de cambio actual, se apaga y abre.
Análisis de las ventajas
La estrategia combina las ventajas de los indicadores Brin, RSI y SMA para adaptarse a la volatilidad del mercado, capturar dinámicamente las fluctuaciones y generar señales de negociación en caso de sobrecompra y sobreventa.
El indicador RSI complementa las señales de trading de las bandas de Bryn para evitar entradas erróneas en mercados convulsionados. Permite opciones de solo hacer más, solo hacer menos o de comercio bidireccional, adaptándose a diferentes condiciones de mercado.
Los parámetros son personalizables y se pueden ajustar a las preferencias de riesgo individuales.
Análisis de riesgos
La estrategia se basa en indicadores técnicos y no puede hacer frente a los cambios fundamentales.
La configuración incorrecta de los parámetros de la banda de Brin puede causar señales de transacción demasiado frecuentes o demasiado escasas.
El riesgo de una operación bidireccional aumenta, por lo que hay que estar atento a la posibilidad de que se produzca un retroceso de la pérdida de la cotización.
Se recomienda la combinación de stop loss para controlar el riesgo.
Dirección de optimización
-
En combinación con otras señales de filtración de indicadores, como MACD.
-
Aumentar las estrategias para detener los daños.
-
Optimización de los parámetros de la banda de Brin y el RSI.
-
Ajuste de parámetros según el tipo de transacción y el ciclo.
-
Considere la optimización del disco y ajuste los parámetros para adaptarse a la situación real.
Resumir
La estrategia RSI-Brines es una estrategia impulsada por indicadores técnicos que combina las ventajas de los Brines, RSI y SMA para capturar las fluctuaciones del mercado mediante el ajuste dinámico de Brines. La estrategia puede ser personalizada y optimizada, pero no puede predecir los cambios fundamentales.
- 1