Estrategia de cruce de medias móviles dobles

Descripción general
Esta estrategia es una estrategia de seguimiento de tendencias basada en el cruce de dos medias. Combina una media móvil simple rápida (SMA) y una media móvil ponderada lenta (VWMA), que utiliza el cruce de las dos medias para formar señales de compra y venta.
Cuando el SMA rápido sube a través del VWMA lento, genera una señal de compra; cuando el SMA rápido baja a través del VWMA lento, genera una señal de venta. La estrategia utiliza un mecanismo de control de riesgo de stop loss.
Principio de estrategia
La lógica central de esta estrategia se basa en el sistema de doble recorrido equilíneo. En concreto, utiliza los siguientes indicadores técnicos:
- Media móvil simple ((SMA): toma el promedio aritmético de los precios de cierre de los últimos n días, que refleja el precio promedio de los últimos períodos.
- Media móvil ponderada ((VWMA): media ponderada de los precios de cierre de los últimos n días, que otorga más peso a los precios recientes y responde más rápidamente a los cambios de precios.
Los parámetros rápidos de SMA en la doble línea media tienen una configuración más corta para responder rápidamente a los cambios en los precios; los parámetros lentos de VWMA son más largos y tienen un efecto de reflujo. Cuando las tendencias a corto y largo plazo se mueven en la misma dirección, el SMA rápido hacia arriba cruza el VWMA lento para generar una señal de compra; cuando cruza hacia abajo, genera una señal de venta.
La estrategia también establece un mecanismo de suspensión de pérdidas. Cuando el precio se mueve en una dirección adversa, se detiene a tiempo para controlar el riesgo.
Análisis de las ventajas
- Responder rápidamente a los cambios en las tendencias del mercado
- La retirada está controlada y los mecanismos de detención de pérdidas controlan el riesgo
- La implementación es sencilla, intuitiva y fácil de entender
- Se puede optimizar para adaptarse a diferentes entornos de mercado mediante la adaptación de los parámetros
Análisis de riesgos
- Las estrategias de doble línea media son propensas a generar falsas señales en mercados de múltiples cabezas.
- La elección de los parámetros adecuados puede resultar en pérdidas
- En ocasiones, puede haber dolores de cabeza por los daños ocasionados por eventos repentinos en el Markt.
Los métodos para controlar el riesgo:
- Confirmación mediante el uso de indicadores de filtración de tendencias
- Ajuste de los parámetros de optimización
- Adoptar estrategias de detener las pérdidas y controlar las pérdidas individuales
Dirección de optimización
La estrategia puede ser optimizada en los siguientes aspectos:
- Confirmación en combinación con otros indicadores técnicos, como RSI, líneas de Brin, etc., para mejorar la precisión de la señal
- Optimización de la longitud de los parámetros de la línea media, ajustando los parámetros en función de los diferentes períodos
- Combinación de indicadores de volumen de transacción para realizar transacciones en puntos de entrada y salida de energía masiva
- Ajuste de los parámetros de acuerdo con los resultados de la medición y seleccione los parámetros óptimos
- Utiliza un stop loss dinámico para ajustar el punto de parada en función de la volatilidad del mercado
Resumir
La estrategia en su conjunto es una estrategia de seguimiento de tendencias muy práctica. Utiliza un simple y intuitivo cruce de doble línea media para generar señales de negociación, y puede capturar eficazmente los cambios en las tendencias del mercado mediante la combinación de la línea media rápida y la línea media lenta. El mecanismo de stop loss también lo hace con un buen control de riesgo.
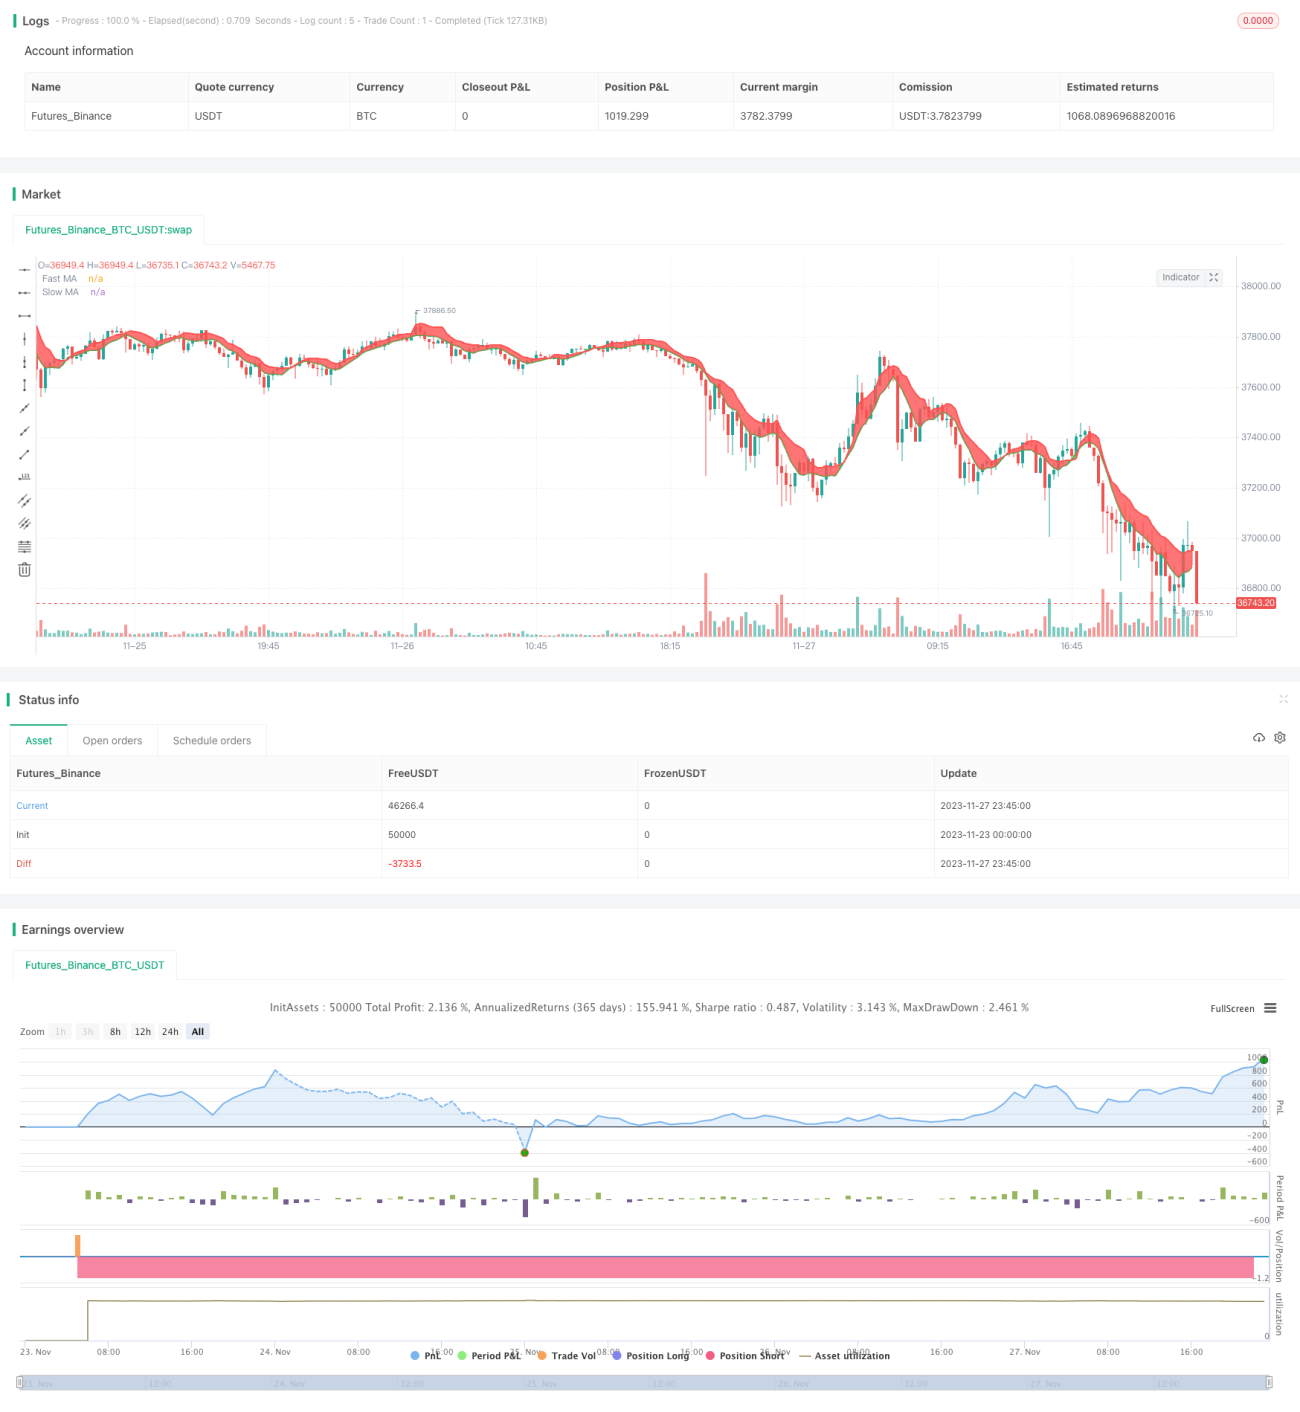
/*backtest
start: 2023-11-23 00:00:00
end: 2023-11-28 00:00:00
period: 15m
basePeriod: 5m
exchanges: [{"eid":"Futures_Binance","currency":"BTC_USDT"}]
*/

//@version=4
//strategy(title="Bitlinc Entry v0.1 VWMA / SMA / MRSI SQQQ 94M", overlay=true, initial_capital=10000, currency='USD')

strategy(title="Bitlinc Entry v0.1 VWMA / SMA / MRSI SQQQ 94M", overlay=true)- 1