Estrategia de Triple SuperTrend y Stoch RSI

Resumen
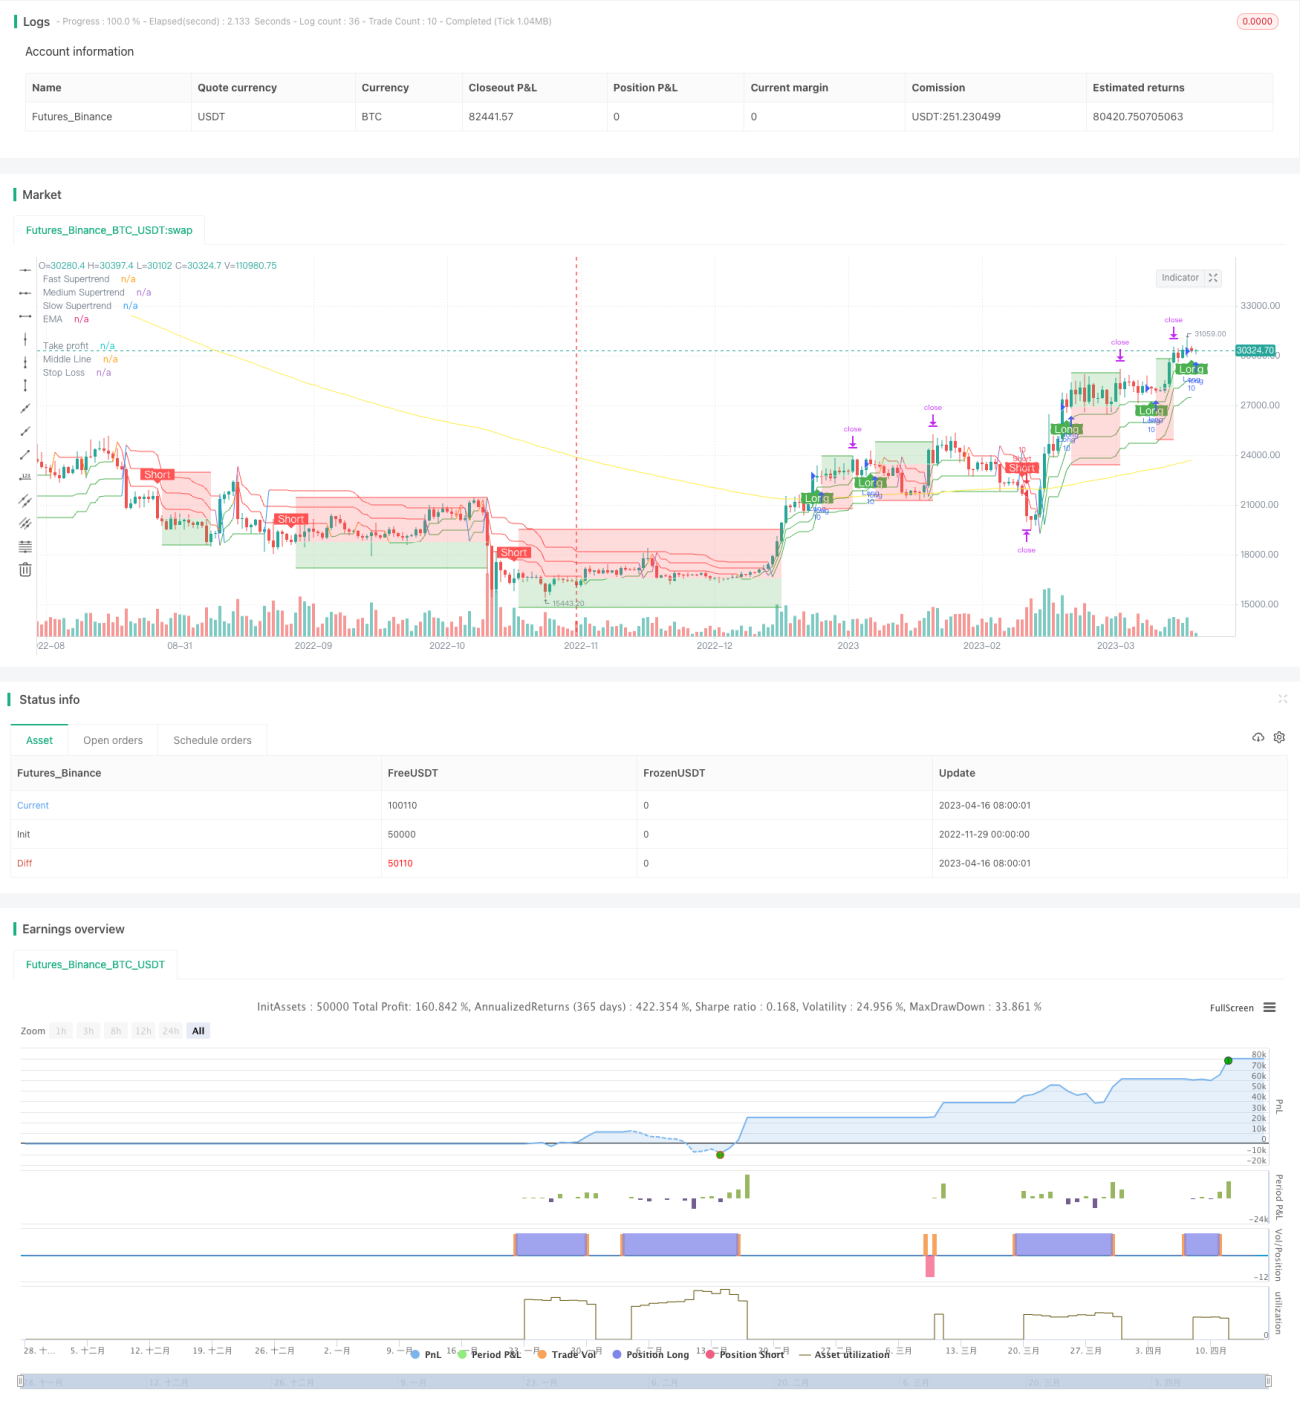
La estrategia Triple SuperTrend y Stoch RSI es una estrategia de trading cuantitativa que combina el seguimiento de tendencias en múltiples marcos temporales con indicadores de sobrecompra y sobreventa. Esta estrategia utiliza tres conjuntos de indicadores SuperTrend con diferentes parámetros para determinar la tendencia del mercado y combina las señales de sobrecompra/sobreventa del indicador Stoch RSI para generar señales de trading. En la práctica, cuando los dos indicadores SuperTrend más rápidos emiten simultáneamente una señal de compra/venta y el indicador Stoch RSI confirma dicha señal, se ejecuta una operación de compra/venta correspondiente.
Principio de la Estrategia
La lógica central de la estrategia Triple SuperTrend y Stoch RSI consiste en combinar indicadores SuperTrend con diferentes parámetros y el indicador Stoch RSI para filtrar las señales de trading, mejorando así la calidad de las señales y reduciendo la tasa de señales falsas.
En primer lugar, la estrategia utiliza tres grupos de indicadores SuperTrend con diferentes parámetros para determinar la tendencia principal del mercado. Estos tres grupos tienen configuraciones de parámetros distintas, con marcos temporales que van desde rápidos hasta lentos, para capturar cambios de tendencia en diferentes niveles. Cuando los dos indicadores SuperTrend más rápidos (rápido y medio) emiten simultáneamente una señal de compra/venta, se considera preliminarmente que la señal tiene cierta fiabilidad.
En segundo lugar, la estrategia introduce el indicador Stoch RSI para evaluar si la señal se encuentra en condiciones de sobrecompra o sobreventa excesiva. El indicador Stoch RSI combina las ventajas del RSI y del estocástico, permitiendo determinar eficazmente si el mercado está en sobrecompra o sobreventa. Si la señal de los dos SuperTrend más rápidos coincide con la señal del Stoch RSI, se emite la señal final de compra/venta.
Mediante la combinación de múltiples indicadores y múltiples marcos temporales, la estrategia Triple SuperTrend y Stoch RSI puede filtrar eficazmente el ruido del mercado, mejorar la fiabilidad de las señales y reducir la ocurrencia de operaciones erróneas.
Ventajas de la Estrategia
La mayor ventaja de la estrategia Triple SuperTrend y Stoch RSI radica en la combinación efectiva de múltiples indicadores y marcos temporales, lo que aporta los siguientes beneficios:
-
Reducción de señales de trading erróneas. La combinación de tres indicadores SuperTrend y el Stoch RSI reduce significativamente las señales de ruido y las señales falsas propias de un solo indicador.
-
Mejora de la proporción de señales rentables. Aunque la frecuencia de las señales disminuye, la proporción de señales rentables aumenta notablemente.
-
Adecuada para mercados con tendencia. El filtrado en múltiples marcos temporales favorece la captura de tendencias de mediano y largo plazo, siendo adecuada para entornos de mercado con tendencias claras.
-
Fácil de optimizar mediante ajuste de parámetros. La presencia de tres indicadores ofrece un amplio espacio para la optimización de parámetros.
-
Posibilidad de ajustar parámetros según el estilo personal. Se pueden modificar libremente los parámetros para que la estrategia se adapte mejor al estilo de trading propio.
Riesgos de la Estrategia
La estrategia Triple SuperTrend y Stoch RSI también presenta ciertos riesgos, concentrados principalmente en los siguientes aspectos:
-
Reducción de la frecuencia de señales. El mecanismo de filtrado multicapa reduce significativamente la frecuencia de trading.
-
Facilidad para perder algunas señales. El carácter conservador de la estrategia puede hacer que se pierdan algunas oportunidades potenciales.
-
Mayor dependencia de parámetros debido a múltiples indicadores. Cuantos más indicadores y parámetros, mayor es la dificultad de optimización de la estrategia.
-
Capacidad de seguimiento limitada. La combinación de múltiples marcos temporales también limita la flexibilidad de la estrategia para seguir la tendencia.
Para mitigar los riesgos anteriores, se puede optimizar ajustando los parámetros de los indicadores, introduciendo indicadores auxiliares adicionales, etc., de modo que la estrategia, mientras controla el riesgo, logre una mayor calidad de ganancias.
Direcciones de Optimización de la Estrategia
La estrategia Triple SuperTrend y Stoch RSI aún tiene margen de mejora, principalmente en los siguientes aspectos:
-
Ajustar la combinación de parámetros de los indicadores para encontrar la mejor coincidencia. Se pueden probar más conjuntos de parámetros de indicadores para encontrar los parámetros óptimos.
-
Agregar estrategias de stop loss y take profit para controlar el riesgo por operación. Esto puede mejorar significativamente la estabilidad de la estrategia.
-
Introducir más indicadores para la validación de señales. Por ejemplo, incorporar indicadores de volumen para un análisis multifacético.
-
Añadir funciones adaptativas. Permitir que la estrategia optimice y ajuste automáticamente los parámetros para adaptarse a los cambios del mercado.
-
Combinar algoritmos de aprendizaje automático para la predicción. Utilizar algoritmos de IA para predecir la precisión de las señales de los indicadores.
Mediante una optimización continua, la estrategia Triple SuperTrend y Stoch RSI puede convertirse en una estrategia de trading cuantitativa estable y eficiente, generando un Alpha considerable.
Conclusión
La estrategia Triple SuperTrend y Stoch RSI integra con éxito el análisis de múltiples marcos temporales con la evaluación de sobrecompra/sobreventa, conformando una estrategia de trading de seguimiento de tendencia única. Combina las ventajas del seguimiento de tendencias y el filtrado de indicadores, reduciendo las señales de ruido y aumentando la proporción de señales rentables. Aunque la estrategia aún presenta riesgos y espacio de optimización, mediante el ajuste de parámetros y la optimización de la estrategia, su rentabilidad y estabilidad pueden mejorarse aún más. En general, la estrategia Triple SuperTrend y Stoch RSI ofrece una opción de alta calidad para la práctica del trading cuantitativo.
- 1