Dual Moving Average Crossover Trend Strategy

Overview
The Dual Moving Average Crossover Trend strategy is a trading strategy based on moving averages. It uses the crossover of fast EMA and slow SMA lines as buy and sell signals, and combines the MACD indicator divergence to filter signals. The strategy considers multiple factors such as price, trend and momentum, forming a relatively complete trading system.
Strategy Principle
The strategy uses two moving averages, EMA with length of 200 days and SMA with length of 100 days. When the price breaks through both lines upwards, a buy signal is generated. When the price breaks through both lines downwards, a sell signal is generated. This can effectively filter oscillating trends and short-term pullbacks.
To further improve the reliability of signals, the MACD indicator is also introduced. When the price breaks through the EMA and SMA to form a signal, the fast line of the MACD needs to break through the slow line from below, and the MACD histogram needs to be above the 0 axis, to trigger a real buy signal. Conversely, when the fast line of the MACD breaks through the slow line from above, and the MACD histogram is below the 0 axis, it will trigger a real sell signal.
In addition, stop loss and take profit are set in the strategy. After the strategy opens a position, the stop loss point and take profit point will be calculated and set according to the percentage set by the user. This can effectively control the risk of a single trade.
In summary, this strategy comprehensively considers multiple indicators, sets strict filtering conditions for buy and sell signals, and adopts stop loss and take profit to manage risks, forming a relatively rigorous and complete trading system.
Advantage Analysis
The Dual Moving Average Crossover Trend strategy has the following advantages:
-
Combining multiple indicators, comprehensively considering price, trend and momentum, and setting strict filtering conditions for signals can effectively avoid false signals and improve signal reliability.
-
The use of two moving averages with different parameters can better identify market trends and filter oscillating markets. The fast EMA line is used to timely track price changes; the slow SMA line is used to determine long-term trends. The combination of the two lines works better.
-
The MACD indicator introduces customizable parameters that can be adjusted according to the characteristics of different markets and has high flexibility. The settings of the MACD ensure that trading signals are supported by price, trend and momentum at the same time, thus having very strong application value.
-
Setting stop loss and take profit points can maximize control over single trade losses and avoid excessive losses. Reasonable percentage settings for profit taking can lock in partial profits and reduce market risk exposure after making profits.
-
The parameters of this strategy can be flexibly set, and the strategy can be adjusted based on optimization results, which is very practical. There is ample space for testing and optimizating different markets and parameters.
Risk Analysis
The Dual Moving Average Crossover Trend Strategy also has some risks, mainly in the following areas:
-
When the stock price shows violent fluctuations, EMA and SMA may cross falsely for many times, resulting in frequent opening and closing of trading signals. This will increase the frequency of trading and the expenditure of commissions.
-
MACD indicators may have false breakouts, especially in the process when the momentum is still unclear. In this case, the signal is also unreliable, which may cause unnecessary losses.
-
The position and ratio of stop loss settings have a great influence on profit and loss results. If the stop loss is set too small, there is a risk of being caught; if the stop loss is set too large, the single loss may be too heavy. This requires sufficient testing to find the optimal parameters.
-
As a trend tracking indicator, the effectiveness of moving average will be discounted when prices reverse rapidly. The strategy may not have time to stop loss before being hit by the price reversal, causing greater losses.
The corresponding solutions are as follows:
-
For volatile markets, appropriately adjust parameters of moving averages, using lower parameter EMAs and SMAs to reduce crossover frequency.
-
Increase filtering conditions such as MACD breaking above and below the zero line, which can reduce false breakouts to some extent. Combining other indicators such as KDJ and BOLL can also be considered.
-
The setting of stop loss position and ratio needs sufficient backtesting and optimization to find the optimal parameters. On this basis, continuous monitoring and dynamic adjustment should also be considered.
-
Mechanisms can be set up to identify rapid price reversals. When abnormal reversals are spotted, emergency measures can be taken such as reducing positions or suspending trading strategies to control risk exposure.
Optimization Directions
There is still room for further optimization of the Dual Moving Average Crossover Trend strategy, mainly in the following aspects:
-
Test more indicators for combination to find better parameters, such as incorporating the BOLL channel and considering the impact of volatility.
-
Optimize parameters of moving average lengths to find the best parameter combination under different market conditions. Rolling parameter optimization is also an option.
-
Set up more scientific and reasonable stop loss and take profit strategies, such as introducing trailing stop loss, or setting dynamic risk-reward ratios based on historical statistical results. This can further improve the stability of the strategy.
-
Establish mechanisms for automatic identification and emergency response of abnormal price reversals. In extreme market conditions, proactively reduce positions or suspend strategies to avoid huge losses.
-
Expand trading varieties such as foreign exchange, cryptocurrencies and other varieties. Test robustness of parameters across different varieties to expand applicability of the strategy.
-
Optimize capital management strategies of the strategy, such as fixed amount trading, fixed position ratio, etc. Control single trade loss risk, making the overall capital curve more stable.
Conclusion
The Dual Moving Average Crossover Trend Strategy comprehensively considers multiple factors. When generating trading signals, it requires support from multiple indicators such as price, trend and momentum to ensure signal reliability. The strategy also adopts moving stop loss and take profit to effectively control risks of individual trades. The flexible parameter settings of the strategy make it highly practical for automated trading.
However, no strategy can be perfect. This strategy will also encounter some difficulties in application, such as frequent trading, false breakouts, stop loss positioning, etc. To further enhance the robustness and profitability of the strategy, efforts need to be made in many aspects, including optimizing parameter portfolios, introducing new technical indicators, improving the stop loss mechanism, and so on.
In summary, the Dual Moving Average Crossover Trend Strategy forms a relatively complete and rigorous trading system. Through continuous optimization and improvement in future research and application, the strategy has the potential to achieve greater practical value.
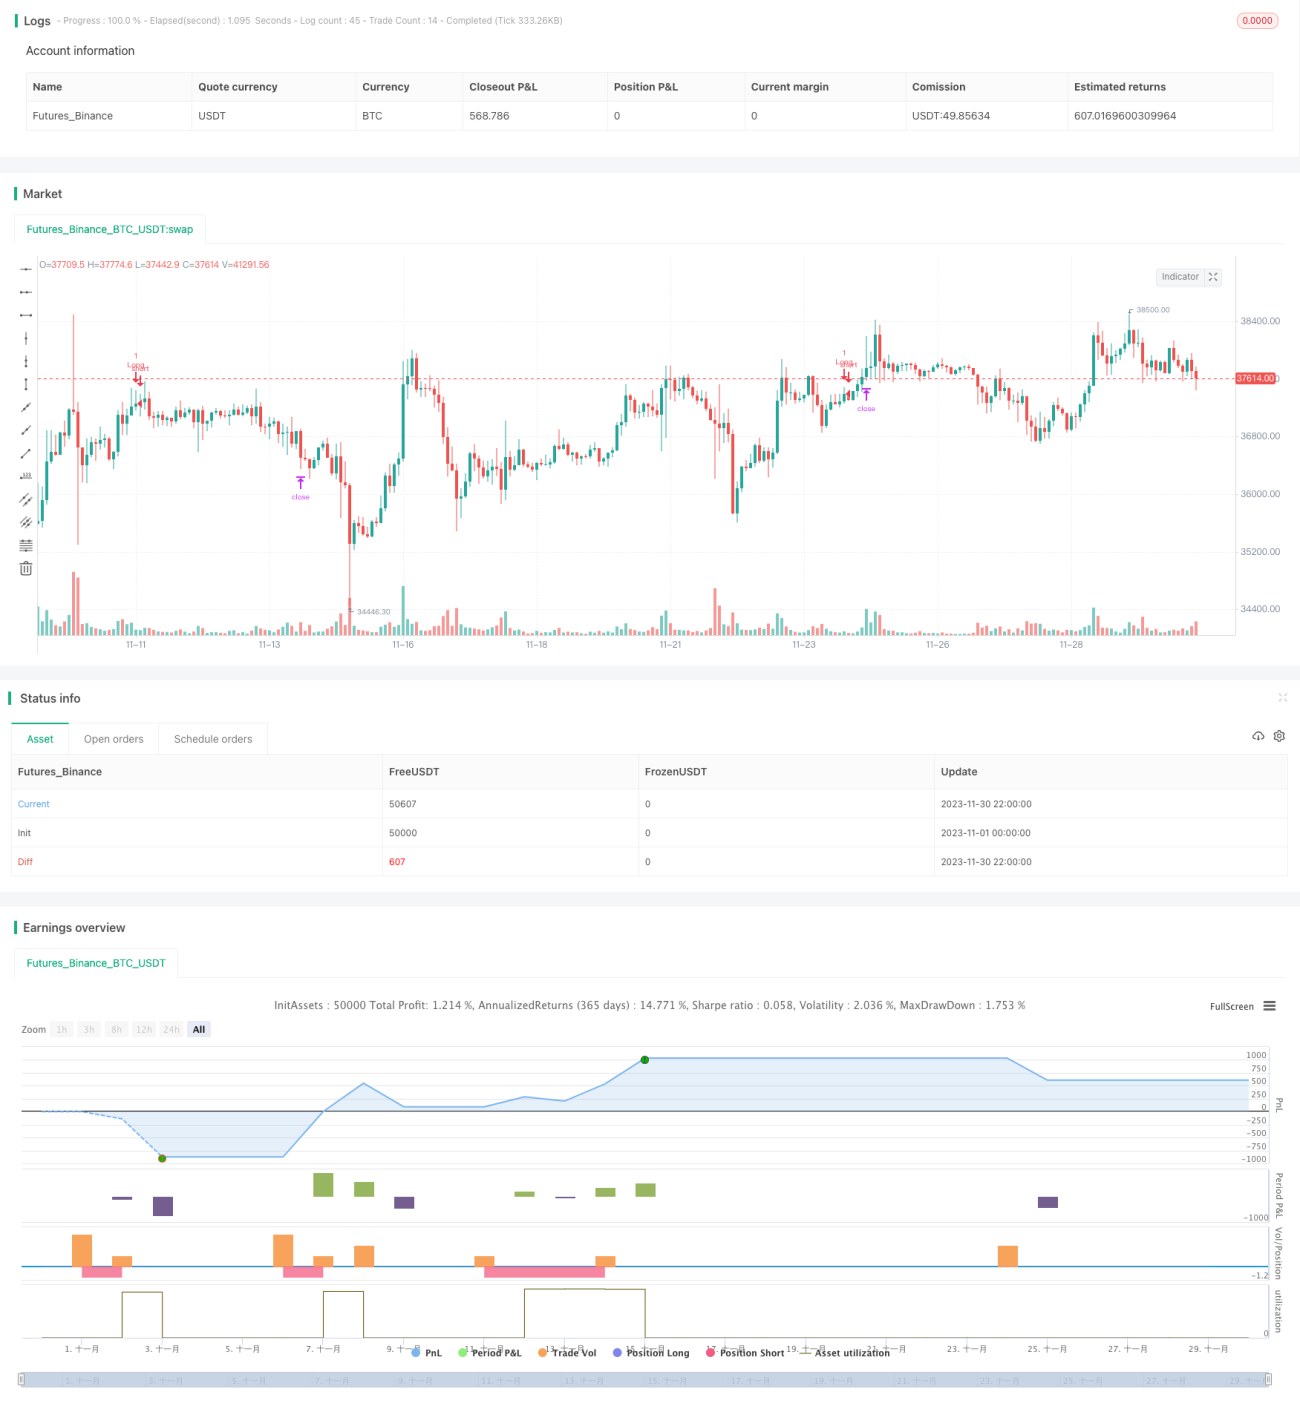
/*backtest
start: 2023-11-01 00:00:00
end: 2023-11-30 23:59:59
period: 2h
basePeriod: 15m
exchanges: [{"eid":"Futures_Binance","currency":"BTC_USDT"}]
*/

//@version=4
// Hi,
// This is my first strategy made by myself(except for the MACD indicator). I'm publishing this to get myself out there and for some newer people to see how a basic strategy works. All credits go to Zen&TheArtofTrading, for teaching me almost everything I know about Pinescript
// The strategy is basically an MACD crossover trend strategy. If the MACD line crosses the signal line upward, above the zero point of the histogram, while the price is above 200 EMA and 100 SMA it's a buy signal- 1