STARC Channel Backtest Strategy

Overview
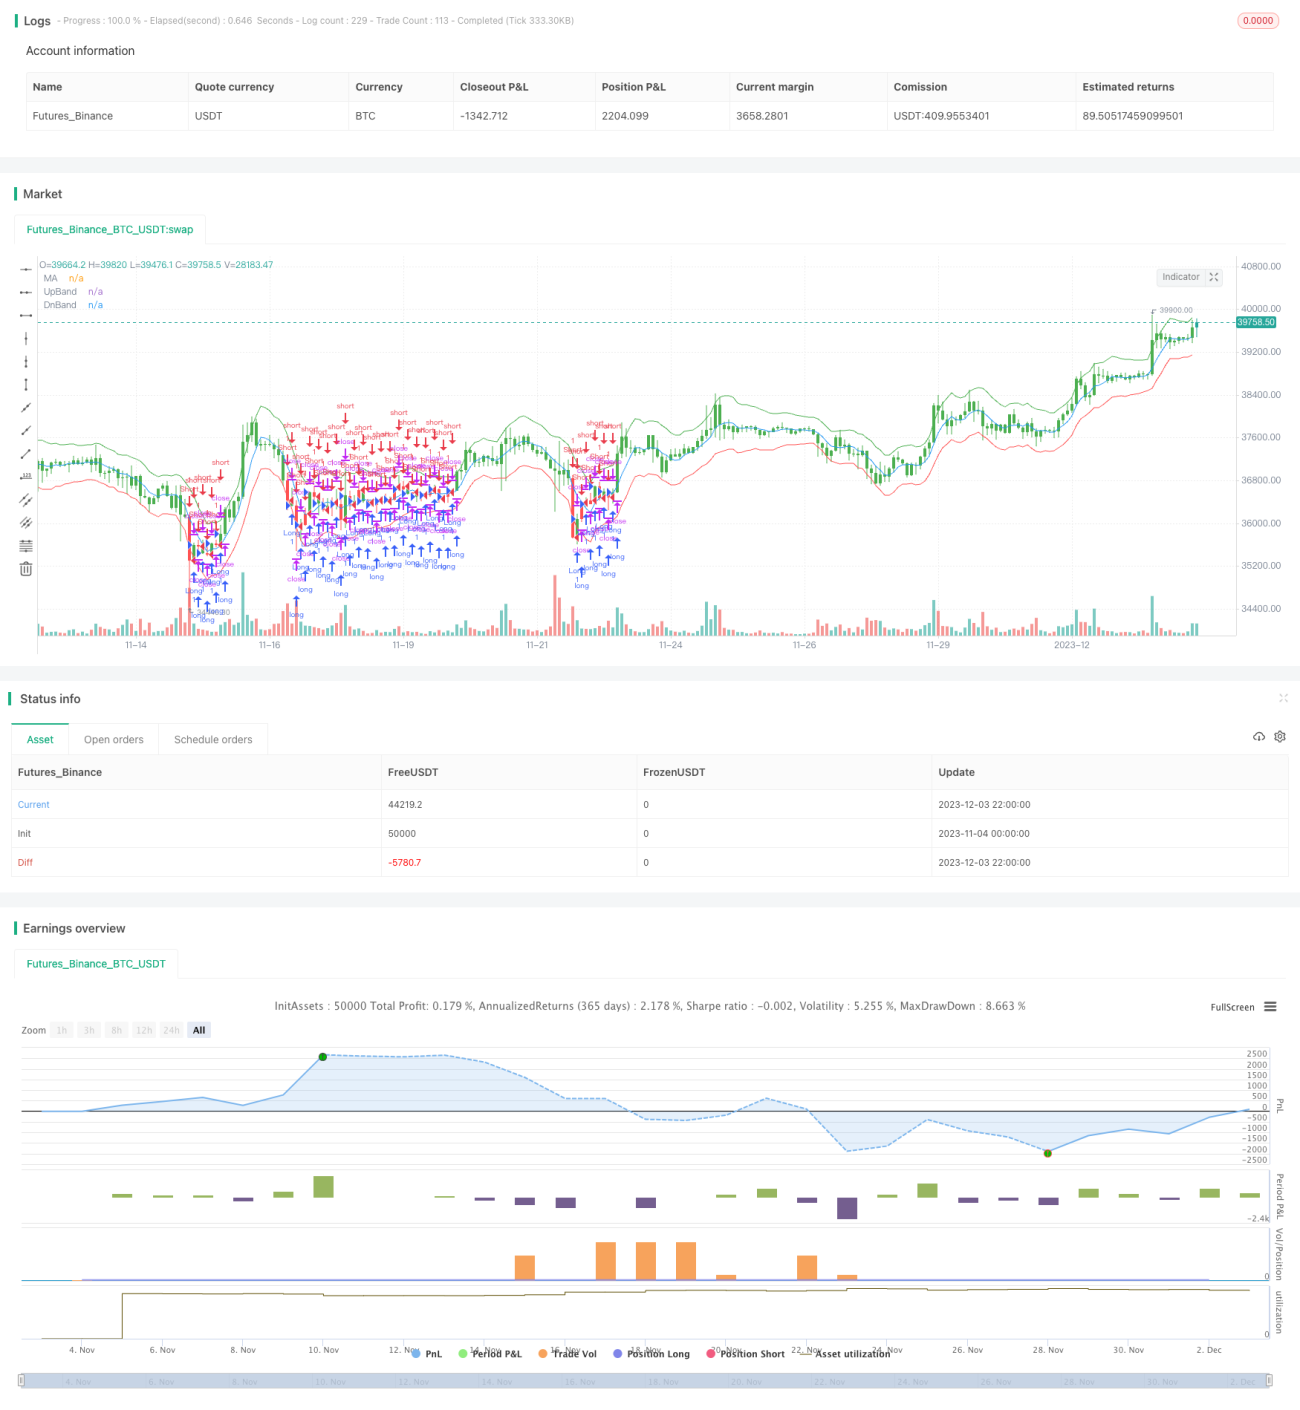
The STARC Channel Backtest Strategy is a quantitative trading strategy based on the STARC indicator. The strategy constructs the upper and lower STARC channels to generate breakout buy and sell trading signals. It also incorporates long and short position switching mechanisms to adapt to different market environments.
Strategy Principle
The core of the STARC Channel Backtest Strategy is the STARC indicator, which includes:
- Baseline: n-day simple moving average SMA
- Upper band: SMA + K × Average True Range ATR
- Lower band: SMA - K × ATR
It generates a buy signal when the closing price breaks through the upper band, and a sell signal when the closing price breaks through the lower band.
The strategy calculates the upper and lower rails of the STARC channel daily and judges if the closing price breaks through them to generate trading signals. It also sets a reverse parameter to switch between long and short positions to adapt to different market conditions.
Advantage Analysis
The STARC Channel Backtest Strategy has the following advantages:
- Construct upper and lower channels with the STARC indicator, good backtesting results;
- Built-in long and short position switching mechanisms to adapt to various market environments;
- Flexible parameter settings, both K values and moving average lengths can be adjusted and optimized;
- Clear and easy-to-understand strategy rules that are easy to understand and implement;
- Visualized indicators to intuitively judge market positions.
Risk Analysis
The STARC Channel Backtest Strategy also has some risks:
- The STARC indicator is often used for medium-long term trading, and short-term results may not be optimal;
- Breakout trading is prone to getting caught in whipsaws which requires strict stop losses;
- Improper reverse parameter settings can lead to excessive frequent trading;
- Improper parameter optimization can lead to curve fitting.
The following measures should be taken to mitigate risks:
- Select appropriate trading cycles, such as daily and other medium-long term cycles;
- Set reasonable stop loss positions to control single trade losses;
- Carefully set reverse parameters to avoid excessive switching of positions;
- Multi-parameter optimization to prevent overfitting.
Optimization Directions
The main optimization directions for the STARC Channel Backtest Strategy include:
- Parameter optimization: adjust moving average lengths, K values, ATR cycles and other parameters to find the optimal parameter combination;
- Add stop loss mechanisms: set trailing stop loss, time stop loss, percentage stop loss etc. to control risks;
- Incorporate other indicators: add trading volume, Bollinger Bands etc. for filtration to improve efficiency;
- Dynamically adjust parameters: automatically optimize and adjust parameters based on market changes to improve stability.
These optimization directions can improve the strategy's return and stability while controlling risks.
Conclusion
The overall effect of the STARC Channel Backtest Strategy is good. It implements medium-long term breakout trading based on the STARC indicator. The advantage of the strategy is using the STARC channel to generate stable trading signals, while setting reverse mechanisms to adapt to market changes. We also need to mitigate risks by setting stop losses and optimizing parameters to make the strategy more stable and efficient. In general, this strategy is an effective tool for medium-long term breakout trading.
/*backtest
start: 2023-11-04 00:00:00
end: 2023-12-04 00:00:00
period: 2h
basePeriod: 15m
exchanges: [{"eid":"Futures_Binance","currency":"BTC_USDT"}]
*/

//@version=2
////////////////////////////////////////////////////////////
//  Copyright by HPotter v1.0 23/04/2018
// A type of technical indicator that is created by plotting two bands around - 1