Momentum Price Channel Opening and Closing Strategy

Author: ChaoZhang, Date: 2023-12-06 16:44:32
Tags:

img

Overview

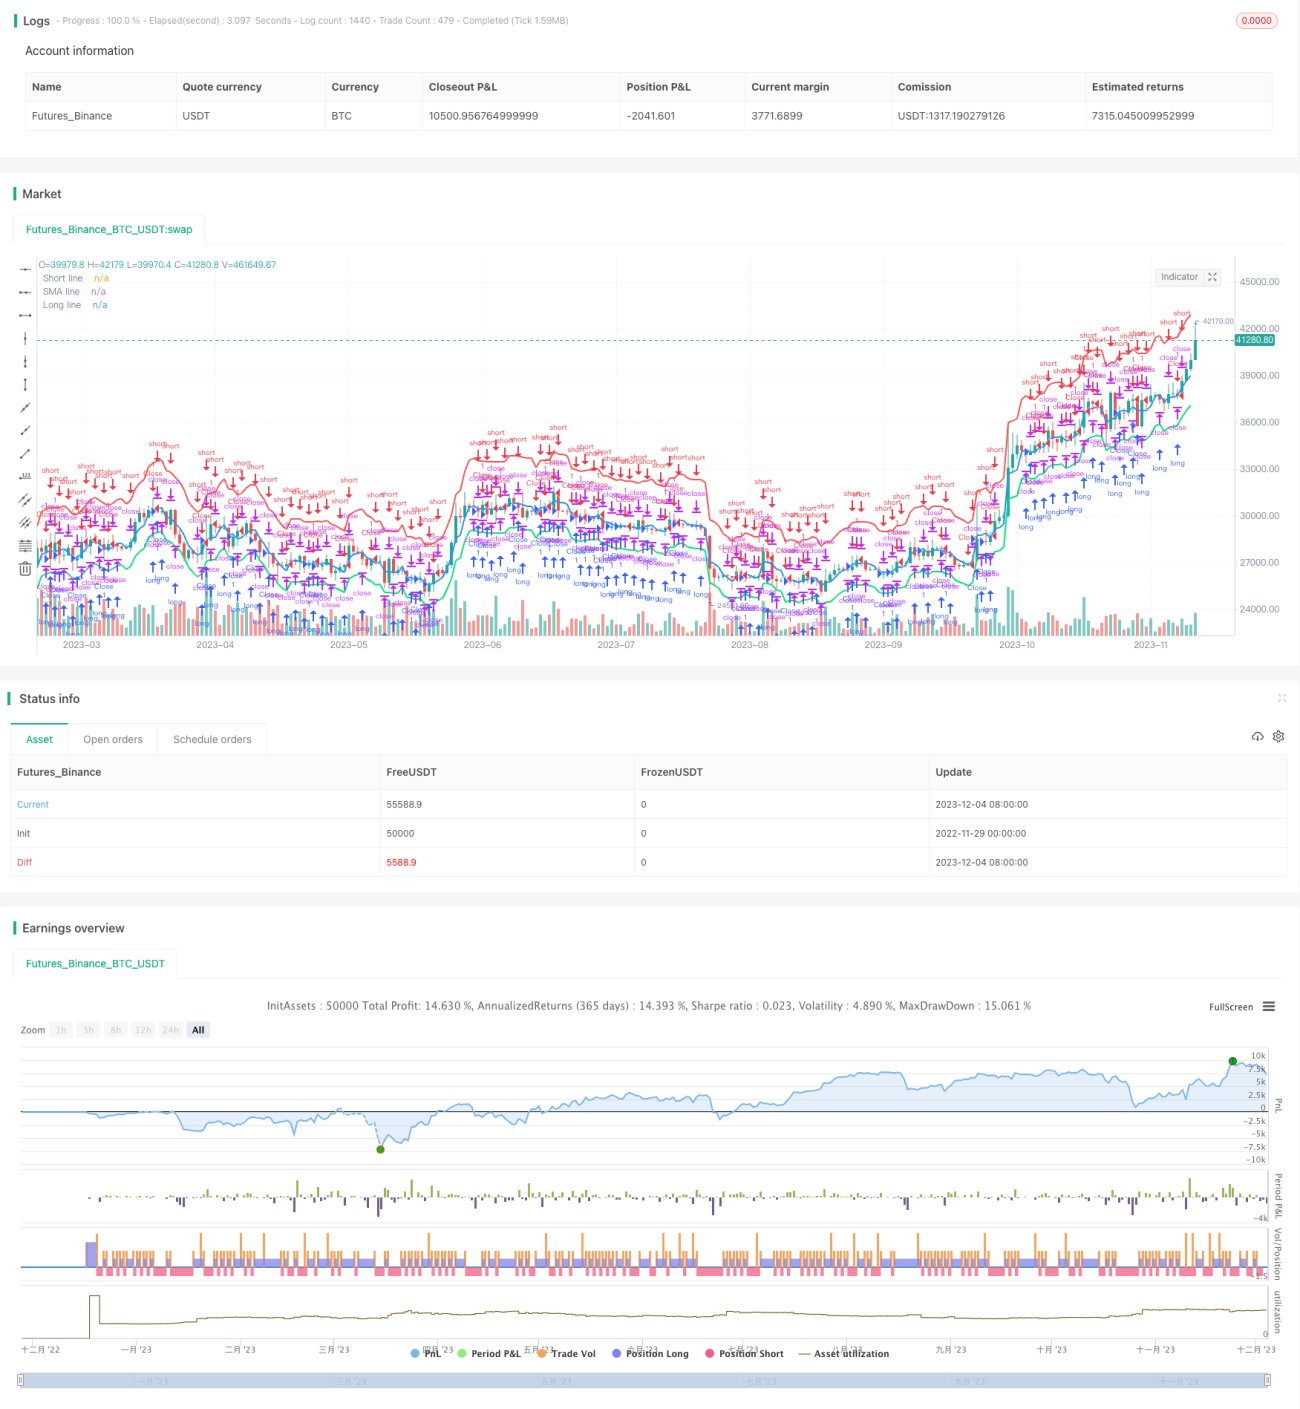
This strategy is based on the price channel indicator. By setting a momentum parameter, it calculates the mean value of the highest and lowest prices in different cycles to form the median line of the price channel, and sets long and short lines based on this. When the price breaks through the long line, it goes long; when the price breaks through the short line, it goes short. The closing condition is that the price regresses to the channel midline.

Strategy Principle

This strategy uses the price channel indicator to calculate the mean value of the highest and lowest prices in different cycles to form the channel midline. Based on the midline, long and short lines are set through the shift parameter. Specifically, the long line calculation formula is: midline + (midline × long line parameter%); the short line calculation formula is: midline + (midline × short line parameter%).

When the price is lower than the long line, open long positions with limit orders; when the price is higher than the short line, open short positions with limit orders. The stop loss method for long and short positions is the price regressing to the channel midline.

Advantage Analysis

The strategy has the following advantages:

  1. Using the price channel indicator can effectively capture price trends and key support/resistance levels.
  2. Opening positions on breakouts can reduce losses from false breakouts.
  3. The stop loss method directly takes the price channel midline as the standard to avoid excessive losses from chase stops.

Risk Analysis

The strategy also has some risks:

  1. Improper parameter settings of the price channel may miss active trends or generate too many false breakouts.
  2. Breakout opening methods incur a certain degree of slippage costs.
  3. Unable to stop loss in time during rapid price retracements.

The above risks can be mitigated by optimizing parameters, setting stop loss orders, or combining other indicators for judgment.

Optimization Directions

The strategy can be optimized in the following aspects:

  1. Optimize the parameters of the price channel to find the best combination.
  2. Try different opening methods such as candlestick patterns and indicator signals.
  3. Add stop loss order settings to prevent losses from rapid price drops.
  4. Combine trading volume, volatility and other indicators to avoid false breakouts in the stock market.

Conclusion

The design idea of this strategy based on the price channel indicator is clear. Using breakout to open positions can effectively control risks. But there are also large parameter optimization spaces and stop loss mechanisms that need to be improved. Overall, the strategy has a certain practical value and is worth further testing and optimization.


/*backtest
start: 2022-11-29 00:00:00
end: 2023-12-05 00:00:00
period: 1d
basePeriod: 1h
exchanges: [{"eid":"Futures_Binance","currency":"BTC_USDT"}]
*/

//Noro
//2018

//@version=3
strategy(title = "Noro's PCMA Strategy v1.0", shorttitle = "PCMA 1.0", overlay = true, default_qty_type = strategy.percent_of_equity, default_qty_value = 100, pyramiding = 0)

//Settings
needlong = input(true, defval = true, title = "Long")
needshort = input(true, defval = true, title = "Short")
capital = input(100, defval = 100, minval = 1, maxval = 10000, title = "Lot, %")
per = input(3, title = "Length")
shortlevel = input(10.0, title = "Short line (red)")
longlevel = input(-5.0, title = "Long line (lime)")
fromyear = input(1900, defval = 1900, minval = 1900, maxval = 2100, title = "From Year")
toyear = input(2100, defval = 2100, minval = 1900, maxval = 2100, title = "To Year")
frommonth = input(01, defval = 01, minval = 01, maxval = 12, title = "From Month")
tomonth = input(12, defval = 12, minval = 01, maxval = 12, title = "To Month")
fromday = input(01, defval = 01, minval = 01, maxval = 31, title = "From day")
today = input(31, defval = 31, minval = 01, maxval = 31, title = "To day")

//Price Channel
h = highest(high, per)
l = lowest(low, per)
c = (h + l) / 2
ll = c + ((c / 100) * longlevel)
sl = c + ((c / 100) * shortlevel)

//Lines
shortcolor = needshort ? red : na
longcolor = needlong ? lime : na
plot(sl, linewidth = 2, color = shortcolor, title = "Short line")
plot(c, linewidth = 2, color = blue, title = "SMA line")
plot(ll, linewidth = 2, color = longcolor, title = "Long line")

//Trading
size = strategy.position_size
lot = 0.0
lot := size == 0 ? strategy.equity / close * capital / 100 : lot[1]

if (not na(close[per])) and size == 0 and needlong
    strategy.entry("L", strategy.long, lot, limit = ll, when = (time > timestamp(fromyear, frommonth, fromday, 00, 00) and time < timestamp(toyear, tomonth, today, 23, 59)))
    
if (not na(close[per])) and size == 0 and needshort
    strategy.entry("S", strategy.short, lot, limit = sl, when = (time > timestamp(fromyear, frommonth, fromday, 00, 00) and time < timestamp(toyear, tomonth, today, 23, 59)))
    
if (not na(close[per])) and size > 0 
    strategy.entry("Close", strategy.short, 0, limit = c, when = (time > timestamp(fromyear, frommonth, fromday, 00, 00) and time < timestamp(toyear, tomonth, today, 23, 59)))
    
if (not na(close[per])) and size < 0 
    strategy.entry("Close", strategy.long, 0, limit = c, when = (time > timestamp(fromyear, frommonth, fromday, 00, 00) and time < timestamp(toyear, tomonth, today, 23, 59)))

if time > timestamp(toyear, tomonth, today, 23, 59)
    strategy.close_all()

More