Dual EMA Crossover Strategy

Overview
The Dual EMA Crossover strategy is a commonly used trend following strategy. It uses two EMA lines with different periods and generates buy signals when the shorter period EMA crosses over the longer period EMA and sell signals when the reverse happens, in order to capture trend changes.
Strategy Logic
The core logic of this strategy is based on the “golden cross” and “death cross” principles of EMA lines. EMA can smooth price data effectively and indicate trend direction. The shorter period EMA responds more quickly to price changes while the longer period EMA is less sensitive to noise and reflects long term trend. When the shorter period EMA crosses over the longer period EMA, it is viewed as a signal that the upside momentum is strengthening. When the reverse happens, it signals accelerating downside momentum. The strategy generates trading signals based on this rationale.
Specifically, this strategy uses the length1 and length2 parameters to set the periods of two EMA lines. demaVal1 is the length1 period EMA and demaVal2 is the length2 period EMA. They are calculated as:
demaVal1 = EMA(close, length1)
demaVal2 = EMA(close, length2)
Where EMA() is the function that calculates the EMA values. When demaVal1 crosses over demaVal2, the buy signal demaCrossover is generated. When the reverse happens, the sell signal demaCrossunder is generated. The strategy sends trading orders based on these two signals.
Advantages
The advantages of this strategy include:
- Simple logic and easy to implement.
- Mature theories of EMA crossovers with wide applications.
- Flexible parameter tuning adaptable to different market environments.
- Further optimization possible to improve strategy performance.
Risks and Enhancement
There are also some risks associated with this strategy:
- Frequent false signals may occur when the market is not trending.
- Default parameters may not fit all instruments and historical optimization is needed.
Based on the above risks, the following aspects could be optimized:
- Adjust EMA period parameters to adapt to market conditions with different cycles.
- Add filter conditions to avoid false signals, e.g. fitness score, volume indicators.
- Incorporate other techniques like trends, support/resistance levels to improve strategy performance.
Conclusion
In conclusion, the Dual EMA Crossover Strategy is a simple yet practical trend following system. By inheriting the mature theories of EMA analysis and with proper parameter tuning and filter condition enhancements, it can be applied to trend trading across different instruments with sound application prospects.
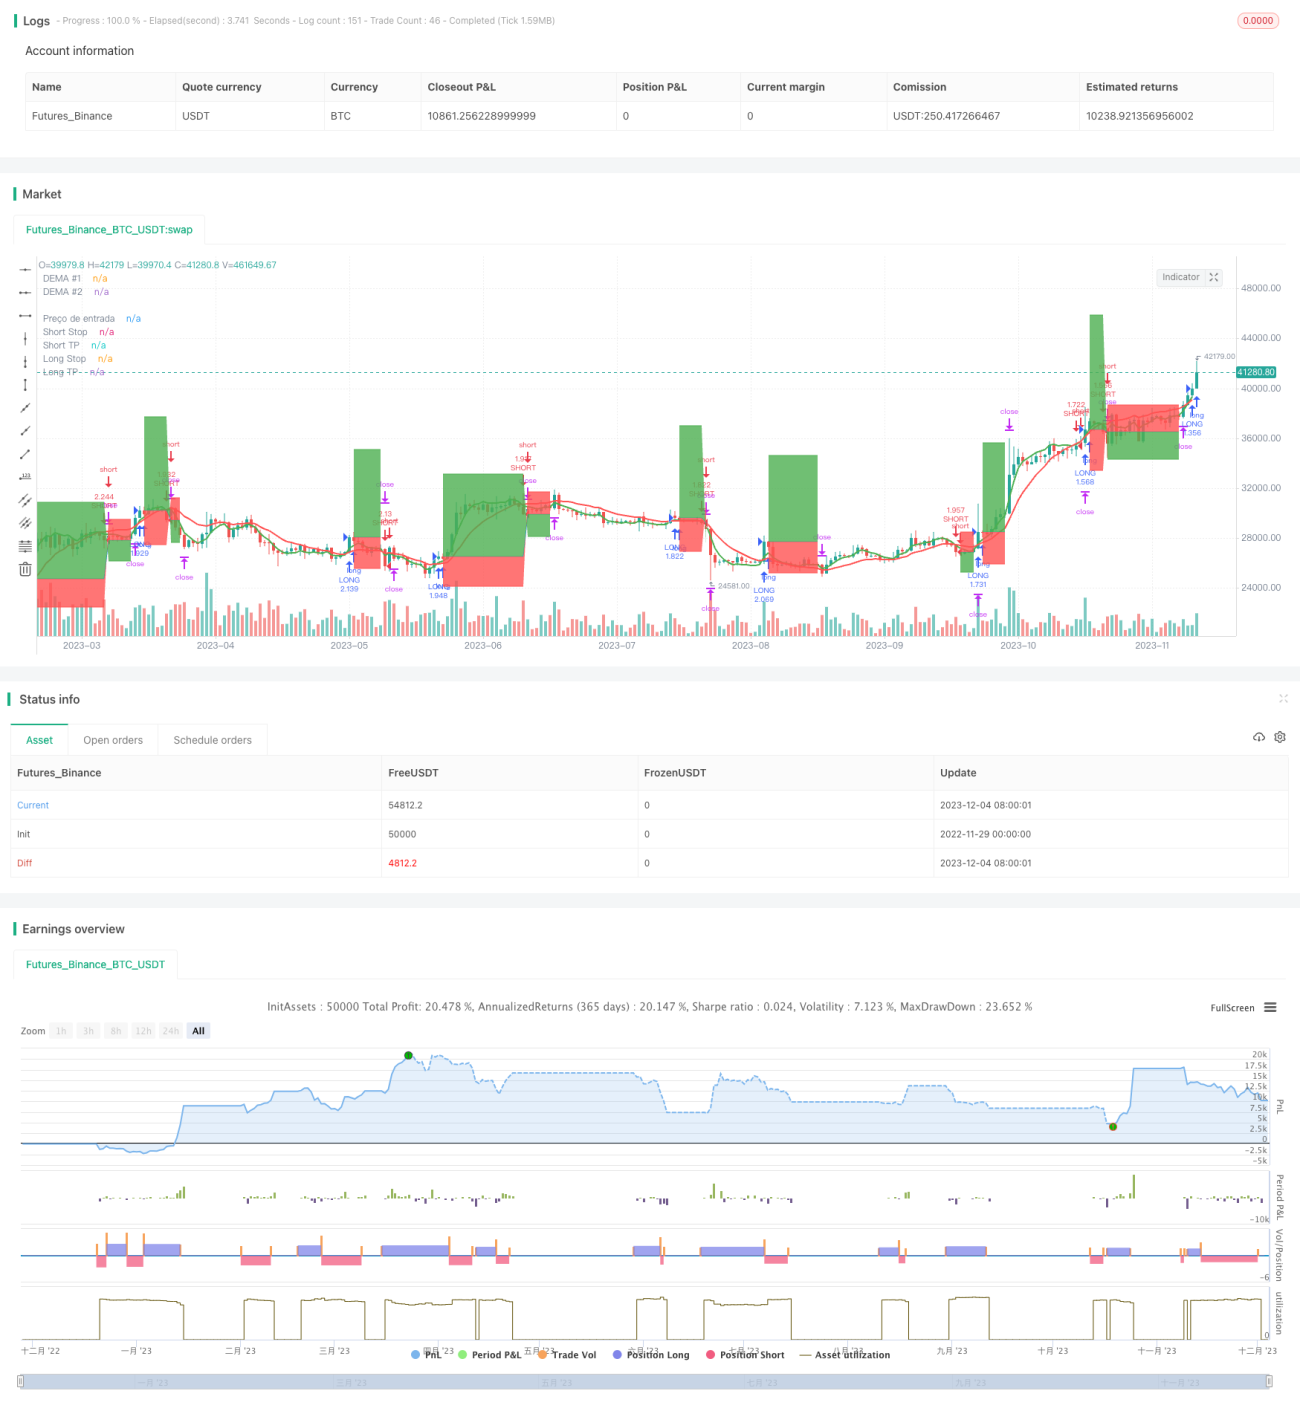
/*backtest
start: 2022-11-29 00:00:00
end: 2023-12-05 00:00:00
period: 1d
basePeriod: 1h
exchanges: [{"eid":"Futures_Binance","currency":"BTC_USDT"}]
*/

// This source code is subject to the terms of the Mozilla Public License 2.0 at https://mozilla.org/MPL/2.0/
// © zeguela
//@version=4
strategy(title="ZEGUELA DEMABOT", commission_value=0.063, commission_type=strategy.commission.percent, initial_capital=100, default_qty_value=90, default_qty_type=strategy.percent_of_equity, overlay=true, process_orders_on_close=true)- 1