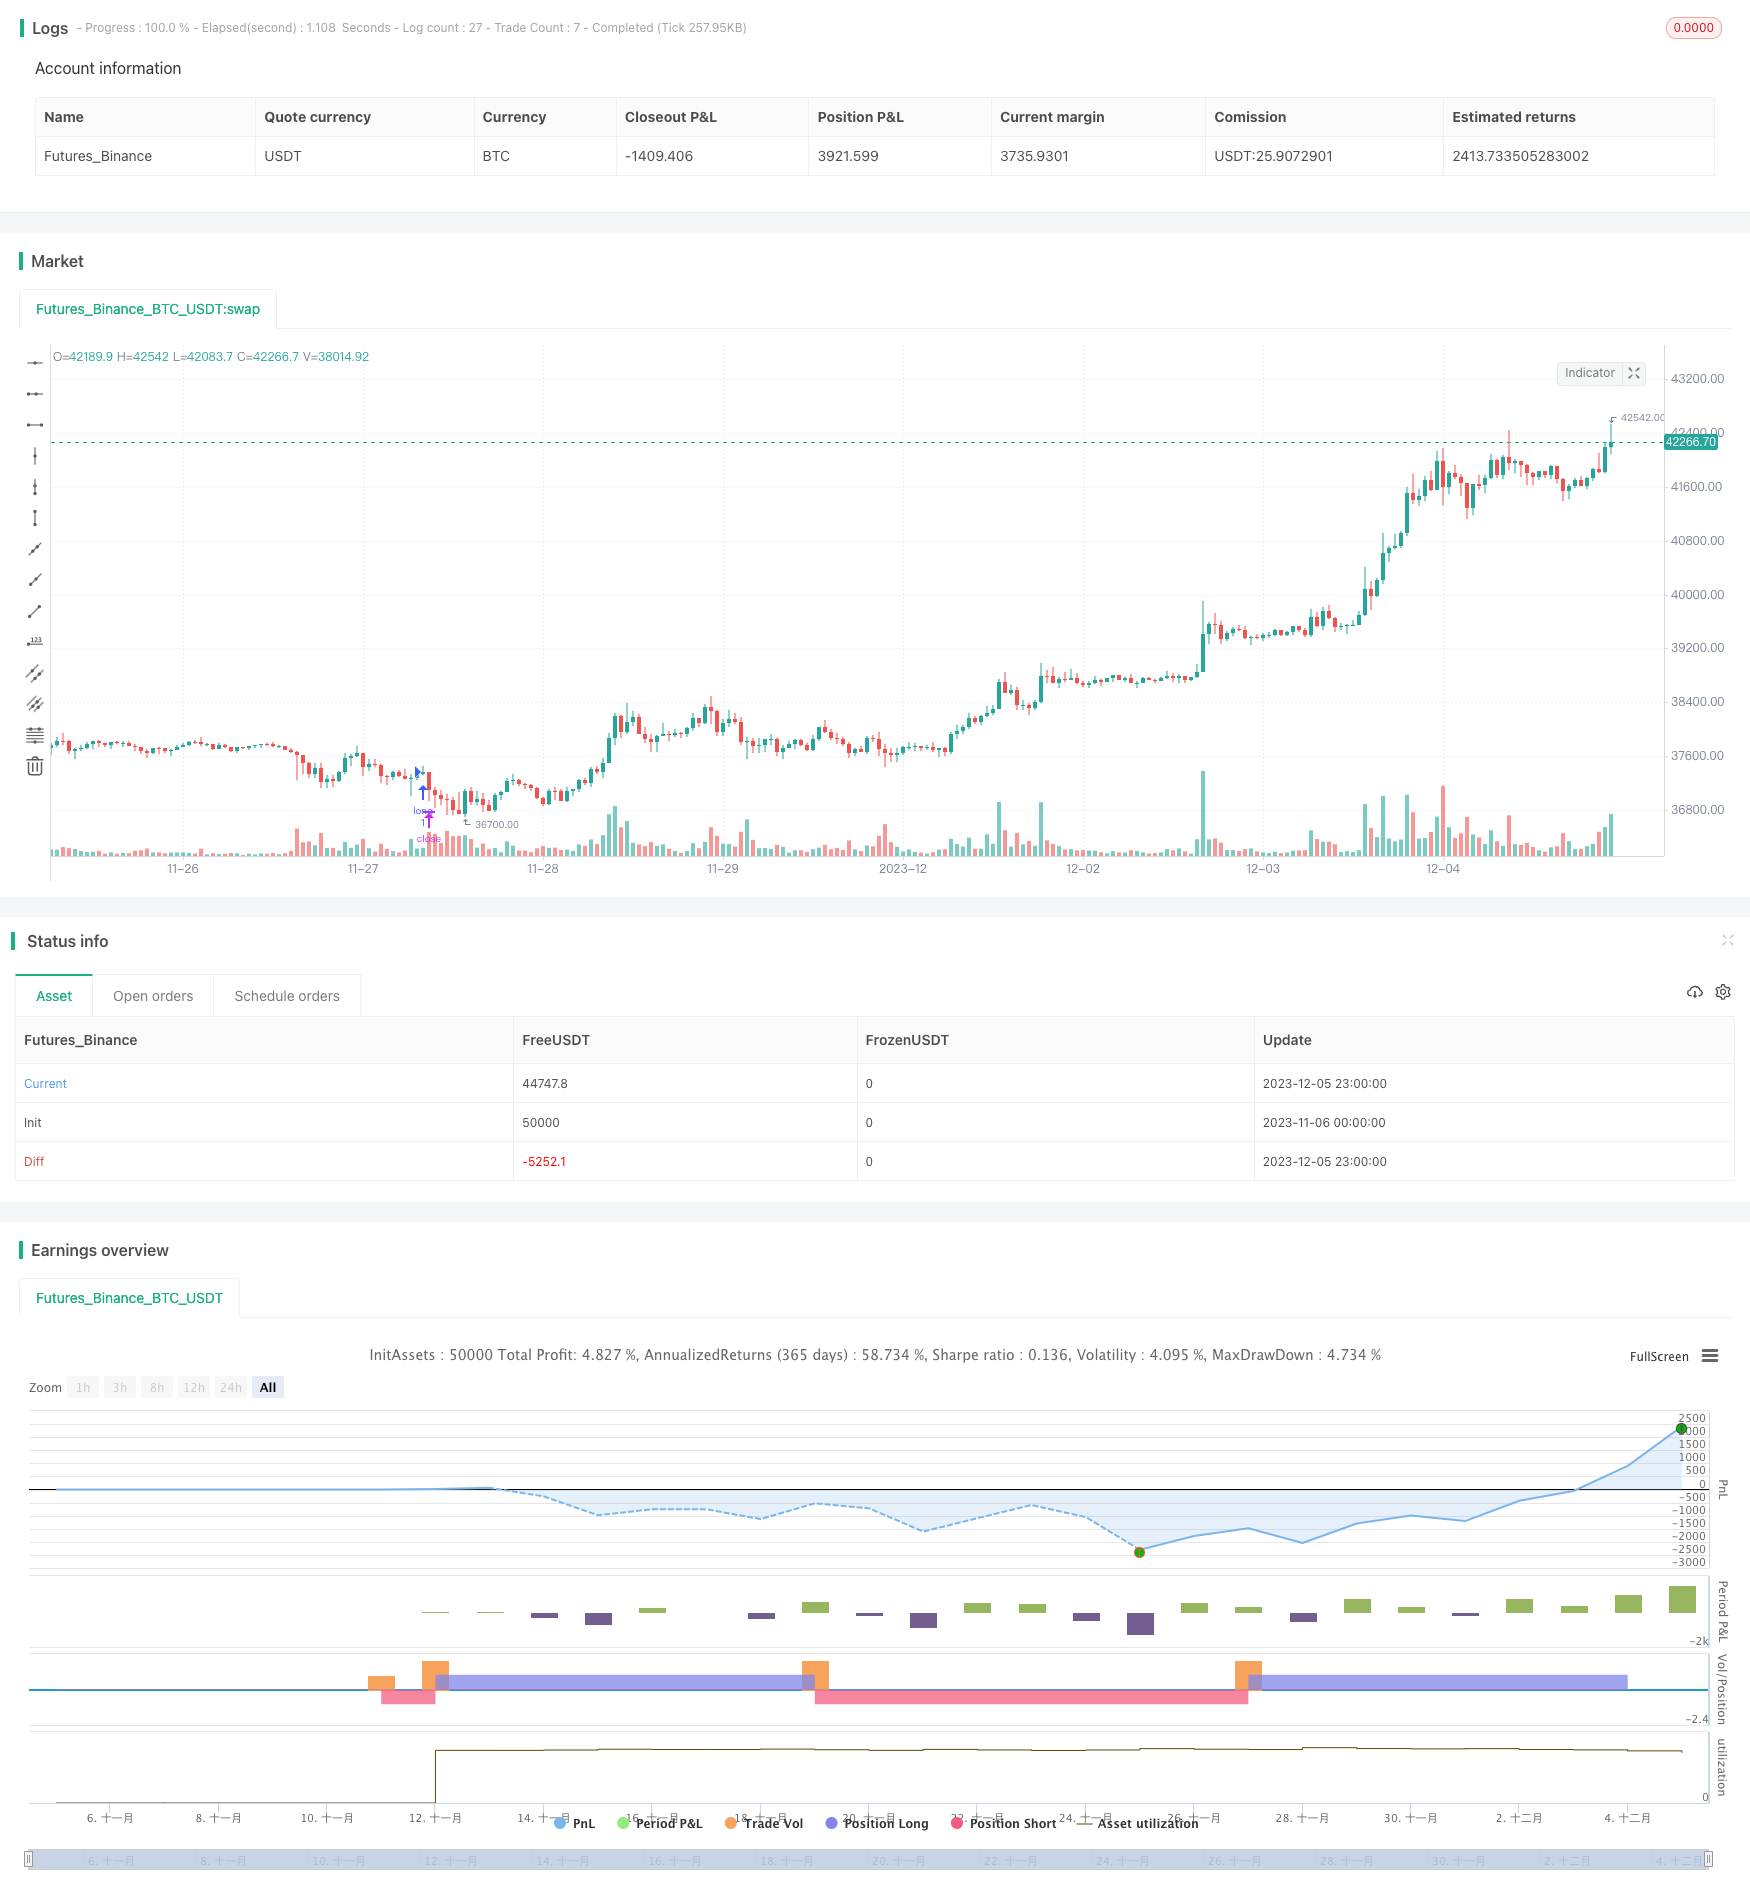
概述
MACD指标底部反转预警策略通过对MACD指标的快慢线进行分析,判断当前价格是否处于历史高点或低点,是否即将发生反转,实现对市场价格走势的快速判断。
策略原理
该策略是MACD标准指标输出的快线和慢线对应数据进行筛选和过滤,判断价格是否进入反转前的临界区,发出买入或卖出信号。
具体来说,策略通过计算MACD的快线与慢线的金叉和死叉来判断价格进入上涨趋势的底部区域或下跌趋势的顶部区域。在金叉时,如果close价格高于前一个bar的close价格,且diff高于前一个bar的diff值,则判断为进入底部区域,发出底部反转预警信号。在死叉时,如果close价格低于前一个bar的close价格,且前一个bar的diff高于当前diff值,则判断为进入顶部区域,发出顶部反转预警信号。
优势分析
- 使用MACD指标,对大盘走势判断准确
- 底部和顶部反转预警,可以及时捕捉反转机会
- 结合快慢线关系,避免多余判断误报
- 可添加报警,实时监控市场变化
风险分析
- MACD指标本身判断滞后,无法确定精确反转点
- 需要适当调整参数,使其适合不同交易品种和时间周期
- 无法判断具体反转幅度和反转后的走势
- 需要同时关注交易量变化判断反转可靠性
解决方法: 1. 结合其他指标如K线形态、交易量变化等判断 2. 调整参数使其适合不同交易品种和时间周期 3. 及时止损,控制风险
优化方向
- 优化MACD指标参数,使其更好判断底部和顶部
- 增加止损逻辑,避免亏损扩大
- 结合交易量变化判断反转可靠性
- 增加机器学习模型判断反转概率
总结
MACD指标底部反转预警策略通过分析MACD快慢线交叉情况,判断价格是否进入反转的临界区,可有效发现底部和顶部,为交易决策提供指引。但MACD本身判断滞后,无法确定精确反转点和反转力度。因此,需适当调整参数,并与其他指标结合使用,控制风险,以发挥该策略的效用。未来可通过引入机器学习等技术进一步提升判断准确性。
策略源码
/*backtest
start: 2023-11-06 00:00:00
end: 2023-12-06 00:00:00
period: 1h
basePeriod: 15m
exchanges: [{"eid":"Futures_Binance","currency":"BTC_USDT"}]
*/

    // ____  __    ___   ________ ___________  ___________ __  ____ ___
   // / __ )/ /   /   | / ____/ //_/ ____/   |/_  __<  / // / / __ |__ \
  // / __  / /   / /| |/ /   / ,< / /   / /| | / /  / / // /_/ / / __/ /
 // / /_/ / /___/ ___ / /___/ /| / /___/ ___ |/ /  / /__  __/ /_/ / __/
// /_____/_____/_/  |_\____/_/ |_\____/_/  |_/_/  /_/  /_/  \____/____/

// This source code is subject to the terms of the Mozilla Public License 2.0 at https://mozilla.org/MPL/2.0/
// © blackcat1402

//@version=5
strategy("[blackcat] L2 Reversal Labels Strategy", overlay=true,  max_bars_back=5000, max_labels_count=500)

[diff, dea, macd] = ta.macd(close,12, 26, 9)
a1 = ta.barssince(ta.crossover(diff,dea)[1])
a2 = ta.barssince(ta.crossunder(diff,dea)[1])
bottom_zone = (close[a1+1]>close) and (diff>diff[a1+1]) and ta.crossover(diff,dea)
top_zone = (close[a2+1]<close) and (diff[a2+1]>diff) and ta.crossunder(diff,dea)

// Plot labels
l0 = top_zone ? label.new(bar_index, high * 1.0, 'Near Top', color=color.new(color.red, 50), textcolor=color.white, style=label.style_label_down, yloc=yloc.price, size=size.small) : bottom_zone ? label.new(bar_index, low * 1.0, 'Near Bottom', color=color.new(color.green, 50), textcolor=color.white, style=label.style_label_up, yloc=yloc.price, size=size.small) : na

if bottom_zone
    longmsg = 'Bottom Reversal Soon!'
    alert(message=longmsg, freq=alert.freq_once_per_bar_close)
else if top_zone
    shortmsg = 'Top Reversal Soon!'
    alert(message=shortmsg, freq=alert.freq_once_per_bar_close)


longCondition = bottom_zone
if (longCondition)
    strategy.entry("long", strategy.long)

shortCondition = top_zone
if (shortCondition)
    strategy.entry("short", strategy.short)