Double Reversal Percentage Change Bar Quantitative Strategy

Overview
The name of this strategy is "Double Reversal Percentage Change Bar Quantitative Strategy". This strategy combines two different types of strategies for portfolio trading to give full play to their respective advantages and achieve better trading performance.
The first strategy uses the principle of reversal strategy to judge whether there is a reversal signal by comparing the closing price with the previous day or several days. The second strategy utilizes the "percentage change bar chart" indicator to determine the daily fluctuation range and establish positions accordingly.
Strategy Principles
The double reversal percentage change bar quantitative strategy uses two main components:
The first part is the 123 reversal strategy. Its judgment logic is:
-
If the closing price is lower than the previous closing price and the Stoch fast line is higher than the slow line and above the 50 level, it is considered overbought and a sell signal is generated.
-
If the closing price is higher than the previous closing price and the Stoch fast line is lower than the slow line and below 50, it is considered oversold and a buy signal is generated.
-
Establish long or short positions according to the generated buy and sell signals.
The second part is the percentage change bar chart indicator. Its judgment logic is:
-
Calculate the percentage change of the current bar relative to the bar N periods ago (defined by the input_barsback parameter).
-
If the percentage change is higher than the positive value area defined by the BuyZone parameter, a buy signal is generated; if it is lower than the negative value area defined by the SellZone, a sell signal is generated.
-
Establish long or short positions according to the generated buy and sell signals.
Finally, positions will be established only when the signals generated by the two strategies are consistent. Otherwise, there will be no change in positions.
Advantage Analysis
The double reversal percentage change bar quantitative strategy has the following advantages:
-
It absorbs the strengths of two different types of strategies and has the potential to obtain more stable returns. The 123 reversal strategy performs well in identifying market reversal points; the percentage change bar chart indicator quickly recognizes breakout trends. The combination can identify both reversals and capture trends.
-
The combination of signals from the two strategies can effectively filter out some false signals and reduce unnecessary stop losses to lower trading risks.
-
The 123 reversal strategy has large optimization space. By adjusting parameter combinations, it can be optimized and adapted for different products and cycles.
-
The percentage change bar strategy is intuitive. The trading risk is easy to grasp and control by adjusting parameters.
Risk Analysis
The double reversal percentage change bar quantitative strategy also has some risks:
-
When the signals from the two strategies do not match, positions cannot be established, missing some trading opportunities. We can appropriately expand the parameter range of the percentage change bar chart to increase the probability of matching.
-
The 123 reversal strategy is sensitive to parameters. Unsuitable parameter combinations may lead to too many false signals. Parameters should be tested separately for different products to ensure stability.
-
If the direction of the buy and sell signals generated by the percentage change bar chart is wrong and matches the 123 reversal signals, it will lead to considerable losses. We should appropriately reduce the amplitude of the percentage change parameters to control risks.
-
After the strategy has run for some time, the adaptability of the parameters will decline. We need to monitor the return curve and trading signals of the strategy to determine when to adjust the parameters.
Optimization Directions
The double reversal percentage change bar quantitative strategy can also be optimized in the following aspects:
-
Optimize parameters like Length, KSmoothing, DLength for the 123 reversal strategy to find parameter portfolios more suitable for different products and cycles.
-
Adjust the input_barsback parameter of the percentage change bar chart to assess the impact of longer or shorter lookback periods on the strategy.
-
Introducing stop loss strategies can effectively avoid large losses caused by incorrect signals from percentage change bars.
-
Attempt to train a more accurate percentage change model to determine entry and exit timing via machine learning methods to obtain higher win rate.
-
Increase other auxiliary technical indicators for judgment to enrich trading signals from the strategy and increase trading frequency.
Conclusion
The double reversal percentage change bar quantitative strategy makes full use of the strengths of two different types of strategies and combines them to expand profit space while controlling risks. This easy-to-understand and adjustable strategy is well-suited for research and practice. With further parameter tuning and strategy optimization, it is expected to obtain more steady excess returns.
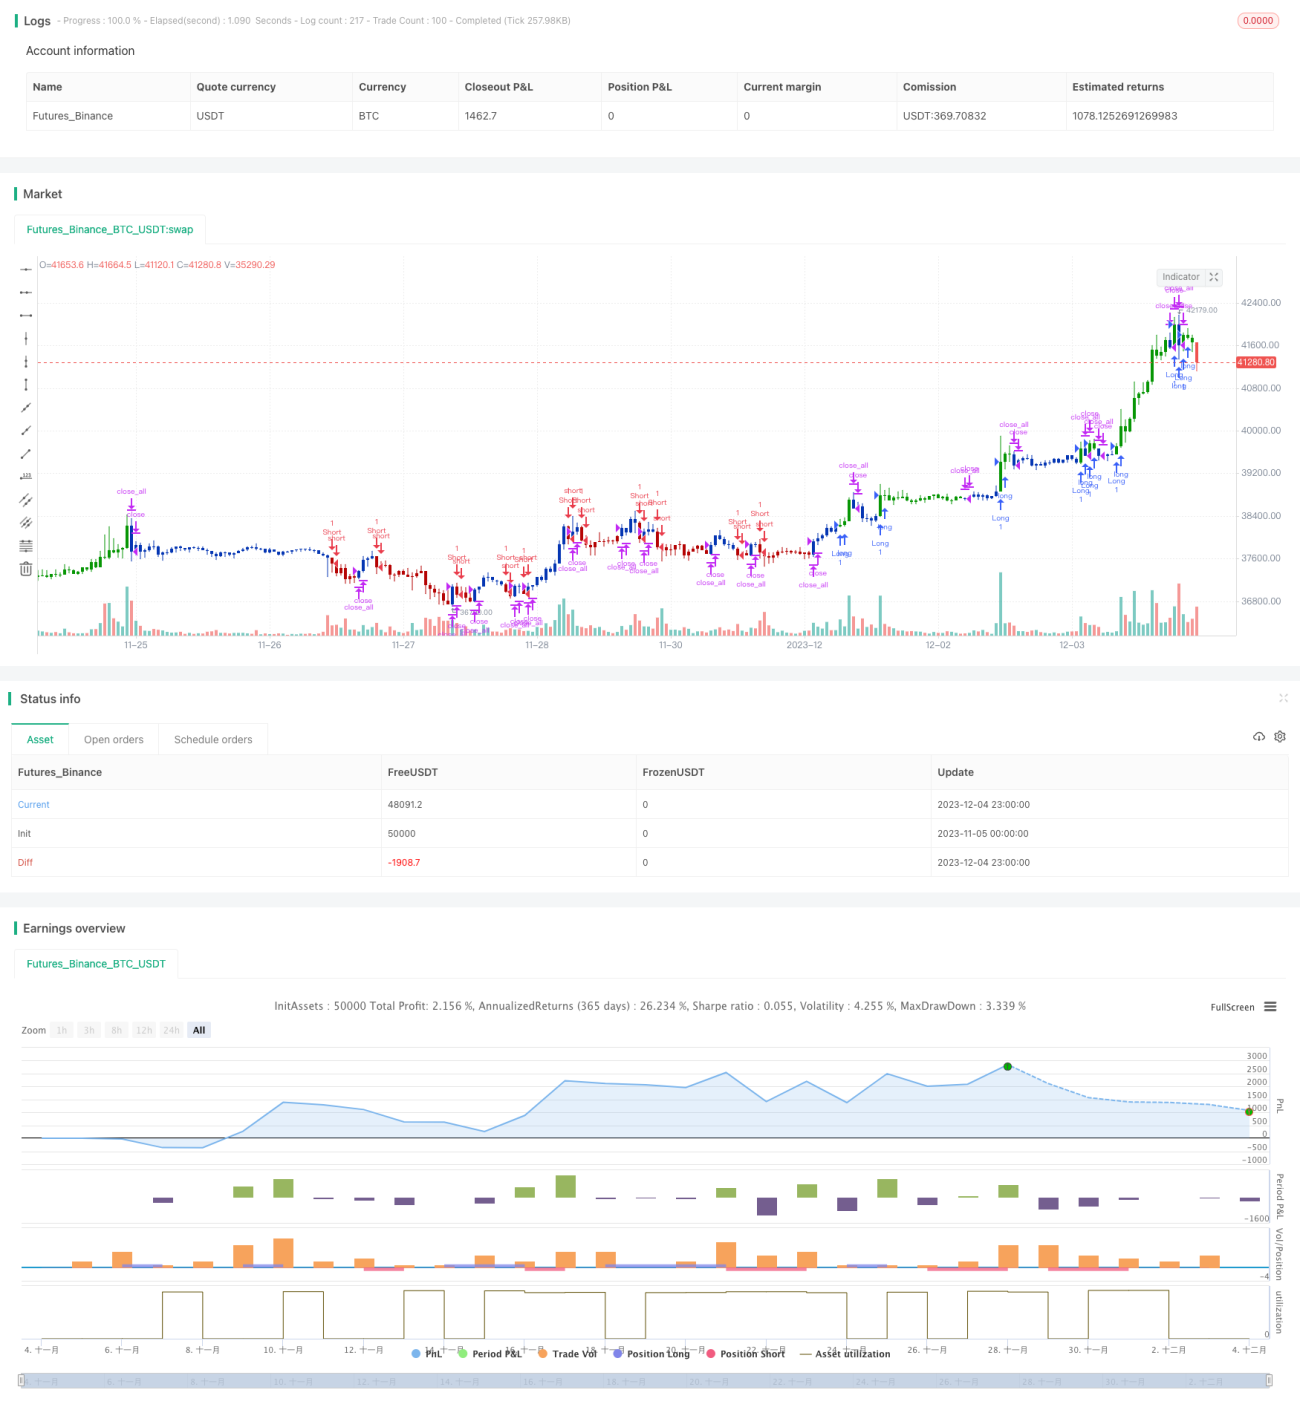
/*backtest
start: 2023-11-05 00:00:00
end: 2023-12-05 00:00:00
period: 1h
basePeriod: 15m
exchanges: [{"eid":"Futures_Binance","currency":"BTC_USDT"}]
*/

//@version=4
////////////////////////////////////////////////////////////
//  Copyright by HPotter v1.0 31/03/2021
// This is combo strategies for get a cumulative signal. - 1